INTRODUCTION
Guinea-Bissau is located between the Canary Current Large Marine Ecosystem (CCLME), strongly influenced by the Canary Current, which flows southward along the African coast between 30°N and 10°N (Barton et al., Reference Barton, Arístegui, Tett, Cantón, García-Braun, Hernández-León, Nykjaer, Almeida, Almunia, Ballesteros, Basterretxea, Escánez, García-Weil, Hernández-Guerra, Ópez-Laatzen, Molina, Montero, Navarro-Pérez, Rodríguez, Van Lenning, Vélez and Wild1998), and the Guinea Current Large Marine Ecosystem (GCLME), which extends southward from the intense upwelling area of the Guinea Current (GC) to the northern limit of the Benguela Current (Ukwe et al., Reference Ukwe, Ibe, Nwilo and Huidobro2006). Both are considered highly productive ecosystems and important reservoirs of marine biological diversity (Heileman, Reference Heileman, Sherman and Hempel2009; Heileman & Tandstad, Reference Heileman, Tandstad, Sherman and Hempel2009).
South of Cape Verde, the continental shelf progressively extends offshore from north to south with a maximum breadth exceeding 200 km at 9.30°N. Off Guinea-Bissau, the inshore part of the shelf is contorted by large shallow areas featuring large river run-offs and extensive mangrove forests lining the coastline of the mainland and of the Bissagos Islands. This freshwater input sets a coastal front around the archipelago that favours the presence of strong coastal currents.
The Tropical Eastern North Atlantic (TENA) is characterized by zonal current bands associated with the North Equatorial Current (NEC) system. The NEC borders the southern rim of the subtropical gyre aided by the trade winds blowing between 7 N and 20 N. Winter dwindling of the trades allows for NEC retroflection close to Brazil, its fusion with the North Brazil Current (NBC) and the formation of a North Equatorial Counter Current (NECC) between 10 N and 5° N, including a northern NECC branch (nNECC) between 8° N and 10 N (Stramma et al., Reference Stramma, Brandt, Schafstall, Schott, Fischer and Körtzinger2008) (Figure 1). Both NECCs recirculate cyclonically around the Guinea Dome, a near-surface permanent feature on the eastern side of the thermal ridge between the NEC and the NECC, at 9 N to 10.5 N and 22°W to 25 W (taking the southwest location in summer). Central waters of about 27.1 sigma-t density south of the Cape Verde Frontal Zone (CVFZ) have low oxygen levels (Stramma et al., Reference Stramma, Hüttl and Schafstall2005). This Oxygen Minimum Zone (OMZ) is a consequence of sluggish ocean ventilation and enhanced respiration (Stramma et al., Reference Stramma, Brandt, Schafstall, Schott, Fischer and Körtzinger2008). Both NECC components are among the few sources of oxygen-rich water for the central waters in the Guinea Dome region (Stramma et al., Reference Stramma, Hüttl and Schafstall2005).
Schematics of near-surface circulation in the Tropical Eastern North Atlantic (adapted from Stramma et al., Reference Stramma, Brandt, Schafstall, Schott, Fischer and Körtzinger2008) together with the mean Absolute Dynamic Topography (ADT) over the cruise time span. ADT ranges from 140 to 600 mm, and contour interval is 20 mm. NECC stands for the North Equatorial Counter Current and nNECC for northern NECC. The approximate location of the Guinea Dome is also depicted. The 50, 100, 200, 500 and 4000 m-isobaths are also shown. The small grey circles correspond to the locations of plankton and hydrographic stations.

The mixed layer of the tropical Atlantic Ocean is formed by TSW with temperatures of about 27°C (Stramma & Schott, Reference Stramma and Schott1999). Whereas the relatively low surface salinities are due to an excess of precipitation, the salinity maximum located at the lowest boundary of the TSW defines the Salinity Maximum Water (SMW) or Subtropical Underwater (SU). In the tropics/subtropics, this water forms a transition region by subduction flowing equatorward.
Seasonality dominates the temporal scale of variability in Guinea-Bissauan waters (Berrit & Rebert, Reference Berrit, Rebert and Berrit1977). South of Cape Verde, upwelling-favourable winds are frequent from December to June, whereas in summer, warm tropical surface waters may extend with the so-called Mauritanian Current, north of 20 N up to Cape Blanc. Trade winds divert and generate a wind-sheltered zone over a wide shelf in the lee of Cape Verde that produces a positive wind stress curl zone with an associated offshore minimum temperature over the middle shelf.
Productivity is relatively high in the area due to upwelling events and input of organic matter from river run-offs (Berrit & Rebert, Reference Berrit, Rebert and Berrit1977). Marine organisms have adapted to this seasonal variability of the ecosystem and are more productive during the dry season (Domain, Reference Domain1982; Longhurst, Reference Longhurst1983). An example of adaptive behaviour are the feeding migrations of fish along the coast (Boely & Fréon, Reference Boely, Fréon, Troadec and Garcia1979; Domain, Reference Domain, Troadec and Garcia1979; Amorim et al., Reference Amorim, Mané, Sotobberup, Chavance, Gascuel, Vakily and Pauly2002) that follow the cycle of wet and dry seasons.
Several authors underlined the importance of those zones as spawning areas and nursery grounds for many economically important species of fish (Lopes & Afonso, Reference Lopes and Afonso1995; Amorim et al., Reference Amorim, Mané, Sotobberup, Chavance, Gascuel, Vakily and Pauly2002), thereby indicating how crucial these areas are to maintain marine populations.
The fishing resources of the Guinea-Bissauan ecosystem are composed of a highly diverse assemblage of fishes that include small pelagic species (sardinella, shad), large pelagic fishes (tuna, billfish), crustaceans (shrimp, lobster) and molluscs (cuttlefish, octopus), and demersal species (sparids, croakers). The catch of artisanal fisheries includes species such as mullets (Mugil spp. and Liza spp.), bonga shad (Ethmalosa fimbriata Bowdich, 1825), ilisha (Ilisha africana Bloch, 1795), sardinellas (Sardinella spp.), grunts (Pomadasys jubelini Cuvier, 1830), sharks (Carcharhinus spp., Sphyrna spp.), rays and guitar fishes (Rhinobatus spp.) and barracudas (Sphyraena spp.). An industrial demersal fishery is also carried out by foreign vessels, targeting mainly finfish species, such as catfishes (Arius spp.), giant African threadfin (Polydactylus quadrifilis Cuvier, 1829) and lesser African threadfin (Galeoides decadactylus Bloch, 1795), meagre (Argyrosomus regius Asso, 1801), croakers (Pseudotolithus spp.) and grunts (Pomadasys spp.) (Fager & Longhurst, Reference Fager and Longhurst1968; Domain et al., Reference Domain, Kéita, Morize, Domain, Chavance and Diallo1999). This fishery also catches small pelagics, such as sardinellas, bonga shads and scads (Decapterus spp.). Furthermore, the foreign industrial tuna fishery mainly targets albacore (Thunnus alalunga Bonnaterre, 1788) and skipjack (Katsuwonus pelamis Linnaeus, 1758).
Studies on the early stages of teleost fishes are crucial for understanding the biology and ecology of the species, and the dynamics of their populations. In fact, the planktonic larval period is critical (May, Reference May and Blaxter1974), since the processes occurring during this period largely determine the power of the recruitment size and, therefore, the number of individuals who will eventually join the adult population. Since the biological components of marine ecosystems are strongly influenced by their physical habitat, the environmental variability causes variations in the survival, growth and distribution of marine organisms, there are no stationary stages or ecological balances. As a result, fluctuations in population sizes can be considerable (Kawasaki, Reference Kawasaki, Kawasaki, Tanaka, Toba and Taniguchi1991).
Since the early 1990s, the scientific visibility of ecological studies of the early stages of fishes has grown noticeably, as these studies are crucial for the sustainable management of marine resources.
This work aimed to provide important information on the composition of the larval fish community in a highly diverse area but dramatically lacking in such data; to acquire knowledge on the larval distribution of the most important fish species; and to understand how local oceanographic features influence the abundance and distribution of these larvae. The study also describes the distribution of the main spawning grounds and the hydrographic scenario in which they develop.
MATERIALS AND METHODS
Data were taken during an oceanographic survey carried out in autumn 2008 (GUINEA-BISSAU 0810) to assess the demersal fishing resources in Guinea-Bissau's Exclusive Economic Zone (EEZ). Concurrent with the fishing trawl sampling, an ichthyoplankton-CTD sampling grid was included to analyse the hydrology and distribution of early life fish stages in this area.
The survey was carried out from 22 October to 11 November 2008 on board the RV ‘Vizconde de Eza’. The surveyed area covered the shelf and slope of Guinea-Bissau's EEZ, comprised between latitudes 12°22′N and 10°00′N.
The oceanographic setting was described with the aid of satellite absolute dynamic topography (ADT) retrieved from AVISO, together with sea surface temperatures (SST) and near-surface chlorophyll-a (chl-a) concentration for the cruise time span obtained from the Giovanni online data system, and developed and maintained by the NASA Goddard Earth Sciences Data and Information Services Center (GES DISC). Blended ocean winds QSCAT/NCEP (dataset ds744.4) were provided by the Research Data Archive (RDA) maintained by the Computational and Information Systems Laboratory (CISL) at the National Center for Atmospheric Research (NCAR). NCAR is sponsored by the National Science Foundation (NSF). The original data are available from the RDA (http://dss.ucar.edu) in dataset number ds744.4.
During the survey, a total of 98 valid daytime fishing hauls were carried out at depths ranging between 20 and 1000 m. A random stratified sampling design based on four bathymetric strata (<50, 50–200, 200–500 and 500–1000 m) was used. Hauls of standard 30 min duration were conducted using a ‘Conakry’ otter bottom trawl (‘baka’ type). The fish caught in each haul were identified to the lowest taxonomic level, and then counted and weighed. Biomass was estimated for every species by the swept area method (Sparre & Venema, Reference Sparre and Venema1992).
Hydrographic and ichthyoplankton sampling was based on a systematic station grid covering depths from 20 to 1000 m (Figure 1). The stations were distributed over eight equidistant transects, with a minimum of three stations per transect. Each station was either separated by 10 or 20 nm depending on shelf width. In the area (north of 11°N) where the shelf and the bathymetric strata are narrower, the stations were separated by 10 nm. In the southern zone, where the shelf and the bathymetric strata are wider, stations were more separated, bearing in mind that each bathymetric stratum should have at least one sampling station.
A full-depth CTD and a surface plankton tow were conducted at each station. The CTD probe was a recently calibrated SBE25, equipped with a SBE43 oximeter and a Seapoint fluorometer. The CTD acquired data from surface to bottom, reaching a maximum depth of 1000 m. Standard processing of CTD data was done prior to mapping the variables observed.
Plankton sampling was conducted with a squared Bongo net of approximately 1 m2 mouth opening, equipped with black nets of approximately 1 mm mesh-size and a 300 µm cod-end to collect the sample. The plankton tows were carried out at night to facilitate the capture of larger larvae because most of them concentrate on the surface at night. All plankton tows were horizontal at the surface, done at a speed of 2 to 2.5 knots and with an average duration of 10 min.
Each mouth of the Bongo frame was equipped with a General Oceanics 3031 flowmeter to estimate the volume of water filtered. Moreover, a Minilog sensor storing tow data, such as time, depth and temperature, was fixed onto the tow wire. Plankton samples were conserved in seawater fixed with 4% formalin buffered with disodium tetraborate. Eggs and larvae were sorted and counted. Larvae were identified to the lowest taxonomic level possible, according to the various taxonomic references consulted (Richards, Reference Richards2006; Fahay, Reference Fahay2007). However, since there is a general lack of larval descriptions in this area, taxonomic identification also relied on the information of juvenile and adult specimens captured by bottom trawl in the same survey.
RESULTS
Oceanographic characterization
WIND FORCING
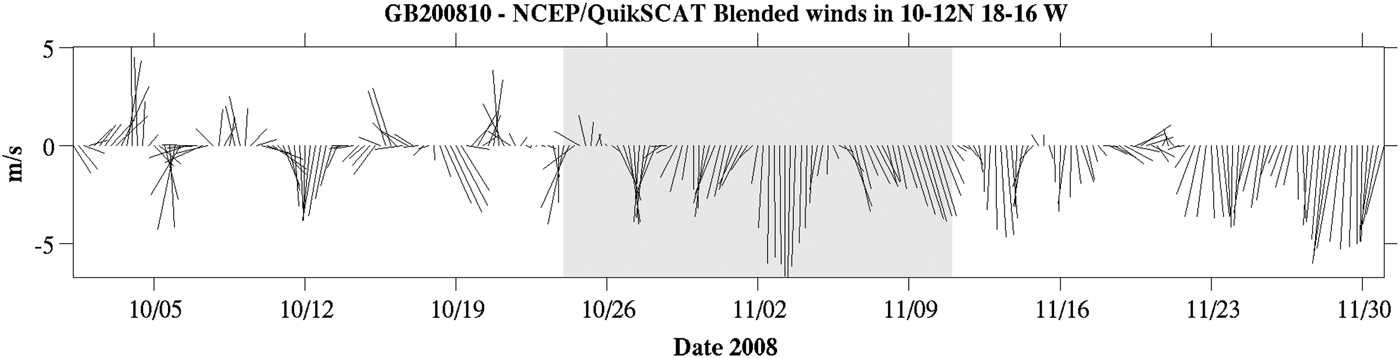
Figure 2 shows a time-series of the spatial average of wind forcing in the cruise area in October–November 2008. Before 26 October the wind was variable both in intensity and direction. The onset of the persistent upwelling-favourable north-westerly trades occurred at the beginning of the cruise and prevailed throughout the whole cruise time span. Wind intensity increased towards the mid part of the survey, with speeds exceeding 6 m s−1. Figure 2 also shows that northerlies outlived the sampling period and that the cruise was carried out approximately at the beginning of the upwelling season.
QSCAT/NCEP Blended Ocean Wind sticks for the cruise area in October–November 2008. Data were provided by Winds from Colorado Research Associates (version 5.0). The shaded rectangle corresponds to the cruise dates.
From north to south, the Cape Verde peninsula features a sharp offshore promontory followed by a gentle eastward curving of the coastline to the south. This shape induced strong spatial heterogeneity to the oceanic wind field (Figure 3A). While the prevailing northerlies are vigorous to the north of 14 N, the ocean south of Cape Verde and the waters south-east of the Bissagos Islands, in particular, are relatively sheltered from the prevailing northerlies. Therefore, in addition to large-scale coastal upwelling associated with the upwelling-favourable northerlies, a cyclonic wind curl belt emerged south of the cape. This phenomenon appeared to be particularly intense coinciding with the winds peaking on 3 November, both west of Guinea-Bissau coasts off the 20 m-isobath and along a meandering N–S path running 18 W, south of 11 N (Figure 3B). Resulting upward Ekman pumping velocities (ω EK = curl(τ/ρf), where τ is wind stress, ρ is water density averaged in the Ekman layer and f is the Coriolis parameter, in excess of 0.7 m day−1, are expected for zones where wind stress curl is above 3 × 10⁻⁷ Nw m−3.
QSCAT/NCEP Blended Ocean Wind vectors and wind stress curl (10−7 Nw m−3). (A) Mean vector and wind stress curl fields over the cruise time span; (B) Vector and curl fields on 3 November, coinciding with the intensification of upwelling-favourable winds. Note the intense cyclonic curl generation in the lee of Cape Verde. Data was provided by Winds from Colorado Research Associates (version 5.0).
REMOTELY SENSED PATTERNS
Figure 4A shows the SST averaged for the cruise period. North of the cruise area and running westwards at 14 W, there was an intense and meandering surface thermal front separating the colder and upwelled waters north of Cape Verde from the warmer Tropical Surface Water (TSW) in the south. South of 12 N, the Bissagos Islands waters inside the 20 m-isobath were warmer (T > 29°C) and probably continental in origin. Offshore, the relatively warm TSW extended northwards, possibly pushed by the internal branch of the Guinea Dome. In between, colder waters (T < 28.4°C) stretched along the inner slope in response to the cyclonic wind curl south of Cape Verde (Figure 3B). The CTD grid occupied the zone between the TSW and this band of colder water.
(A) Mean Sea Surface Temperature field (°C) and (B) Mean Chlorophyll-a concentration (mg m−3) over the cruise time span. Hydrographic stations are indicated as grey circles. The sampling grid captured the front between the local upwelling and the offshore TSW. The front between the West African upwelling and the warmer TSW runs north of 13° N. The warm waters around the Bissagos Islands are separated from the offshore TSW by the cold intrusion related to the cyclonic wind curl generated in the lee of Cape Verde.
Figure 4B shows that the near-surface chl-a fields were in close agreement with the thermal picture. The shelf area was occupied by chlorophyll–rich water, although values were generally lower offshore. This E–W pattern was disrupted by a number of structures. First, there was a high chl-a coastal filament rooted at the Cape Verde peninsula and stretching west of 20 W along the aforementioned thermal front. Second, a high chl-a spot with concentrations greater than 10 mg m−3 was spatially coincident with the previously described offshore cold water band situated over the slope, between 10.5 N and 11.5 N. This pattern contrasted with the lower values found both in- and offshore. A remarkable high chl-a water pocket was seen centred at around 10.5 N 18°W, apparently in response to the offshore cyclonic wind stress curl band already described.
WATER MASSES
Figure 5 shows the T–S plot of the recorded CTD profiles. The nearly linear T–S relationship indicates the presence of the South Atlantic Central Water (SACW). The SACW is formed in the south-western South Atlantic, near the subtropical front, and spreads northwards underneath the TSW. This SACW can be clearly distinguished from the more saline North Atlantic Central Waters (NACW) observed north of the CVFZ (see reference lines to NACW in Figure 5).
T–S plot of CTD profiles acquired during cruise together with the T–S relationships in the Tropical Eastern North Atlantic. The two SACW varieties present at the NEC and NECC, respectively are shown. The T–S relationship within the frontal zone is adapted from Tomczak and Godfrey (Reference Tomczak and Godfrey2003, p. 267). Eastern North Atlantic Central Water (ENACW) relationships are also plotted. The mixing between NEC and NECC waters was particularly intense at the stations situated along the inner slope over depths up to 500 m (stations 03, 04, 08, 10, 14 and 32). The greyscale bar indicates the observation depth (m).
A front between the two SACW types occurs across the boundary between the NECC and the NEC, near 10 N (Tomczak & Godfrey, Reference Tomczak and Godfrey2003): less saline SACW moves eastward along with the NECC and above the more saline SACW, which flows westward along with the NEC. Around the Guinea Dome, less saline SACW is transported northward by the internal branch of the dome, meeting the more saline SACW, transported south of CVFZ by the NEC. The confluence and mix of the two main varieties of SACW was recorded in our study as a subsurface temperature and salinity maximum, observed between 400 and 600 m depth.
The distribution of thermohaline properties approximately along longitude 17.7 W (Figure 6) illustrates the previously described pattern. This section has been chosen to avoid the intense continental effects noted on sections closer to the coast. Despite the relatively small extension of the sampled area, most water masses present in the Equatorial Atlantic are found here. The less saline (33.5) and warmer (29°C) TSW occupies the ocean lid at depths shallower than 30 m. At its shallowest, the SMW is recognized as a salinity maximum, slightly above the 25.8 isopycnal.
Vertical sections across an offshore N–S transect; (A) Temperature (°C); (B) Salinity and sigma-t (kg m−3, in white lines); (C) Dissolved oxygen (ml l−1).
Below the SMW emerges the signature of the central waters. The boundary between the SACW and the underlying Atlantic Antarctic Intermediate Water (AAIW) is characterized by a large oxygen minimum layer, centred between the 27.0 and 27.1 isopycnal (at around 400 m depth). Salinity around the 27.0 isopycnal increases northwards, in agreement with the meridional alignment of both SACW types, although at mid depths (150–400 m) a mesoscale anomaly centred at 11.50°N broke this pattern, as can be noted by the relatively low salinities found at station 03.
The zonal section drawn in Figure 7 at 10.30°N gives further insight into the distribution of water masses. Uplifting of isotherms was noted below the TSW layer, i.e. the 13.5°C isotherm rises approximately 100 m over 60 km from the slope to the coast. This elevation of the isotherms was also observed as a vertical stretching of isohalines and isopycnals.
Vertical sections across a W–E transect; (A) Temperature (°C); (B) Salinity and sigma-t (kg m−3 in white lines); (C) Dissolved oxygen (ml l−1).
HORIZONTAL FIELDS AND GEOSTROPHIC CIRCULATION
Hydrography and mesoscale
The surface layer at 10 m was characterized by an intense thermohaline front running NW–SW nearly parallel to the 100–200 m-isobaths (Figure 8). Up to roughly the 20 m-isobath, the inner shelf was occupied by colder (T < 28.5°C) and less saline (S < 34) water that spatially coincided with the positive wind curl zone in the lee of Cape Verde (see Figure 3). The SST image (Figure 4A) suggested spatial continuity between this colder, less saline strip and the Cape Verde coastal upwelling to the north. As a result, high chl-a values were observed in this zone, both from satellite images (Figure 4B) and in situ chl-a fluorescence (Figure 8C). Offshore, warmer (T > 28.5°C) and more saline (S > 34.5) TSW waters were ubiquitous. In Figure 6, the vertical sections showed that this less saline and buoyant surface layer was sitting on the 20–30 m layer of the water column, right above the subsurface salinity maximum centred at approximately 50 m and which defined the SMW. Below the relatively oxygen-rich surface mixed layer (>4 ml l−1), subsurface layers were characterized by dissolved oxygen concentrations below 3 ml l−1, falling to hypoxia (<1 ml l−1) at about 400 m depth (Figure 8).
Near-surface horizontal fields: (A) Temperature (°C); (B) Salinity; (C) Chl-a fluorescence (mg m−3) at 10 m; (D) Geostrophic velocity vectors and geopotential topography at 9 m referred to 40 dbar. Reference arrow is 0.2 m s−1.
The geostrophic velocity field at 9 m (reference level is 40 m) showed the near-surface dynamic effects associated with the front between TSW and upwelled waters over the top of the water column (Figure 9D). Centred at 10.50°N 17 W, a cyclonic zone extended along the eastern part of the study area. A meandering, equatorward jet, with velocities greater than 0.5 m s−1, was running along the 300 m-isobath. This jet was leaving TSW waters in order to occupy an anticyclonic zone to the right and freshly upwelled waters to the left. Although the sampling scheme could not provide a more detailed picture, remotely sensed data (SST, chl-a, wind speed and wind stress curl) showed that the upper-layer circulation was strongly wind-driven.
Horizontal fields at 250 m. (A) Temperature (°C); (B) Salinity; (C) Chl-a fluorescence (mg m3); (D) Geostrophic velocity vectors and geopotential topography at 100 dbar referred to 300 dbar (dyn m). Reference arrow is 0.2 m·s−1.
On the contrary, Figure 9 shows that below the SMW, the coastal zone was invaded by oxygen-poor, warmer and more saline waters than those of the oceanic zone. Water more saline than 35.55, temperature above 14.5°C and dissolved oxygen concentrations below 1 ml l−1 occupied the inshore area, whereas offshore waters recorded salinity values lower than 35.25, temperatures below 12.5°C and dissolved oxygen concentrations greater than 2.2 ml l−1. At 250 m, these oxygen-rich waters were associated with NECC recirculation around the eastern rim of the Guinea Dome. The dynamic topography (in dyn m) of the 100 dbar surface referred to 300 dbar showed inshore areas dominated by an anticyclonic circulation in contrast with the exterior cyclonic region (Figure 9D). The geostrophic current, albeit meandering and sluggish, was invariably poleward, which was consistent with the poleward recirculation of NECC waters. Hence, the less saline and oxygen-rich waters of the NECC circulate poleward between the Guinea Dome and the continental slope, where they encounter the saltier and less ventilated SACW inshore. As a result, at about 400 m depth, the T–S maximum associated with the confluence of the two SACW varieties was spatially distributed along the continental slope. This gives additional evidence of the subsurface poleward recirculation of NECC waters in the interior branch of the Guinea Dome, while converging with the more saline but less ventilated resident SACW type. This penetration of the NECC is one of the few ventilation mechanisms in the otherwise oxygen-depleted TENA waters.
Ichthyoplankton study
A total of 1716 fish eggs and 19,415 larvae were caught during the survey, corresponding to an average abundance of 247.8 eggs·100 m−3 and 2699.3 larvae·100 m−3. On the whole, the spatial distributions of eggs and larvae were similar (Figure 10). Major egg and larval abundances were found in the southern inner shelf, where waters are colder and more productive, and in the shallowest stations of the northern area, where a thermal front separates warm offshore waters from the colder inshore upwelled waters.
GUINEA BISSAU 0810 survey. Spatial distribution of the abundance (in numbers/100 m3) of fish (A1 ml l−1) eggs and (B) larvae. Contour shades depict the horizontal distribution of temperature (°C) at 5 m depth.
Fish eggs distribution extended beyond the shallow coastal stations (up to 200 m). For the eggs, the preferential ranges of sea surface temperature (SST) and sea surface salinity (SSS) were 27.5–29°C and 32.8–33.6, respectively. For fish larvae, the depth and salinity preference ranges were similar to those of fish eggs, although the SST range was narrower than those shown by eggs, with a maximum temperature of around 28°C.
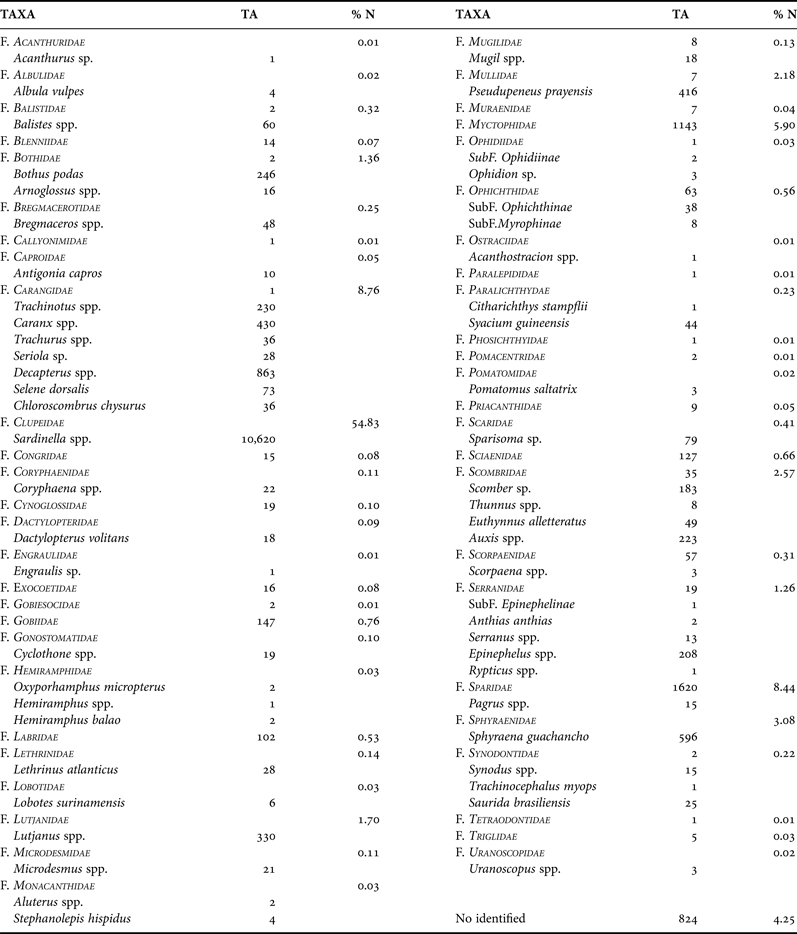
Of the total larvae collected, up to 95.8% were identified at least to family level. A total of 85 taxa, grouped in 49 families, were collected (Table 1). Specimens belonging to the family Clupeidae were the most abundant, accounting for more than half of the larvae (54.8%), followed by Carangidae (8.8%), Sparidae (8.4%) and Myctophidae (5.9%). Other families, such as Sphyraenidae, Scombridae, Mullidae, Lutjanidae, Bothidae and Serranidae, were caught in percentages ranging from 3 to 1% of the total larval fish catches, approximately (Table 1). The other families accounted for less than 1% of the total larval catches (Table 1).
List of the larval fish taxa (alphabetical order), their abundance in number (TA) and the relative abundance (% N) of the larval fish families collected during the ‘Guinea Bissau 0810’ cruise.
FAMILY CLUPEIDAE
Clupeoid larvae attributed to the genus Sardinella, and identified as S. aurita, were inferred from the adult fish catches, in which this species accounted for almost the entire estimated population, although S. maderensis can be found in this area.
Consequently, Sardinella larvae were the most abundant and frequent, appearing in 54.5% of the stations. Nevertheless, most of these larvae (81%) were collected at only five stations at less than 50 m depth (Figure 11A). The highest abundances were recorded at station I-28, with 441.8 larvae·100 m−3. This station was located on the inner shelf, in an area of chlorophyll-rich waters.
Spatial distribution of the total abundance (in larvae/100 m3): (A) Fam. Clupeidae: Sardinella sp; (B) Fam. Carangidae: total taxa; (C) Caranx sp; (D) Decapterus sp.; (E) Trachinotus sp.; (F) Fam. Sparidae. Contour shades depict the horizontal distribution of temperature (°C) at 5 m depth.
FAMILY CARANGIDAE
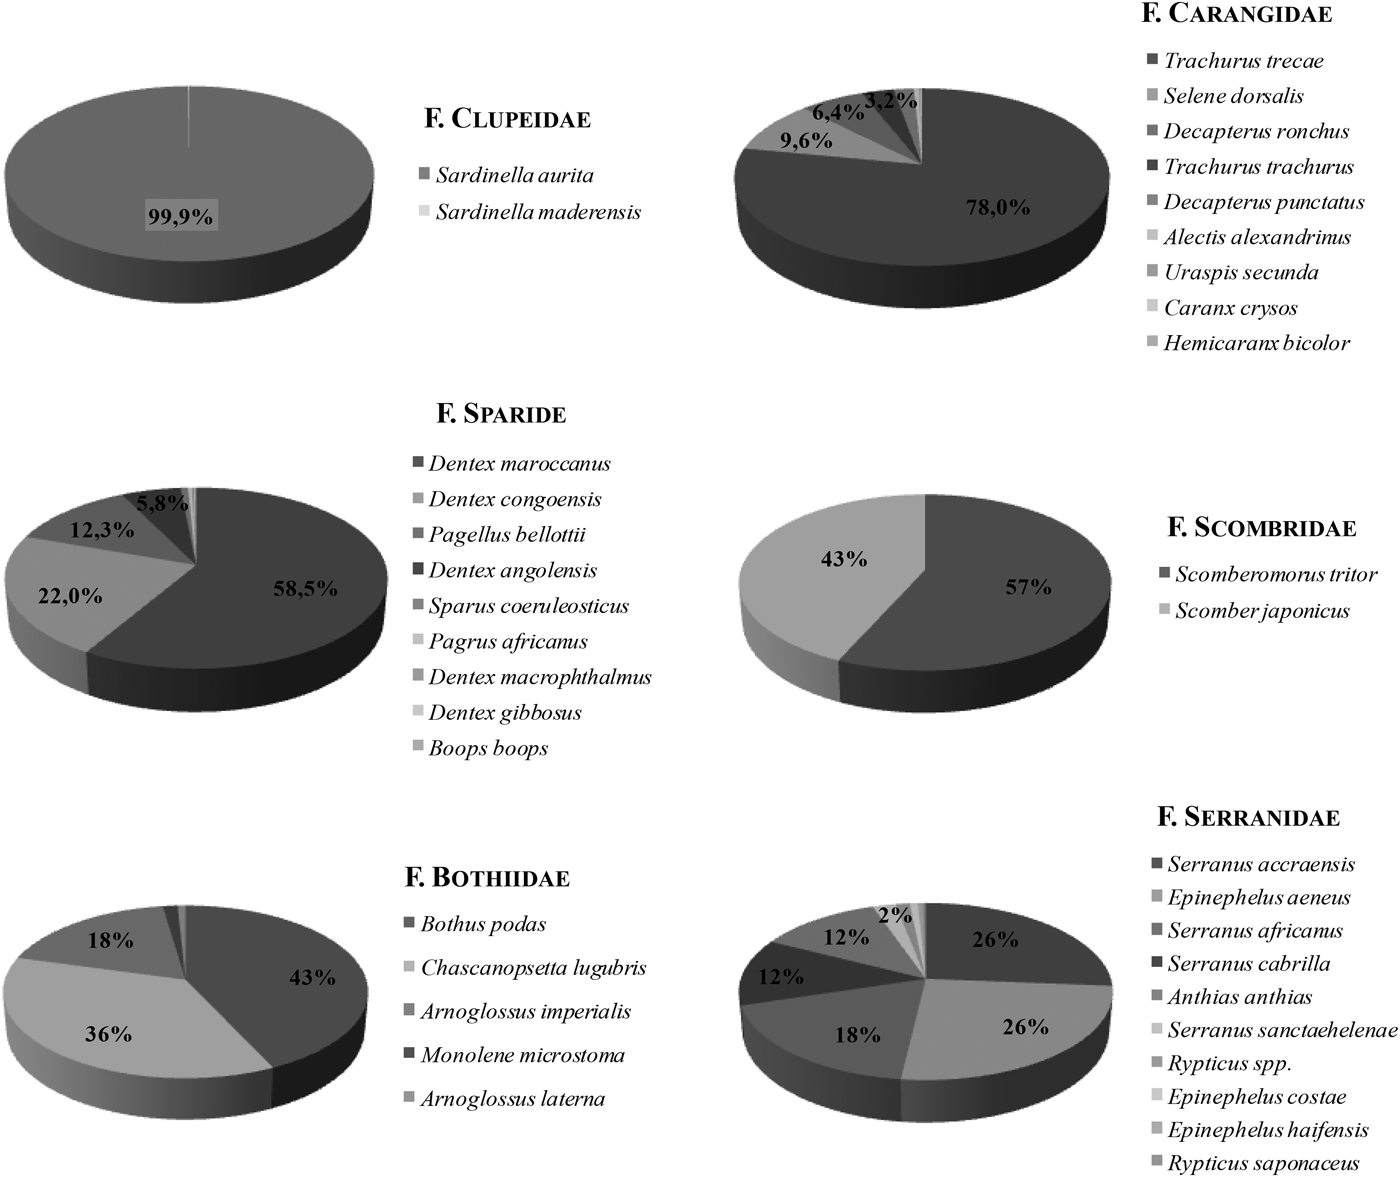
Larvae belonging to the family Carangidae represented 8.8% of the total larval catches (Table 1), equivalent to a total abundance of 274.5 larvae·100 m−3. The most abundant genera identified were: Decapterus, Caranx and Trachinotus. Caranx crysos Mitchill, 1815 and Decapterus (Caranx) rhonchus Geoffroy Saint-Hilaire, 1817 were the only species of this genus in the adult catches. Thus, some larval specimens might correspond to Caranx spp. Other larvae of the genus Trachurus spp., Seriola sp. and Selene dorsalis Gill, 1863 may also form part of the larval samples. Larvae identified as Trachurus spp. may correspond to Trachurus trecae Cadenat, 1950 and/or Trachurus trachurus Linnaeus, 1758, two species caught in the adult stage. However, the first species showed the highest abundance (78% of the total biomass of Carangidae in the survey; Figure 14). Carangid larvae were widely distributed in the study area, except in the most offshore waters (Figure 11B–E).
The greatest abundance was found in the southern zone, where at a single station with 102.3 larvae·100 m−3, of which 93.5% were Decapterus spp. larvae. This station was located in the cooler part of southern waters, where temperatures were two degrees below the maximum temperature recorded in the area surveyed. Larvae of Trachinotus sp. were more abundant in the northern part of the sampled area.
FAMILY SPARIDAE
Sparid larvae accounted for a total of 237.0 larvae·100 m−3 (1690 specimens) and for 8.4% of the total larval fish caught (Table 1). Larval identification below the family level is an arduous task because of the high diversity of species in this family, together with the great morphometric similarities between these species.
Many of the unidentified sea bream (Pagrus spp.) larvae could be ascribed to several of the identified species collected in the fishing trawls: Dentex maroccanus Valenciennes, 1830, (the most abundant, registering more than 9000 t), Dentex congoensis Poll, 1954 and Pagellus bellottii bellottii Steindachner, 1882 (also very abundant, amounting to 3500 and 2000 t, respectively), Dentex angolensis Poll & Maul, 1953 (more than 900 t), Sparus coeruleostictus Valenciennes, 1830 (115 t), Dentex macrophthalmus Bloch, 1791 (38 t). Dentex gibbosus Rafinesque, 1810 and Boops boops Linnaeus, 1758, showed the lowest abundance among the Sparids. The larvae of Pagrus spp. may correspond to Pagrus africanus Akazaki, 1962, the only species of this genus present in the fish catches (Figure 14).
Sparid larvae were widespread in the study area, reaching depths up to 1100 m (Figure 11F). Maximum abundance (76.7 larvae·100 m−3) was observed at station I-26, located at 236 m depth and 10 78′N 17 27′W, with temperatures of 27.9°C and higher chl-a levels than those of the surrounding waters. The area is characterized by the existence of a thermal front between colder inshore and warmer offshore waters, as indicated above.
FAMILY MYCTOPHIDAE
Myctophid larvae belonged to different species, which were not identified. This group represented 5.9% of the larval fish collected (Table 1). Since most species of this family are meso- or bathypelagic, most larvae (168 larvae·100 m−3; 1143 in number) were collected at nine oceanic stations located beyond 500 m isobath. Station I-32, the north-westernmost station and located at 800 m depth, achieved by far the highest concentration of myctophid larvae (90.3%; Figure 12A). The SST registered at this station was 28°C. In general, myctophids were located offshore and in warmer waters.
Spatial distribution of the total abundance (in larvae/100 m3): (A) Fam. Myctophidae; (B) Fam. Sphyraenidae: Sphyraena guachancho; (C) Fam. Scombridae: total taxa; (D) Scomber sp; (E) Euthynnus alletteratus; (F) Auxis sp. Contour shades depict the horizontal distribution of temperature (°C) at 5 m depth.
FAMILY SPHYRAENIDAE
Sphyraenidae larvae accounted for 3.1% of the larval catch (Table 1). The Guachanche barracuda, Sphyraena guachancho, was the only species of this family present in the ichthyoplankton samples. A total of 596 larvae of S. guachancho (87.3 larvae·100 m−3) were collected. The species was widely distributed, although the highest abundances occurred in the southern zone of the study area, where the shelf is wider. Stations with greater abundances were located at depths between 60 and 200 m, in waters from 27.5 to 29°C (Figure 12B).
FAMILY SCOMBRIDAE
Total density of scombrid larvae was 68.9 larvae·100 m−3 (498 in number), and this family represented 2.6% of the total larval fish collected (Table 1). Genus Auxis sp. was the most abundant (51.4% of the Scombrids), followed by Scomber spp. (30.5%). Scomber colias was the only Scomber species caught in the fishing trawls (Figure 14). Euthynnus alletteratus and Thunnus spp. (10.3 and 1.2% of the Scombrids, respectively) were also present in the samples.
The overall distribution of scombrid larvae in the study area was scattered between 16 stations (Figure 12C–F), although beyond 500 m depth, they were practically absent. The greatest concentrations of scombrid larvae were located in the thermal front, between colder coastal waters and warmer offshore waters, at temperatures of 27.4–29.3°C and low chl-a values. The station with the highest larval concentration of scombrids was located at 11 N 17°W, at 50 m depth. However, the horizontal distribution was different for the different taxa. For example, larvae belonging to the genus Scomber were concentrated at the two shallowest stations (30 and 47 m depth), in the middle part of the area in front of the Bissagos Islands where temperatures around 28°C were recorded (Figure 12D). Euthynnus alletteratus larvae appeared throughout the area surveyed, from 30 to 70 m depth (except two larvae collected at 200 m; Figure 12E). Larvae of Auxis sp. were distributed throughout the area surveyed, but the highest abundances were registered in the south part, between 70 and 200 m, in waters at 29°C (Figure 12F).
FAMILY MULLIDAE
A total of 423 larvae (65 larvae·100 m−3) belonging to this family were identified as Pseudupeneus prayensis (98.8%). These larvae represented only 2.2% of the total larval density (Table 1), but were relatively ubiquitous (presence index of 66%). Stations where the highest abundances of this species were recorded (19.5 and 12.4 larvae·100 m−3) were located in very different areas, both at around 28°C. One of the stations was located in the northern part of the survey area, near (11.8 N) at 800 m depth (Figure 13A). The second station was located in the southern part (10.5°N), at around 200 m depth.
Spatial distribution of the total abundance (in larvae/100 m3): (A) Fam. Mullidae; (B) Fam. Lutjanidae: Lutjanus spp.; (C) Fam. Bothidae; (D) Fam. Serranidae; (E) Epinephelus sp. Contour shades depict the horizontal distribution of temperature (°C) at 5 m depth.
FAMILY LUTJANIDAE
Larvae of this family accounted for 1.7% of the total larvae caught. All these larvae were identified as Lutjanus sp., since the absence of adult specimens and taxonomic descriptions of lutjanid larvae in the area hindered identification to a lower taxonomic level.
Lutjanidae larvae were present in 45% of the sampled stations, always at depths up to 500 m, and mostly over the southern study area, where the shelf is wider (Figure 13B). The maximum abundance (25.8 larvae·100 m−3) was registered at station I-18, at 70 m depth and 28.9°C.
FAMILY BOTHIDAE
A total of 264 larvae (37 larvae·100 m−3) of the family Bothidae were caught in the ichthyoplankton samples, showing a high presence index of 75.5%. Practically all (93.2%) were identified as Bothus podas (Table 1). Other larvae belonging to the genus Arnoglossus could be attributed either to Arnoglossus imperialis Rafinesque, 1810 or to Arnoglossus laterna Walbaum, 1792, both species appeared in the fishing trawls (Figure 14) where A. imperialis showed the highest abundance.
These larvae were distributed over the entire study area (Figure 13C), 88.9% of them caught at stations at depths greater than 90 m. Three northern stations showed higher concentrations of B. podas larvae. The first station was located at 1126 m depth (7.5 larvae·100 m−3) and the others between approximately 540 and 100 m depth, with temperatures higher than 28.5°C.
Guinea-Bissau 0810 survey. Relative importance (%) of the different species by family in adult catches (A–F).
FAMILY SERRANIDAE
Larvae belonging to the family Serranidae represented 1.3% (244 specimens) of the total larval fish catch. Different genera of this family were identified. The genus Epinephelus accounted for 85% of the total serranid larvae. The presence of three species of this genus in the adult catches (Epinephelus aeneus Geoffroy Saint-Hilaire, 1817, Epinephelus costae Steindachner, 1878 and Epinephelus haifensis Ben-Tuvia, 1953) (Figure 14) made it impossible to assign Epinephelus larvae to one single species, although E. aeneus was the most abundant in trawls.
Similarly, larvae identified as genus Serranus could correspond to one or several species found in the adult population, in the following order of abundance: Serranus accraensis Norman, 1931, Serranus africanus Cadenat, 1960, Serranus cabrilla Linnaeus, 1758 and Serranus sanctaehelenae Boulenger, 1895.
The larval distribution of the Serranids was clearly associated with the colder and highly productive pocket of upwelled waters. These larvae (like Epinephelus sp.) were mostly concentrated in the south-east part of the study area, at depths shallower than 215 m (Figure 13E). The sea surface temperature registered in these stations was lower than 28.4°C.
DISCUSSION
The study area lies under the direct influence of the NECC that circulates cyclonically together with the nNECC around the Guinea Dome (9°N–10.5°N 22–25°W (Figure 1). The geostrophic field of the current was rather sluggish at 100 m, probably as a result of the choice of 300 dbar as the reference level, but undoubtedly suggests the presence of the inner nNECC branch on the outer rim of the Guinean shelf.
The subsurface thermohaline fields illustrated that this flow was responsible for the advection of colder and relatively fresher and oxygen-richer waters in the study area (Figure 8). Low oxygen zones are commonly observed in the SACW, as well as in the AAIW layers below the TSW south of the CVFZ. The CVFZ acts as a barrier between the well-ventilated NACW found in the subtropical gyre and the oxygen-depleted shadow south-east zone (Zenk et al., Reference Zenk, Klein and Schroder1991). Stramma et al. (Reference Stramma, Hüttl and Schafstall2005) showed that the oxygen supply to this ‘shadow zone’ is accomplished mainly by current bands transporting southern water masses and that a subthermocline relative oxygen maximum is consistent with the transport of oxygen-rich water in the North Equatorial Under Current (nNEUC), observed from 4 N to 11°N towards the Guinea Dome region. Thermohaline observations supported the upper-layer equatorward transport and underlying poleward flow. This strong baroclinicity is a consequence of the dynamic confluence of the Guinea Dome circulation with the locally generated wind-driven circulation.
This general picture is seasonally modulated by large-scale, seasonal displacements of the Guinea Dome (Stramma & Schott, 1999) and on a shorter-scale by synoptic variability of local wind stress and freshwater runoff near the Bissagos Islands. Observations presented in this paper were acquired at the beginning of the 2008 upwelling season and under pulsating upwelling-favourable winds (Figure 2). Ekman pumping velocities were observed in excess of 0.7 m day−1 west of the Guinean coast off the 20 m-isobath and along a meandering N–S band running 18°W, south of 11°N, and coinciding with the peak winds on 3 November (Figure 2). The result was a proliferation of an offshore rich chl-a structure in the realm of TSW, which was marginally sampled by stations located in the SW corner of the observational grid. Due to the local stratification within TSW, local upwelling associated with this structure exhibited no clear near-surface temperature signature. In contrast, the elongated chl-a maximum observed between the 20–200 m-isobaths off the Bissagos Islands was spatially coincident with a colder (<28°C) water pocket that was sampled by the easternmost CTD stations. In this sense, Figure 7 illustrates how the southeast rim of the cruise area was occupied by relatively cold and less saline (<34) waters. A well-defined thermal front between these and the offshore TSW was seen, along which flowed a surface-trapped equatorward jet with geostrophic velocities greater than 0.5 m s−1 (Figure 7D). Although the sampling scheme did not allow the eastern boundary of this cyclonic strip to be closed, regions situated below 50 m appeared to be highly influenced by the buoyancy input resulting from the continental runoff, as inferred by the salinity values (<32) observed on the inner shelf. Indeed, the satellite SST image (Figure 3) indicated that the inshore region was, in all likelihood, occupied by waters of important continental origin. As suggested by the steric contribution of stations 19 and 22 over bottoms shallower than 50 m, the inshore region was anticyclonic. Therefore, it is proposed that this buoyancy front was able to give continuity to a circular flow defining a retention area that featured a relatively cold (<28°C) cyclone, with a high chl-a concentration (>2 mg m−3) (Figure 7).
Mesoscale hydrographic features may act as mechanisms for enrichment, concentration and retention, thereby contributing to increased biological production and larval survival (Bakun, Reference Bakun1996). These biological-physical linkages are frequently observed in the shelf break region, where a boundary between the coastal and oceanic water occurs (Okazaki & Nakata, Reference Okazaki and Nakata2007). Both high pigment concentration and retentive dynamics were a likely factor that contributed to the greater abundance of fish eggs and larvae in the upwelled area and along the TSW/upwelling front (Figure 9). That was particularly true for eggs and for larvae of the most abundant taxa (S. aurita and carangids), although the pattern was mimicked by most families studied. Larvae of Myctophids and bothids were preferentially found within the TSW zone. This distribution is mainly related to the oceanic behaviour of adults, which inhabit and reproduce in waters beyond 200 m depth (Rodríguez et al., Reference Rodríguez, Hernández-León and Barton1999). The mullid P. prayensis and the scombrid S. colias exhibited an alternative behaviour with greater abundances recorded along the thermal front. Larvae from other families, such as Sparidae, Lutjanidae and Serranidae occurred both in the upwelled, colder coastal area and in the thermal front. The fact that these families probably include several species, with different possible habitats and behavioural patterns, could explain why no clear larval distribution pattern was found.
Although larval distribution may be a result of convergent spawning strategies, it is equally plausible that diverse strategies could result in the same distribution because certain areas or periods favour survival (Shackell & Frank, Reference Shackell and Frank2000). Larvae that coincide with high food abundance and/or occur in retention areas have a greater probability of survival.
Spatial attention should be focused on the round sardinella S. aurita, a target species for the artisanal fishery and the most abundant species in the larval catches. It is known that it spawns throughout the year in north-west African waters (Bécognée et al., Reference Bécognée, Almeida, Barrera, Hernández-Guerra and Hernández-León2006; Moyano et al., Reference Moyano, Rodríguez and Hernández-León2009), although with higher activity, from June to September, in Mauritanian and Senegalese waters (Boeley et al., Reference Boely, Chabanne, Fréon and Stéquert1982). However, reproduction is restricted to the summer months off the Moroccan coast and in the Gulf of Cádiz (Ettahiri et al., Reference Ettahiri, Berraho, Vidy, Ramdani and Do Chi2003; Junta de Andalucia, Reference Junta de2008). A thermal window of S. aurita spawning from 18 to 21°C was established off the north-west African coast (Ettahiri et al., Reference Ettahiri, Berraho, Vidy, Ramdani and Do Chi2003).
The high number of taxa (85 taxas grouped in 49 families) recorded suggests a great diversity of fish larvae. Both diversity and abundance were higher than those reported in previous studies carried out in this area (Lopes & Afonso, Reference Lopes and Afonso1995), although those differences may be attributed to different types of ichthyoplankton nets used.
Despite this high ichthyoplankton diversity, there is a lack of taxonomic identification keys. For this reason, the combined information coming from the trawl and ichthyoplankton sampling has added value. Moreover, this study contributes to the knowledge of certain species that were not recorded in the demersal trawl catches, due to different factors. This might be the case of some pelagic species not captured in demersal samplings, such as Bregmaceros nectabanus, Coryphaena hippurus, Pomatomus saltatrix, Trachinotus spp., Chloroscombrus chrysurus or some specimens of Exocoetidae.
Other adults live in certain habitats where fishing regulations restricted the use of fishing gears, either because of the shallowness of the bottoms (Oxyporhamphus micropterus, Hemiramphus balao and Lethrinus atlanticus) or their sensitive nature, such as shallow coastal reefs or sea grass beds (Sparisoma rubripinne; Acanthurus sp., probably Acanthurus monroviae), river mouths and lagoons, muddy estuaries and tide pools (Mugilidae); some adults often burrowed in sand and mud (Microdesmidae) or even floated on their side near the surface in the company of floating objects and occasionally drifted over reefs (Lobotes surinamensis) (Desoutter, Reference Desoutter, Quero, Hureau, Karrer, Post and Saldanha1990; Schneider, Reference Schneider1990; Tortonese, Reference Tortonese, Quero, Hureau, Karrer, Post and Saldanha1990; Nelson, Reference Nelson1994). The larval study therefore contributes considerably to increase the knowledge of the diversity of fish species in the area.
Within this complex, rich and diverse ecosystem, ichthyoplankton studies are crucial to set the groundwork for defining essential habitats focused on the conservation of Guinea-Bissauan fish resources, as well as the conservation of fish diversity in the region.
ACKNOWLEDGEMENTS
QSCAT/NCEP Blended Ocean Winds from Colorado Research Associates (version 5.0) were provided by the RDA, which is maintained by the CISL at the NCAR. NCAR is sponsored by the NSF. The original data are available from the RDA (http://dss.ucar.edu) in dataset number ds744.4. We greatly appreciate the assistance of all the participants in the survey, as well as the crew of the R/V Vizconde de Eza. Special thanks are extended to Carlos Hernández González for his great contribution to the taxonomical identification of fish adults and to Francisco Fernández Corregidor for his field assistance in the ichthyoplankton and CTD samplings.
FINANCIAL SUPPORT
The survey ‘GUINEA-BISSAU 0810’ was funded by the Secretaría General de Pesca Marítima (SGPM) of the Ministerio de Medio Ambiente, Rural y Marino (MMARM) and was carried out by the Instituto Español de Oceanografía (IEO), in close cooperation with the Centro de Investigaçao Pesqueira Aplicada (CIPA) of Guinea-Bissau.