I. INTRODUCTION
To date, the key challenges in photovoltaics (PV) are to discover appropriate low-cost and earth-abundant materials and to develop cost-effective processing for large-scale utilization. The kesterite compound Cu2ZnSn(S,Se) (CZTSSe) has emerged as a promising alternative to CdTe and Cu(In,Ga)Se2 (CIGS). One of the advantages of CZTSSe is a tunable band gap in the range of 1.0–1.5 eV depending on the S/Se ratio.Reference Siebentritt and Schorr1,Reference Walsh, Chen, Wei and Gong2 The CZTSSe solar cell has experienced a substantial improvement in photovoltaic performance since the late 1990s,Reference Friedlmeier, Wieser, Walter, Dittrich, Schock, Ossenbrink, Helm and Ehmann3–Reference Katagiri, Saitoh, Washio, Shinohara, Kurumadani and Miyajima5 achieving a certified record efficiency of 12.6% by Wang et al. in 2013.Reference Wang, Winkler, Gunawan, Gokmen, Todorov, Zhu and Mitzi6 However, to meet the commercial demands, the technology needs to close the performance gap to other well-developed thin film solar cell technologies such as CdTe, CIGS, and perovskite, all of which have exceeded the efficiencies to over 20%.Reference Solar7–Reference Yang, Noh, Jeon, Kim, Ryu, Seo and Seok9
It is well known that the main performance loss in CZTSSe solar cells is the open-circuit voltage (V oc) deficit (V oc deficit = E g/q − V oc, where E g is a band gap and q is the elemental charge). CZTSSe with a band gap of 1.1 eV offers a Shockley–Queisser (SQ) efficiency up to 32.2% with a V oc of around 842 mVReference Shockley and Queisser10,Reference Rühle11 ; however, the record CZTSSe solar cell has achieved only 60.9% of the V oc predicted by the SQ limit.Reference Wang, Winkler, Gunawan, Gokmen, Todorov, Zhu and Mitzi6 The origin of the V oc deficit is the nonradiative recombination of photogenerated charge carriers. Shockley–Read–Hall (SRH) type defects are the most efficient nonradiative recombination centers. In the trap-assisted SRH recombination, electrons in transition between bands pass through a new transitional energy state (localized state) created within the band gap (deep-level traps) by an impurity in the lattice.Reference Shockley and Read12,Reference Hall13 However, a microscopic understanding of the nonradiative recombination mechanisms in CZTSSe is still in question.
A recent review on the V oc deficit of CZTSSe solar cells revealed that a large V oc deficit is due to both bulk (low carrier concentrations, high defect concentrations, and secondary phases) and interface (high recombination) issues.Reference Kim and Shin14 Given that the state-of-the-art CZTSSe solar cells have been achieved at off-stoichiometric (Cu-poor and Zn-rich) conditions,Reference Wang, Winkler, Gunawan, Gokmen, Todorov, Zhu and Mitzi6,Reference Yan, Sun, Huang, Johnston, Liu, Veettil, Sun, Pu, Zhou, Stride, Green and Hao15,Reference Lee, Gershon, Gunawan, Todorov, Gokmen, Virgus and Guha16 the secondary phases and pervasive Cu–Zn disordering lead to band tailingReference Gokmen, Gunawan, Todorov and Mitzi17 and limit the V oc. Chen et al. reviewed theoretical studies on defect formation and ionization in kesterites.Reference Chen, Gong, Walsh and Wei18–Reference Xu, Chen, Huang, Xiang, Gong and Wei20 They provided theoretical reasonings that can explain the composition-dependent performance of CZTSSe devices: application of Cu-poor and Zn-rich conditions leads to a higher performance and a high S composition (i.e., higher band gap) limits the efficiency. Mitzi et al. reviewed the progress of CZTSSe technology with a special focus on solution-based devices.Reference Mitzi, Gunawan, Todorov, Wang and Guha21 They provided a detailed discussion of the challenges and advantages of the solution-processing approach in comparison to vacuum deposition.
Further advances in CZTSSe solar cells require precise knowledge of the distribution of secondary phases and point defect formation. Therefore, examination of secondary phases and point defects in CZTSSe at a nanoscale or even an atomic level will enable further modification and optimization of the synthesis parameters. In this regard, experimental identification of secondary phases as well as defects at an atomic scale are of significant importance to gaining insights on the intrinsic nature of CZTSSe and may ultimately overcome the current challenges regarding the V oc deficit.
This review presents a brief update of the current experimental approaches on the identification of secondary phases and point defects at the sub-micrometer scale in CZTSSe. We also review a new photovoltaic compound Cu2BaSn(S,Se)4 (CBTSSe), which offers a remarkable potential as an alternative to CZTSSe.
II. HIGH VOLTAGE DEFICIT IN CZTSSE SOLAR CELLS
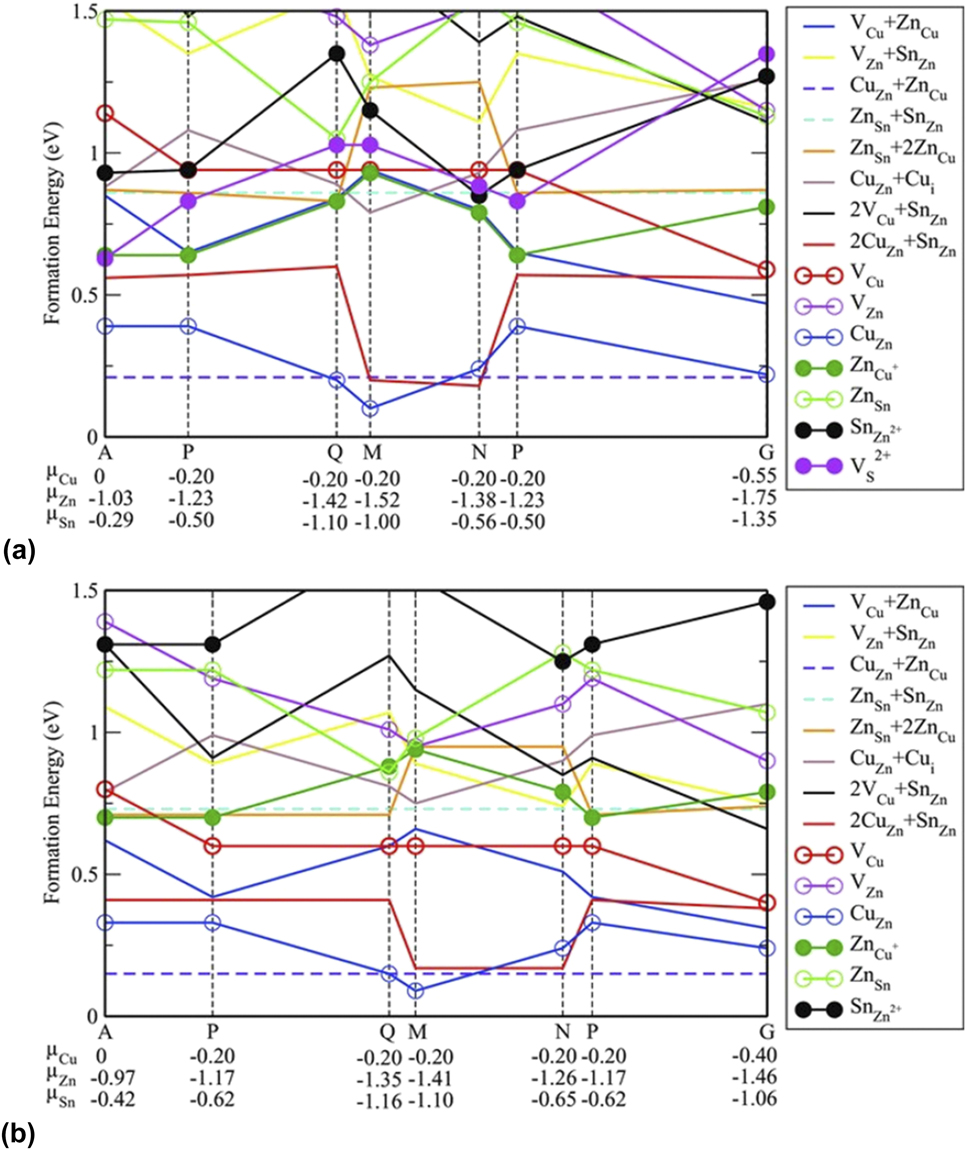
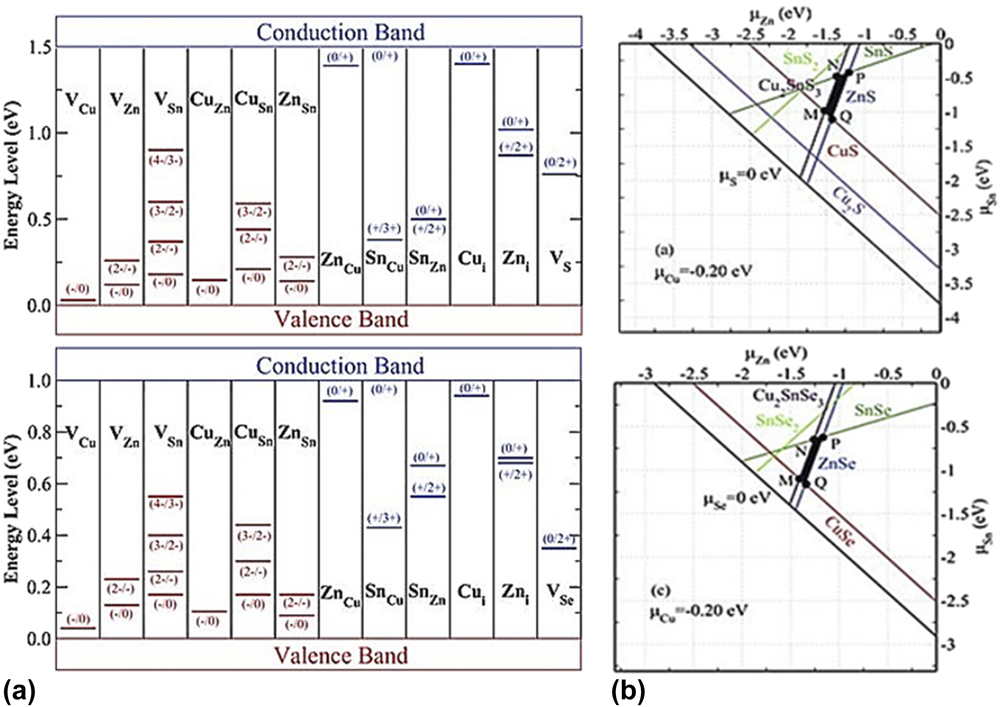
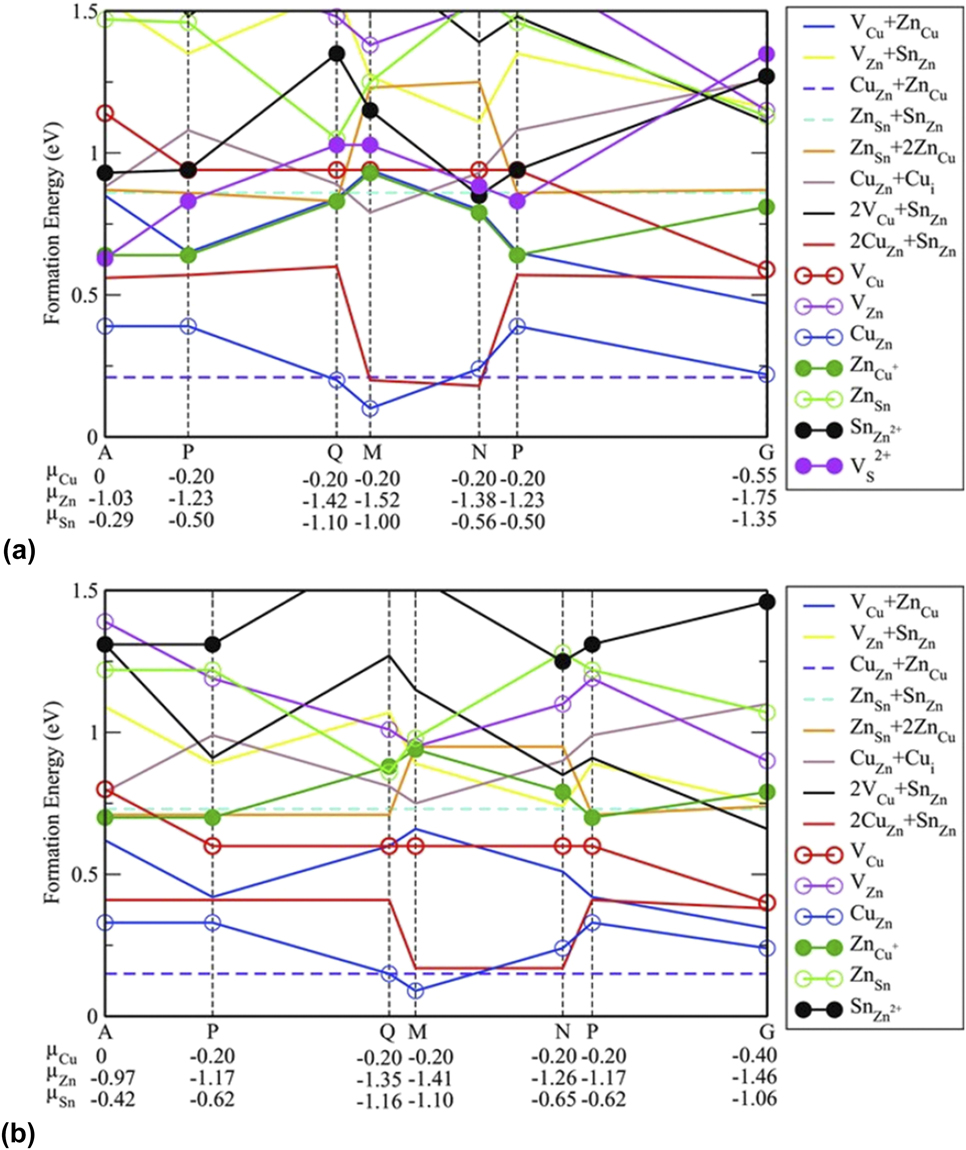
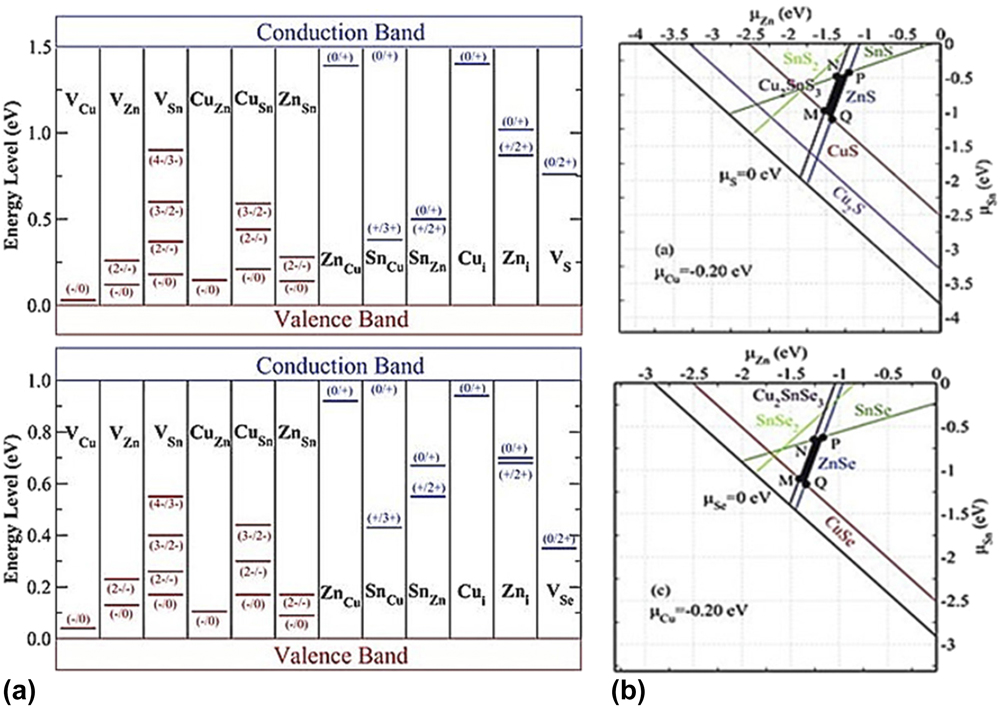
Due to the chemical similarity between Cu and Zn, Cu–Zn disordering can occur easily. First-principle calculation by Chen et al.Reference Chen, Gong, Walsh and Wei18–Reference Xu, Chen, Huang, Xiang, Gong and Wei20 revealed that VCu and CuZn are dominant acceptor-like defects with small formation energies, which account for the p-type conductivity under Cu-poor conditions as shown in Fig. 1. Note, the formation of VCu is more likely due to its shallower energy level compared to CuZn [Fig. 2(a)]. Chen et al. also reported the existence of defect pairs in CZTS grown under Cu-poor and Zn-rich conditions. Defect clusters such as  $\left[ {{\rm{Cu}}_{{\rm{Zn}}}^ - + {\rm{Zn}}_{{\rm{Cu}}}^ + } \right]$ and
 $\left[ {{\rm{V}}_{{\rm{Cu}}}^ - + {\rm{Zn}}_{{\rm{Cu}}}^ + } \right]$ are easily formed due to the small formation energies of 0.2 eV and 0.4 eV, respectively.
The formation energy of low-energy defects in Cu2ZnSnS4 (a) and Cu2ZnSnSe4 (b) as a function of the chemical potential.Reference Chen, Walsh, Gong and Wei19 Reproduced with permission from Ref. Reference Chen, Walsh, Gong and Wei19.
(a) The ionization levels of intrinsic defects in the band gaps of Cu2ZnSnS4 (top) and Cu2ZnSnSe4 (bottom). The red bars show the acceptor levels and the blue bars show the donor levels.Reference Chen, Walsh, Gong and Wei19 (b) The calculated stable chemical potential region (black area) of Cu2ZnSnS4 (top) and Cu2ZnSnSe4 (bottom).Reference Chen, Walsh, Gong and Wei19 Reproduced with permission from Ref. Reference Chen, Walsh, Gong and Wei19.
Recently, using density functional theory (DFT) calculations, Kim et al.Reference Kim, Park and Walsh22 found the existence of thermodynamic charge transition levels of Vs(e), SnCu(2a), SnCu(2b), SnZn, and CuSn. The reduction of Sn4+ to Sn2+ creates an electrically benign state of Vs(e), with a chance to involve nonradiative carrier recombination assisted by an optically excited state under a different sulfur or selenium sub-stoichiometry. Moreover, Kim et al. suggested SnZn as the origin of electron trapping/detrapping in CZTS while the effect is less prevalent in CZTSe.
Choubrac et al.Reference Choubrac, Lafond, Guillot-Deudon, Moëlo and Jobic23 and Lafond et al.Reference Lafond, Choubrac, Guillot‐Deudon, Deniard and Jobic24 identified the relative dominance of different point defects and related clusters according to the degree of the deviation from the stoichiometry in CZTSSe. They revealed that in Cu-poor and Zn-rich CZTSSe, the formation of ZnCu and VCu (A-type) and the formation of ZnCu and ZnSn (B-type) are likely, whereas in Cu-rich and Zn-poor conditions, the formation of CuZn and SnZn (C-type) and the formation of CuZn and Cui (D-type) are likely. Considering that high efficiencies have been achieved at Cu-poor and Zn-rich conditions, A-type or B-type reactions are a prevailing mechanism in CZTSSe. It should be noted that off-stoichiometry leads to the formation of numerous secondary phases such as Cu2Sn(S,Se)3, Zn(S,Se), Sn(S,Se), and Cux(S,Se) because the thermodynamically stable region of CZTSSe is very narrow as can be seen in Fig. 2(b).Reference Chen, Walsh, Gong and Wei19,Reference Siebentritt25,Reference Du, Yan, Young, To, Jiang, Dippo, Kuciauskas, Chi, Lund, Hancock, OO, Scarpulla and Teeter26
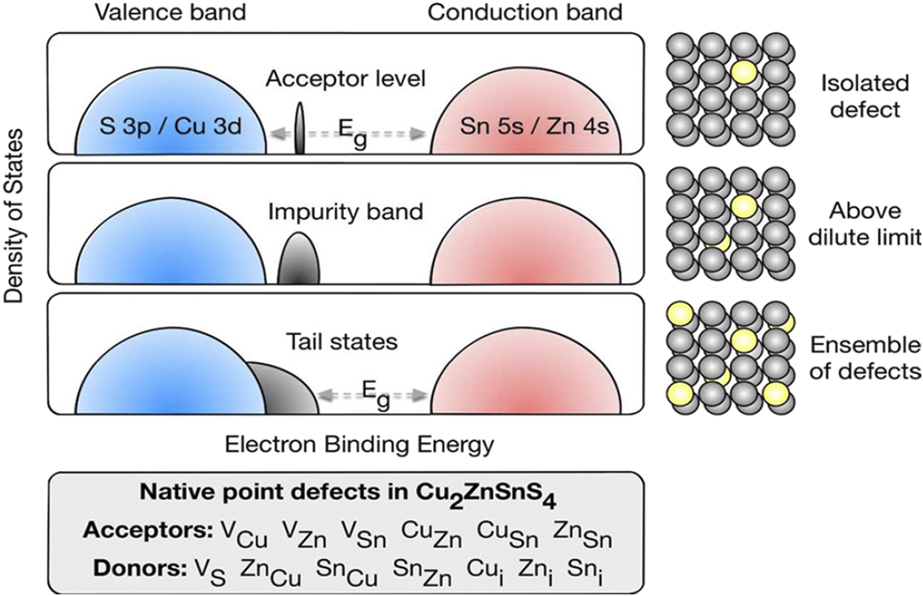
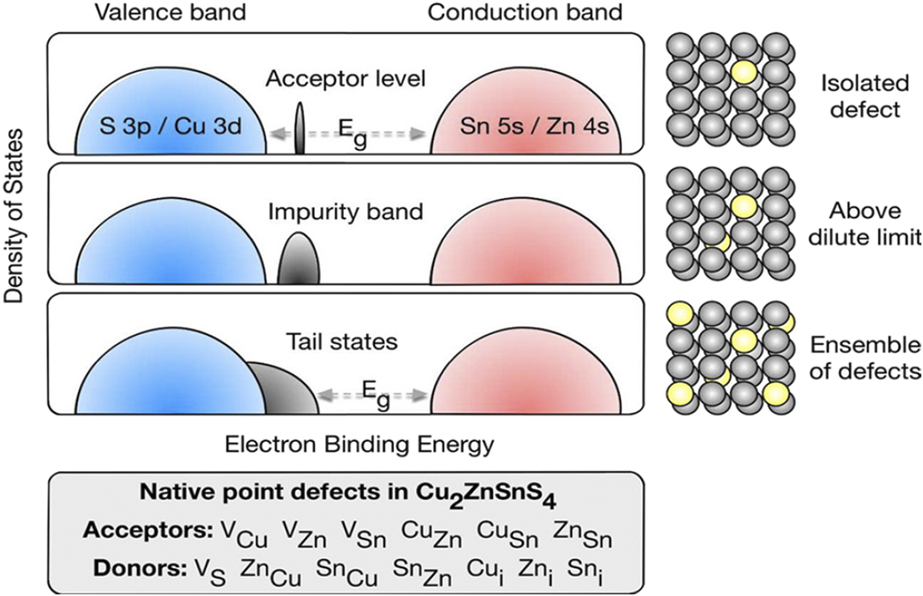
Wallace et al.Reference Wallace, Mitzi and Walsh27 outlined the research challenges of the kesterite solar cells. They considered point defects, in particular, Cu–Zn antisites, as the primary factor that limits the device performance. As shown in Fig. 3, Cu–Zn antisites result in the formation of localized states or associated tail states, which cause a severe band tailing.Reference Gokmen, Gunawan, Todorov and Mitzi17,Reference Wallace, Mitzi and Walsh27 However, a recent study by Bourdais et al.Reference Bourdais, Choné, Delatouche, Jacob, Larramona, Moisan, Lafond, Donatini, Rey, Siebentritt, Walsh and Dennler28 provided a different view on the influence of the cationic Cu–Zn disorder on the V oc deficit. They found that improving the cation ordering of CZTSSe absorbers by slow cooling after selenization increased the V oc by merely 40 mV but with a concomitant increase in the band gap by a similar amount (∼50 meV), which led the authors to conclude that Cu–Zn disorder did not have a direct impact on the V oc deficit.
Acceptor defect-induced energy level within the band gap of a semiconductor (top) and a list of intrinsic defects in Cu2ZnSnS4 (bottom).Reference Wallace, Mitzi and Walsh27 Reprinted (adapted) with permission from Ref. Reference Wallace, Mitzi and Walsh27. Copyright (2018) American Chemical Society.
A. Cation disordering in CZTSSe solar cells
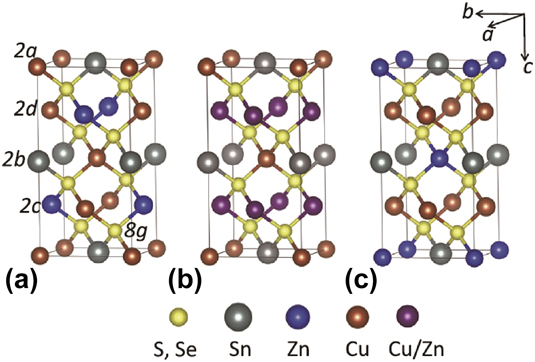
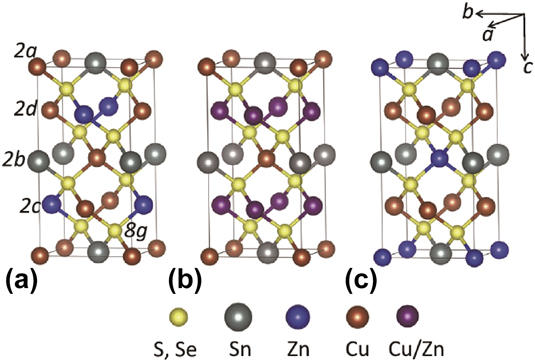
Experimental evidence on the facile formation of Cu–Zn antisites was provided by Schorr et al.Reference Schorr, Hoebler and Tovar29 using neutron powder diffraction because conventional X-ray diffraction cannot distinguish cations with similar atomic factors. They observed a kesterite structure of CZTS with Zn and Cu occupying the z = 1/4 and z = 3/4 in a disordered manner, leading to the formation of CuZn and ZnCu antisites. Similar observations have been reported by Washio et al.,Reference Washio, Nozaki, Fukano, Motohiro, Jimbo and Katagiri30 Lafond et al.,Reference Lafond, Choubrac, Guillot-Deudon, Fertey, Evain and Jobic31 and Stone et al.Reference Stone, Christensen, Harvey, Teeter, Repins and Toney32 using the resonant X-ray diffraction technique, which measures diffraction intensity as a function of X-ray energy across an absorption edge. Since each element has different resonant energies and the scattering power of the resonant atom changes near the absorption edge, the resonant X-ray diffraction technique can effectively distinguish elements with similar atomic numbers (e.g., Cu and Zn).Reference Stone, Christensen, Harvey, Teeter, Repins and Toney32 Washio et al. prepared CZTS thin films with different compositions and observed the Cu substitution for Zn at the 2d site and Zn substitution for Cu at the 2c site at a photovoltaic compositional ratio (Cu/(Zn + Sn) = 0.8) using synchrotron radiation X-ray diffraction.Reference Washio, Nozaki, Fukano, Motohiro, Jimbo and Katagiri30 Stone et al. further validated the existence of high concentrations of CuZn and ZnCu antisites on the 2c and 2d positions as well (Fig. 4).Reference Stone, Christensen, Harvey, Teeter, Repins and Toney32
Structure for kesterite (a), disordered kesterite (b), and stannite (c). Reproduced with permission from Ref. Reference Lafond, Choubrac, Guillot-Deudon, Fertey, Evain and Jobic31.
To probe the cationic disorder in CZTSSe, spectroscopic studies, such as photoluminescence (PL)Reference Gokmen, Gunawan, Todorov and Mitzi17,Reference Gershon, Shin, Bojarczuk, Gokmen, Lu and Guha33,Reference Grossberg, Krustok, Raadik, Kauk-Kuusik and Raudoja34 and nuclear magnetic resonance (NMR),Reference Choubrac, Paris, Lafond, Guillot-Deudon, Rocquefelte and Jobic35,Reference Paris, Larramona, Bais, Bourdais, Lafond, Choné, Guillot-Deudon, Delatouche, Moisan and Dennler36 were also carried out. The results showed a rather broader width of the spectroscopic peak as evidence of the Cu–Zn disorder. Using 119Sn MAS NMR spectroscopy, Paris et al.Reference Paris, Larramona, Bais, Bourdais, Lafond, Choné, Guillot-Deudon, Delatouche, Moisan and Dennler36 demonstrated that A-type [VCu + ZnCu] defect complexes exist under Cu-poor and Zn-rich conditions, which is consistent with the previous theoretical studies.Reference Choubrac, Lafond, Guillot-Deudon, Moëlo and Jobic23,Reference Lafond, Choubrac, Guillot‐Deudon, Deniard and Jobic24 Such a high population of Cu–Zn antisites is expected to cause electrostatic potential fluctuation, leading to band tailing as reported by Gokmen et al.Reference Gokmen, Gunawan, Todorov and Mitzi17 At a low temperature, charge carriers become localized in a potential well due to insufficient thermal energy. Therefore, separation of carriers localized in the well makes the recombination rather difficult and results in a longer lifetime compared to that of CIGS. Moreover, high concentrations of defects give rise to a broader PL width, indicating that the recombination is facilitated by the tail states.Reference Gokmen, Gunawan, Todorov and Mitzi17,Reference Gershon, Shin, Bojarczuk, Gokmen, Lu and Guha33
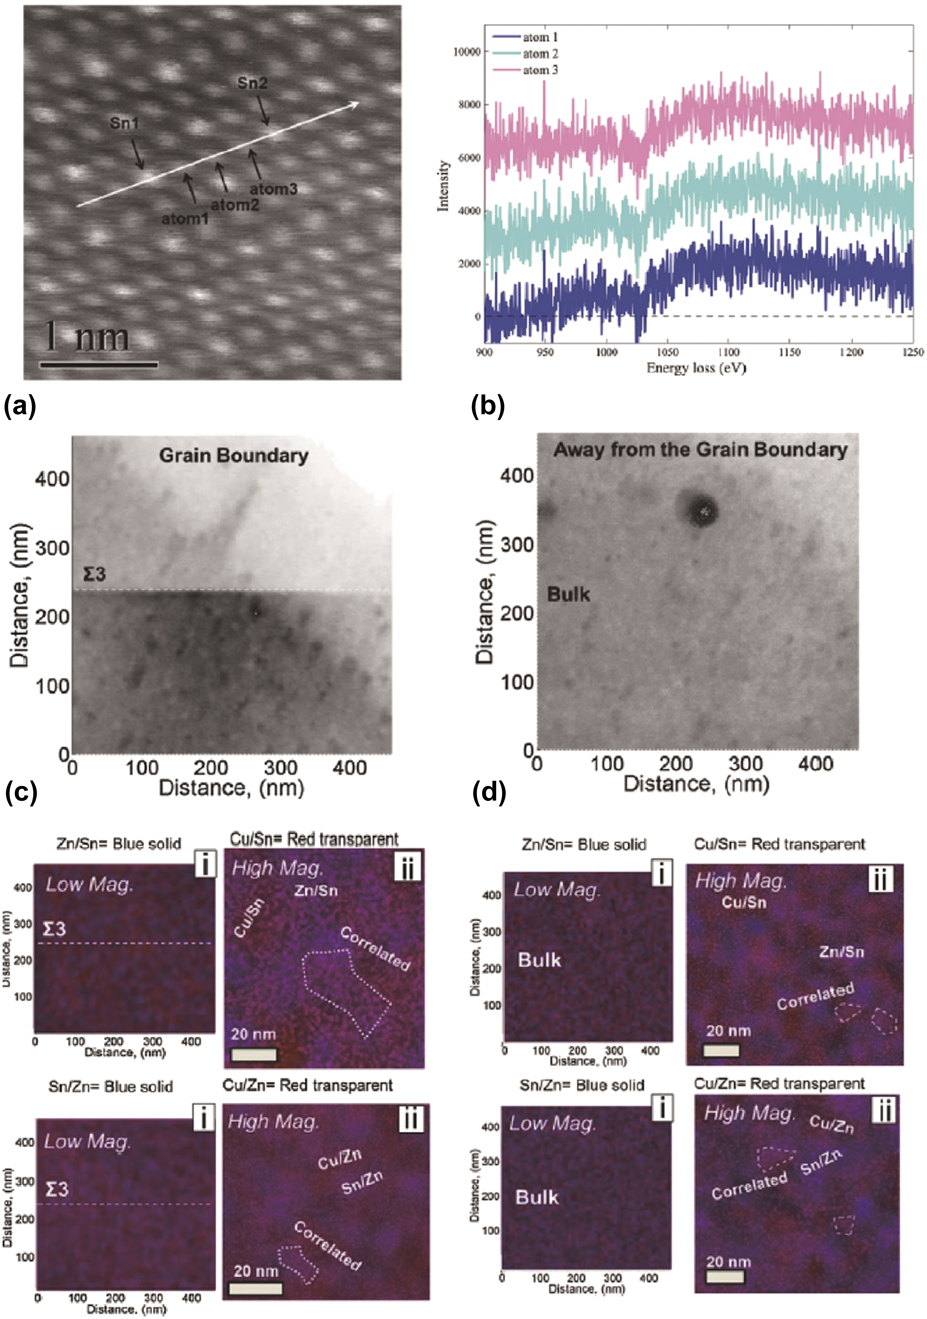
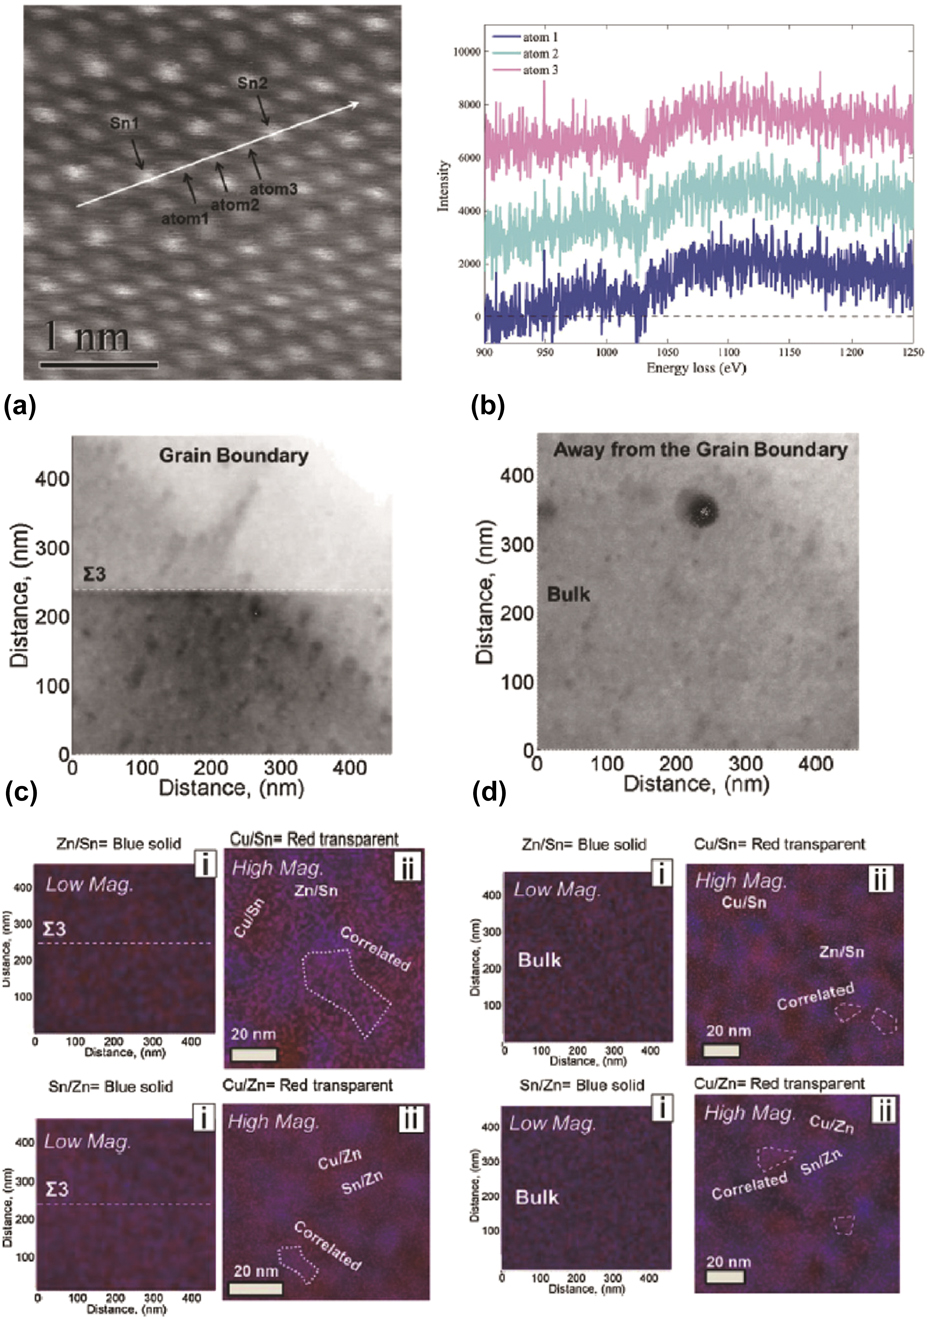
However, the abovementioned spectroscopic and structural studies on the Cu–Zn disorder area lacking in spatial resolution and therefore give information from a rather large volume of interests. To understand point defects and related defect clusters at the atomic scale, researchers have performed scanning transmission electron microscopy (STEM) studies. Mendis et al.Reference Mendis, Shannon, Goodman, Major, Claridge, Halliday and Durose37 used an aberration corrected STEM along with electron energy loss spectroscopy (EELS) to analyze three Cu/Zn atom columns between Sn atoms along the [001] c-axis. As shown in Figs. 5(a) and 5(b), atom columns were clearly rich in Zn (∼1020 eV) but poor in Cu (∼930 eV), indicating the presence of a high density of ZnCu antisite atoms. When scanning a region over a 10 × 10 nm2 area, a strong Cu L-edge was visible in the EELS spectra with a Cu/Zn ratio of 0.4 [Fig. 5(b)]. Consequently, ZnCu antisites were observed with the nanoscale composition inhomogeneity of a lateral size between 1.5 and 5 nm. Aguiar et al.Reference Aguiar, Erkan, Pruzan, Nagaoka, Yoshino, Moutinho, Al‐Jassim and Scarpulla38 also used STEM to probe the partial Cu–Zn disorder and the resulting cation ratio fluctuations within CZTSSe. As can be seen in Figs. 5(c) and 5(d), STEM-based energy dispersive X-ray spectroscopy (EDS) revealed mixed colors of red and blue at some points (white dashed lines) while distinct color separation was observed in the other maps of different cation ratios ([Zn/Sn & Cu/Sn] and [Cu/Zn & Cu/Sn]). The results suggested the existence of partially disordered regions at the nanometer scale (∼20 nm) where Cu influences the presence of Zn and Sn. Using atomic-resolution TEM, Kattan et al.Reference Kattan, Griffiths, Cherns and Fermin39 and Mendis et al.Reference Mendis, McKenna, Gurieva, Rumsey and Schorr40 reported the antisite domain boundaries (ADBs) in pure sulfide and pure selenide, respectively. These boundaries are typically 5–20 nm apart and have displacements of 1/2[110] or 1/4[201] depending on the cationic substitution. In other words, there are ZnCu and CuZn antisite defects on the 2c and 2d sites in the bottom half for 1/2[110] (001) ADBs, whereas SnCu antisite defects are present on the 2c site in the top half for 1/4[201] (101) ADBs.Reference Kattan, Griffiths, Cherns and Fermin39
(a) STEM high angle annular dark field image of [010]-oriented Cu2ZnSnS4.Reference Mendis, Shannon, Goodman, Major, Claridge, Halliday and Durose37 (b) EELS spectra for atom 1, atom 2, and atom 3.Reference Mendis, Shannon, Goodman, Major, Claridge, Halliday and Durose37 (c) STEM-based EDS image at a grain boundary of Cu2ZnSnS4.Reference Aguiar, Erkan, Pruzan, Nagaoka, Yoshino, Moutinho, Al‐Jassim and Scarpulla38 (d) STEM-based EDS image far away from a grain boundary of Cu2ZnSnS4.Reference Aguiar, Erkan, Pruzan, Nagaoka, Yoshino, Moutinho, Al‐Jassim and Scarpulla38 Reproduced with permission from Refs. Reference Mendis, Shannon, Goodman, Major, Claridge, Halliday and Durose37 and Reference Aguiar, Erkan, Pruzan, Nagaoka, Yoshino, Moutinho, Al‐Jassim and Scarpulla38.
B. Secondary phases in CZTSSe solar cells
A theoretical study by Chen et al.Reference Chen, Gong, Walsh and Wei18–Reference Xu, Chen, Huang, Xiang, Gong and Wei20 revealed that the stable range of chemical potentials of CZTSSe against secondary phases [Fig. 2(b)] is very narrow. Such a limit in the phase inhomogeneity originates from the easy formation of Zn(S,Se) or Cu2Sn(S,Se)3 because the chemical potential of Zn also lies in a narrow region.Reference Chen, Walsh, Gong and Wei19 Moreover, considering that the CZTSSe solar cells with high efficiencies have been fabricated in nonstoichiometry conditions, the formation of secondary phases is inevitable. The existence of secondary phases is known to be detrimental to device performance since they may enhance the recombination due to their inappropriate band gap and electrical properties. Secondary phases with a band gap smaller than that of the kesterite (Cu2SnS3, Cu2S, and SnS in a pure sulfide and Cu2SnSe3 in a pure selenide) can limit the V oc, whereas those with a larger band gap can hinder the charge transport.Reference Siebentritt25,Reference Kumar, Dubey, Adhikari, Venkatesan and Qiao41 Therefore, it is desirable to analyze the component uniformity and to detect the secondary phases in CZTSSe at the atomic level. However, detection of the secondary phases at the nanoscale level and their characterization require advanced techniques because they are structurally complex and seemingly similar to the CZTSSe matrix.
In this regard, the combination of atom probe tomography (APT) with ab initio DFT calculations is an effective strategy to study compositional inhomogeneity at the nanoscale. The largest strengths of APT as an analytical technique are three-dimensional compositional imaging in the nanoscale analysis of buried features and high analytical sensitivity. APT simultaneously achieves a resolution finer than 0.3 nm in all three directions of a three-dimensional image.Reference Kelly and Miller42 Schwarz et al.Reference Schwarz, Marques, Botti, Mousel, Redinger, Siebentritt, Cojocaru-Mirédin, Raabe and Choi43–Reference Schwarz, Cojocaru-Mirédin, Mousel, Redinger, Raabe and Choi45 extensively studied the secondary phases in CZTSSe using the laser-assisted APT analysis. They examined CZTSe samples before and after annealing. Three-dimensional elemental mapping revealed Cu enrichment and Sn depletion at grain boundaries before annealing. The annealing resulted in a strong enrichment of grain boundaries with Zn (nanometer sized ZnSe formation up to 30 at.%), strong Cu and Sn depletion, and slight Se depletion. Moreover, a substantial amount of Na (∼0.4 at.%) was segregated at the majority of grain boundaries as well as at some parts of the ZnSe/CZTSe interfaces, which was accompanied by co-segregation of K (∼0.15 at.%).Reference Schwarz, Cojocaru-Mirédin, Choi, Mousel, Redinger, Siebentritt and Raabe44 It is known that the valence band maximum (VBM) of CZTSe is determined by the Se–Cu p–d hybridization.Reference Jaffe and Zunger46,Reference Chen, Gong, Walsh and Wei47 Cu-enriched grain boundaries induce an upward shift of the VBM, which consequently increases the recombination. The Zn-enriched grain boundaries with Cu depletion, however, induce a downward VBM shift, which can act as a hole barrier and is beneficial for solar cell performance.Reference Persson and Zunger48,Reference Gloeckler, Sites and Metzger49
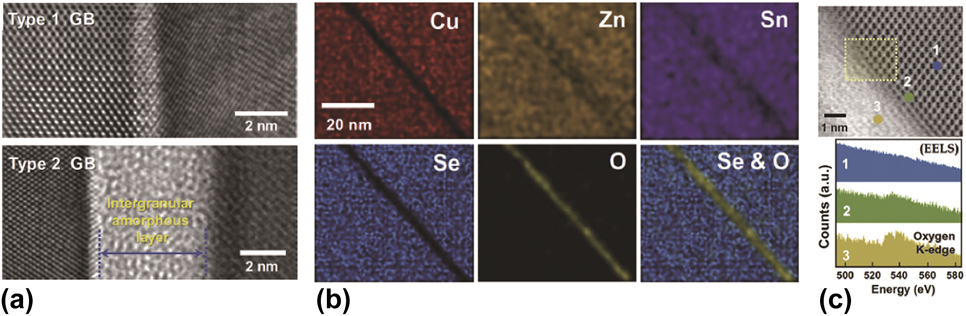
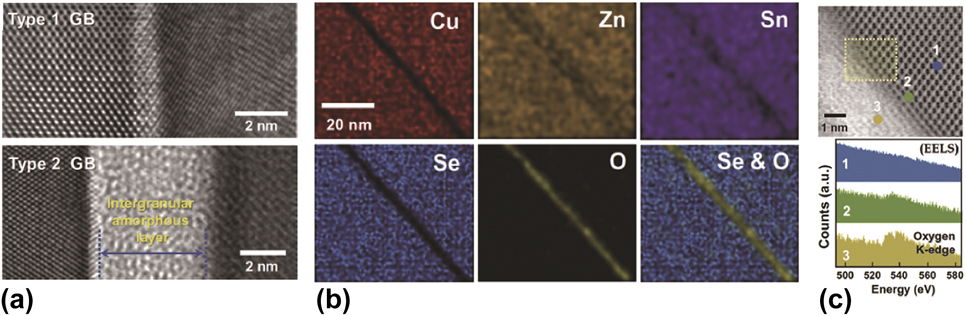
The beneficial role of the downward VBM shift at the grain boundaries was also reported by Kim et al.Reference Kim, Choi, Choi, Gershon, Lee, Wang, Shin and Chung50 Using STEM, EDX, and EELS, they studied the electronic structure of internal interfaces in CZTSe. In CZTSSe solar cells, air annealing has been shown to enhance V oc.Reference Kim, Choi, Choi, Gershon, Lee, Wang, Shin and Chung50,Reference Sardashti, Haight, Gokmen, Wang, Chang, Mitzi and Kummel51 The study by Kim et al. aimed to investigate the mechanism behind the improvement of the device performance with air annealing. They demonstrated the appearance of nanoscale layers with a thickness of a few nanometers along the grain boundaries after air annealing, where the Se sites are substituted by oxygen as shown in Figs. 6(a) and 6(b). The EELS measurement further confirmed the existence of oxygen in the lattice: The oxygen K-edges were clearly seen at the interface [Fig. 6(c)]. From the DFT calculations, they were able to clarify the effect of oxygen on the electronic band structure of CZTSe. Oxygen substitution leads to a downward shift of VBM by 0.49 eV compared with that of CZTSe and hinders the hole transport to the grain boundaries. Thus, a large energy barrier to the hole transport formed due to the oxidation and efficiently inhibited the charge carrier recombination at the grain boundaries.
(a) High resolution electron microscopic images with two different types of grain boundaries, (b) high-angle annular dark-field STEM images and EDX maps at grain boundaries, and (c) annular bright-field STEM image (top) and EELS spectra (bottom) in CZTSe after air annealing. Reproduced with permission from Ref. Reference Kim, Choi, Choi, Gershon, Lee, Wang, Shin and Chung50.
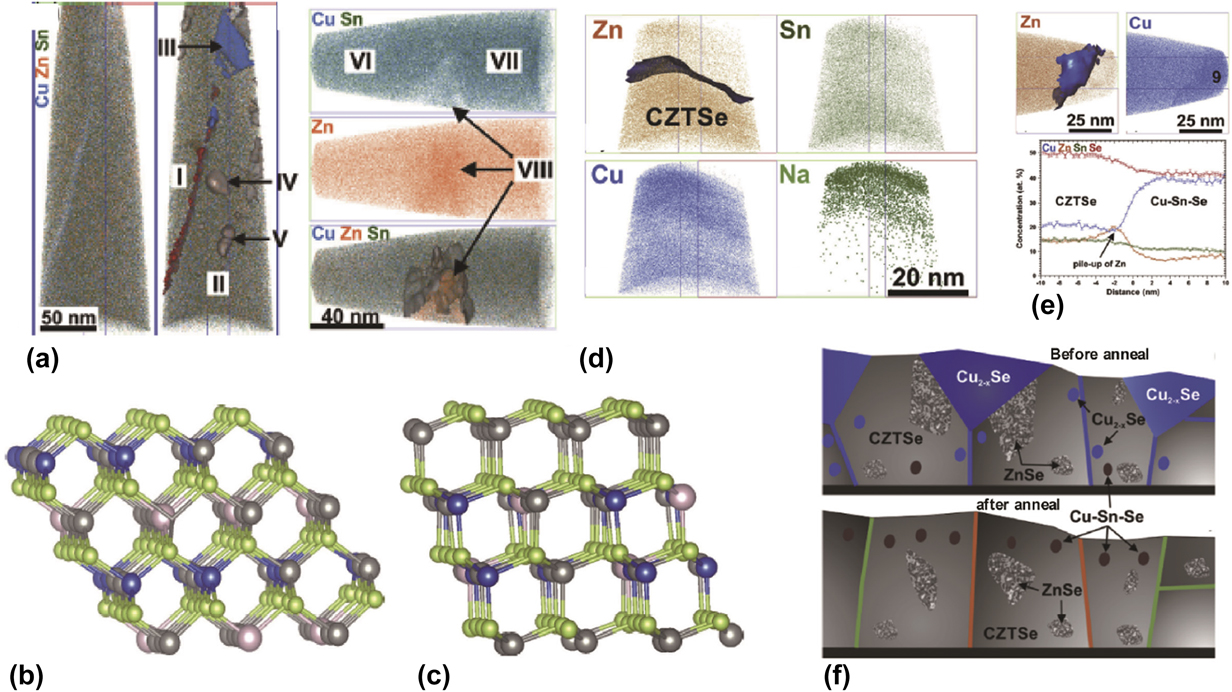
Furthermore, Schwarz et al. reported the formation of Cu2Zn5SnSe8 and Cu2Zn6SnSe9 phases in CZTSe.Reference Schwarz, Marques, Botti, Mousel, Redinger, Siebentritt, Cojocaru-Mirédin, Raabe and Choi43 The APT study was performed on two CZTSe samples with different compositional ratios: one grown under Cu-rich conditions and another under Cu-poor conditions. Three-dimensional elemental maps of Cu, Zn, and Sn are shown in Fig. 7(a) for two different regions (>200 nm below the surface and >500 nm above the Mo back contact) for Cu-rich CZTSe. They observed Cu2Zn5SnSe8 and Cu2Zn6SnSe9 phases as well as Cu2−xSe and ZnSe precipitates in Cu-rich CZTSe samples, whereas only ZnSe and Cu2Zn5SnSe8 phases were detected in Cu-poor CZTSe samples [Fig. 7(a)]. However, neither Cu2Zn5SnSe8 nor Cu2Zn6SnSe9 was detected using XRD, indicating that the two phases have structures similar to CZTSe and ZnSe or the volumes of fractions are very small in CZTSe. Based on DFT calculations, the authors suggested that a possible disorder among the cations (the presence of three different cations on the Zn sites) distorts the original symmetry and the resultant metastable phases can co-exist in the CZTSe [Figs. 7(b) and 7(c)]. DFT calculation further yielded the positive energy difference with respect to the decomposition into Cu2ZnSnSe4 and ZnSe.Reference Schwarz and GmbH52
(a) Three-dimensional elemental maps of Cu (blue), Zn (orange), and Sn (green). Structure of (b) the Cu2Zn5SnSe8 and (c) Cu2Zn6SnSe9 phase calculated by DFT: Cu (blue), Zn (grey), Sn (rose), and Se (green).Reference Schwarz, Marques, Botti, Mousel, Redinger, Siebentritt, Cojocaru-Mirédin, Raabe and Choi43 (d) and (e) APT elemental maps of Zn (orange), Cu (blue), Sn (dark green), and Na (green) acquired from Cu2ZnSnSe4 precursor.Reference Schwarz, Cojocaru-Mirédin, Mousel, Redinger, Raabe and Choi45 (f) Schematic drawing of the Cu2ZnSnSe4 precursor before (top) and after (bottom) annealing.Reference Schwarz, Cojocaru-Mirédin, Mousel, Redinger, Raabe and Choi45 Reproduced with permission from Refs. Reference Schwarz, Marques, Botti, Mousel, Redinger, Siebentritt, Cojocaru-Mirédin, Raabe and Choi43 and Reference Schwarz, Cojocaru-Mirédin, Mousel, Redinger, Raabe and Choi45.
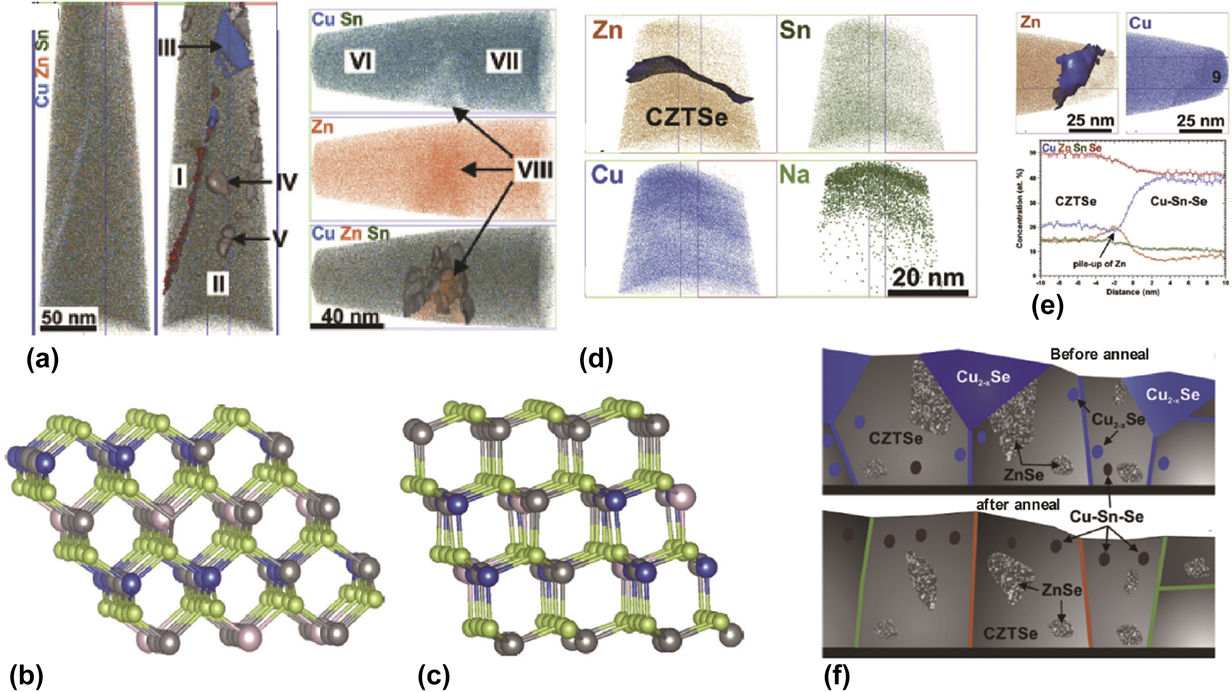
Moreover, using APT and STEM-EDX, Schwarz et al. carried out an advanced study on the direct detection and quantification of nanosized Cu–Sn–Se compounds and provided further verification of the existence of ZnSe randomly distributed throughout CZTSe as shown in Figs. 7(d) and 7(e).Reference Schwarz, Cojocaru-Mirédin, Mousel, Redinger, Raabe and Choi45 In the same work, they also confirmed the existence of the Cu2−xSe phase as wedge-shaped grains at the surface of CZTSe using STEM-EDX. Consequently, they proposed a growth model of CZTSe, especially under Cu-rich conditions [see Fig. 7(f)]. In this model, excess Cu leads to the formation of Cu2−xSe at the surface of the Cu-rich precursor while the Zn excess yields a nanoscale ZnSe network across the entire film of CZTSe before annealing. However, annealing leads to the disappearance of the Cu2−xSe and nanoscale distribution of the Cu–Sn–Se phase at 200 nm below the surface with the ZnSe network still present in the CZTSe. The locations of these compounds in the space charge region enhance the recombination and limits the device performance. Another performance loss that is related to the V oc deficit is a narrow band gap of Cu–Sn–Se compounds (Cu2SnSe3) in a range of 0.4–0.8 eV.Reference Takeshi, Tsuyoshi, Kouji, Masaru and Takahiro53,Reference Rau and Werner54 Thus, they concluded that the existence of these detrimental secondary phases close to the CZTSe/CdS interface results in a nonideal heterojunction.Reference Schwarz, Cojocaru-Mirédin, Mousel, Redinger, Raabe and Choi45
III. BEYOND ZINC-BLENDE-BASED CZTSSe
A. Design of novel earth-abundant photovoltaic material with an ordered lattice: Cu2–II2+–Sn–(S,Se)4 chalcogenide (II = earth-alkali element)
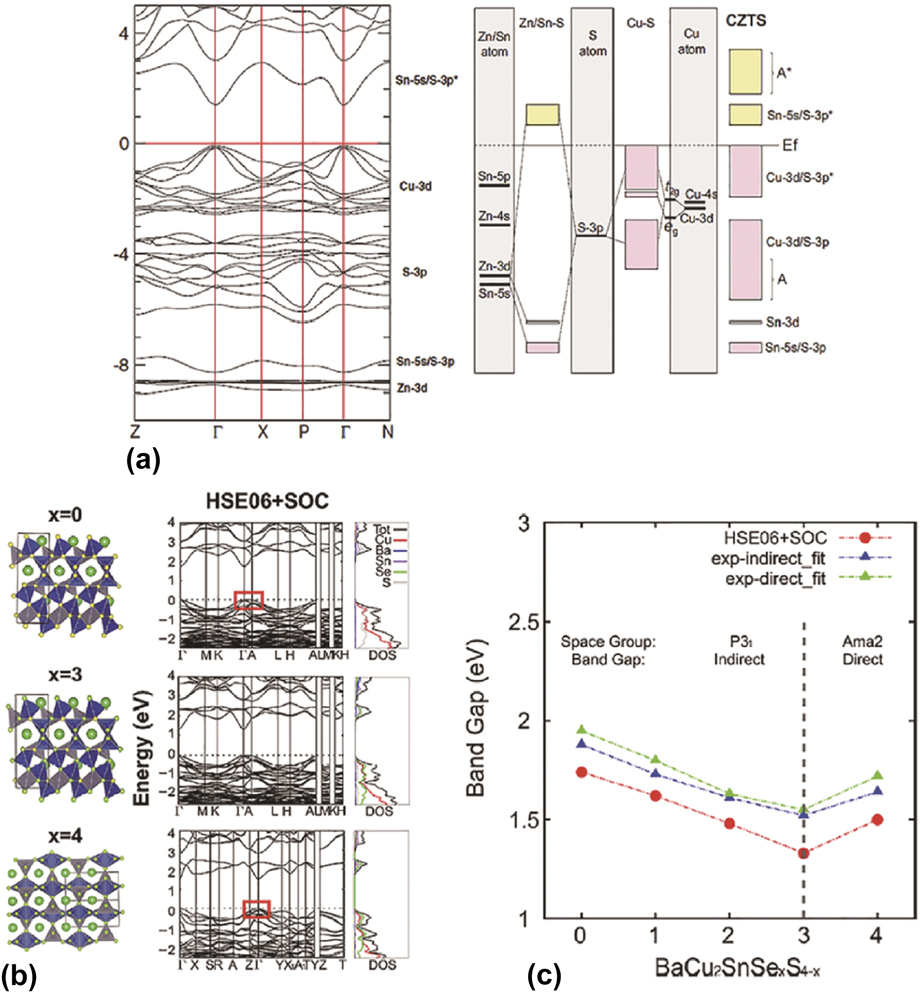
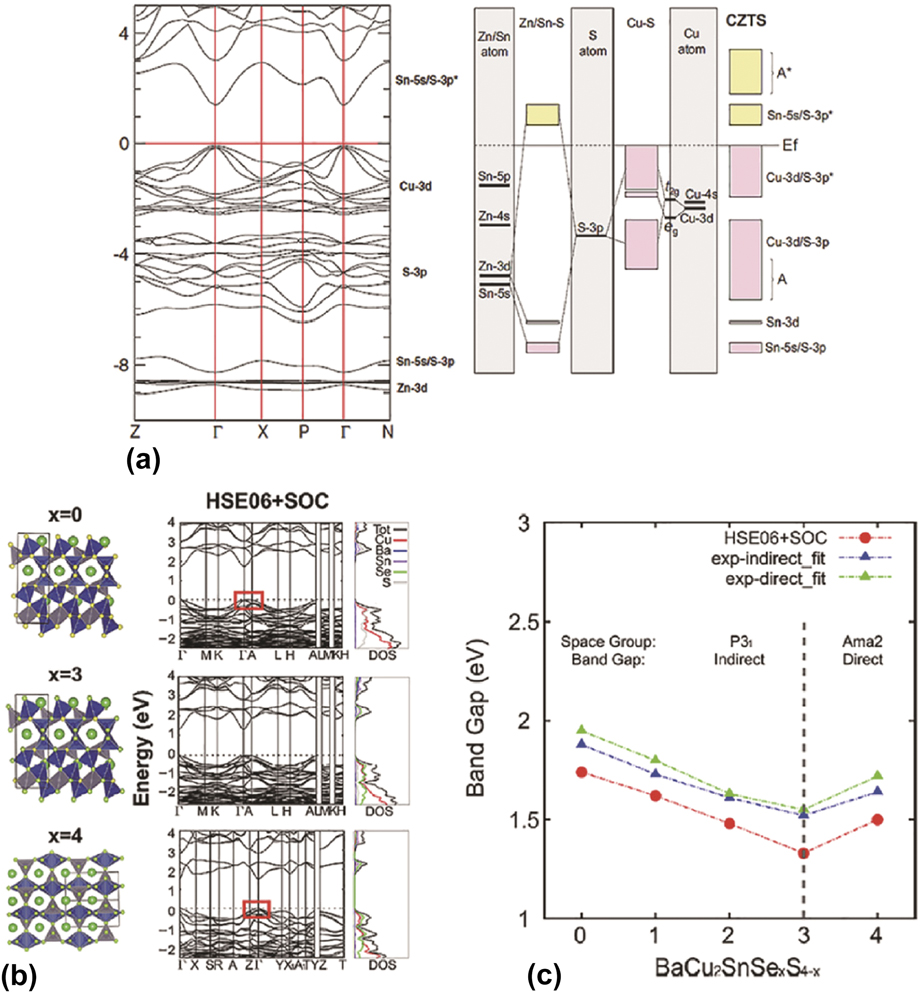
Given that the main driving force of Cu–Zn antisite formation is the similarity of the atomic radii and chemical valences of Cu and Zn ions, researchers reasoned that the introduction of an ionic mismatch around the constituents would be an effective way to suppress the formation of cation antisite defects in the CZTSSe lattice. Following this line of thought, researchers have substituted various cations with ionic radii different from Cu or Zn: for example, Ag (1.14 Å)Reference Shannon55–Reference Gershon, Lee, Antunez, Mankad, Singh, Bishop, Gunawan, Hopstaken and Haight60 as a substitute for Cu (0.74 Å), and Cd (0.92 Å)Reference Yuan, Chen, Xiang, Gong, Walsh, Park, Repins and Wei56,Reference Su, Tan, Li, Zeng and Batabyal61,Reference Fu, Tian, Zhou, Kou, Meng, Zhou and Wu62 as a substitute for Zn (0.74 Å). According to the calculated band structure as shown in Fig. 8(a), however, the VBM of CZTS is mainly composed of Cu 3d and S 3p states, while the conduction band minimum (CBM) is formed by the hybridization of S 3p and Sn 5s states.Reference Chen, Walsh, Gong and Wei19,Reference Paier, Asahi, Nagoya and Kresse63 This suggests that there is no significant contribution of Zn 3d states to either VBM or CBM, i.e., the Zn 3d states do not play a critical role in the near-band-edge electronic structure. In terms of maintaining good optical properties for photovoltaic applications (such as band gap) of kesterite, divalent cation substitution for the Zn site is more advantageous than monovalent cation substitution for the Cu site as long as the new divalent cation has a smaller or larger ionic size compared to Cu.
(a) The HSE-based band structure (left) and molecular interaction diagram (right) for kesterite-structured Cu2ZnSnS4.Reference Paier, Asahi, Nagoya and Kresse63 (b) Crystal structures and HSE-based band structures and density of states for Cu2BaSnS4−xSex (x = 0, 3, and 4). The Cu, Ba, Sn, S, and Se atoms of the crystal structure illustrations are shown in blue, gray, green, yellow, and light green, respectively.Reference Shin, Saparov, Zhu, Huhn, Blum and Mitzi68 (c) Evolution of calculated band measured band gap values as a function of Se content in Cu2BaSnS4−xSex.Reference Shin, Saparov, Zhu, Huhn, Blum and Mitzi68 Reproduced with permission from Refs. Reference Paier, Asahi, Nagoya and Kresse63 and Reference Shin, Saparov, Zhu, Huhn, Blum and Mitzi68.
Researchers have tried to substitute Zn sites with various transitional metals such as Mn, Fe, and Co. Unfortunately, no improvement in the CZTSSe photovoltaic performance was reported by such cation substitutions. Recently, Lie et al. observed that when the Mn content in CZTSSe exceeded 5 at.%, Mn-substituted device efficiencies significantly decreased; pure Cu2MnSn(S,Se)4-based photovoltaic devices even showed less than 1% power conversion efficiency (PCE) because of high carrier concentrations of about 1017–1018 cm−3.Reference Lie, Rui Tan, Li, Leow, Tay, Bishop, Gunawan and Wong64 In addition, Cu2FeSnS4-based and Cu2CoSnS4-based photovoltaic devices yielded a PCE of 0.08% and 1.78%, respectively, even when their band gaps are in the optimal range of 1.40–1.55 eV.Reference Dong, Ashebir, Qi, Chen, Wan, Chen and Wang65,Reference Maldar, Gaikwad, Mane, Nikam, Desai, Giri, Sarkar and Moholkar66 Such a low device performance seems to be associated with partially filled 3d states that lead to multiple charge states (e.g., the possible number of Mn oxidation states is 10) and semimetallic behaviors.Reference Lie, Rui Tan, Li, Leow, Tay, Bishop, Gunawan and Wong64,Reference Shin, Saparov and Mitzi67 Therefore, transitional metals with multiple charge states are not ideal candidates as cation substitutes for Zn sites.
More recently, several groups have attempted to use earth-alkali metals as an alternative cation to replace Zn in the CZTSSe since these elements have a stable divalent charge state (i.e., a fully filled 3d state) and an ionic size larger than that of Cu.Reference Shin, Saparov, Zhu, Huhn, Blum and Mitzi68–Reference Zhu, Huhn, Wessler, Shin, Saparov, Mitzi and Blum70 Based on these anticipated advantages, Wang et al. calculated the phase stability of a kesterite-based Cu2–II–Sn–S4 system with II = Mg, Ca, Sr, and Ba elements.Reference Wang, Chen, Yang, Lang, Xiang, Gong, Walsh and Wei71 However, it was found that the earth-alkali elements induce phase separation in binary and ternary compounds (e.g., Cu2MgSnS4 → Cu2SnS3 + MgS). Despite this theoretical prediction, Teske et al. successfully synthesized Cu2SrSnS4 (CSTS) and Cu2BaSnS4 (CBTS) from a mixture of three binary sulfides and the quaternary compounds. CSTS and CBTS crystallize in a trigonal structure with space group P31.Reference Teske72,Reference Teske and Vetter73 The discrepancy between theoretical and experimental studies originates from the crystal structure considered for the phase stability estimation of Cu2–II–Sn–S4 in a calculation that was different from the real crystal structure (i.e., a tetragonal structure with I-4 instead of a trigonal structure with P31 was applied for the DFT calculation.). A DFT study performed by Shin et al. verified that trigonal-structured Cu2–II–Sn–S4 systems with II = Sr and Ba are thermodynamically stable.Reference Shin, Saparov, Zhu, Huhn, Blum and Mitzi68,Reference Hong, Lin, Meng and Yan69 Particularly, the phase stability zone of CBTS is wider than that of CSTS.Reference Hong, Lin, Meng and Yan69 In this regard, the CBTS material system was considered as a novel earth-abundant chalcogenide with less antisite disordering.
Using X-ray diffraction data of solid-state-synthesized Cu2BaSnS4−xSex powders, Shin et al. observed that when the Se content in Cu2BaSnS4−xSex exceeds x > 3, there is a phase transition from a trigonal (0 ≤ x ≤ 3) to an orthorhombic structure (x = 4).Reference Shin, Saparov, Zhu, Huhn, Blum and Mitzi68 In addition to the phase transition [Fig. 8(b)], the estimated band gap of Cu2BaSnS4−xSex (0 ≤ x ≤ 3) decreases with Se content from 1.74 to 1.33 eV, whereas that of pure selenide (x = 4) shows a larger band gap of 1.50 eV.Reference Shin, Saparov, Zhu, Huhn, Blum and Mitzi68 The measured band gaps of Cu2BaSnS4−xSex (0 ≤ x ≤ 3) are in the range of 1.5–2.0 eV [Fig. 8(c)]. The two results are in good agreement. The band gap values of Cu2BaSnS4−xSex are suitable for single-junction and multiphotovoltaic applications.
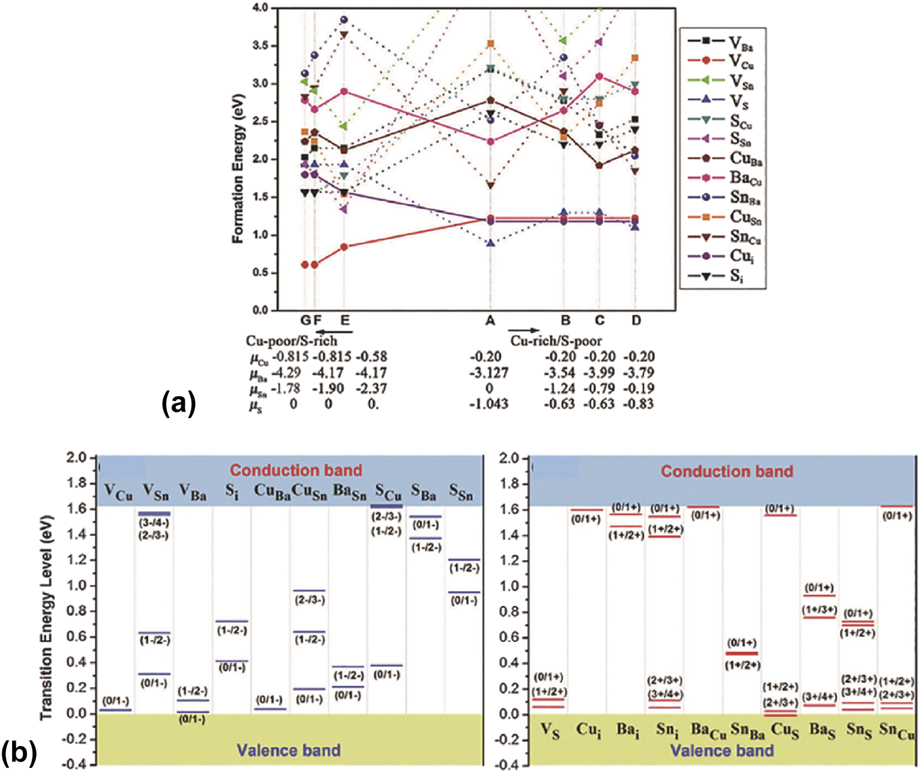
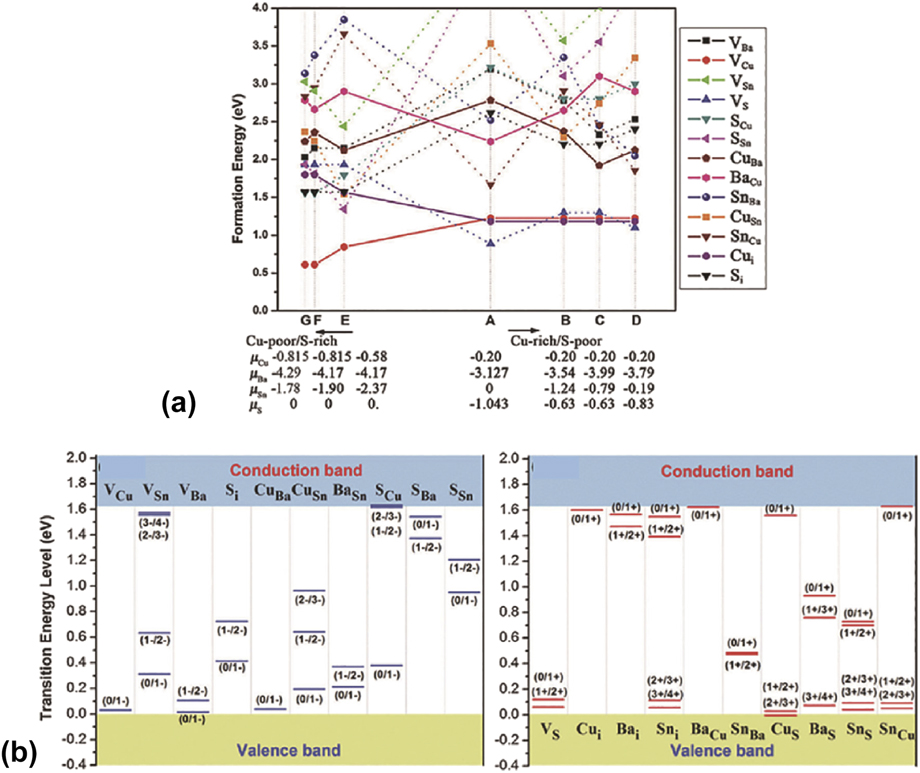
Hong et al. carried out a theoretical study on point defects of the CBTS.Reference Hong, Lin, Meng and Yan69 As can be seen in Fig. 9(a), under Cu-deficient compositions of CBTS (i.e., μCu < 0), the Cu vacancy (denoted as VCu) has the lowest defect formation energy, which means that the VCu is prevalent in the CBTS.Reference Hong, Lin, Meng and Yan69 In addition, the transitional energy level of VCu is a shallow acceptor that makes them an effective acceptor-like intrinsic defect [Fig. 9(b)].Reference Hong, Lin, Meng and Yan69 On the other hand, Cu–Ba antisite defects possess a very high formation energy due to the large ionic size of Ba.Reference Hong, Lin, Meng and Yan69 Therefore, cationic antisite defects would be unlikely to form in the material. Interestingly, the overall defect properties of CBTS are similar to those of CIGSe rather than CZTSSe.
(a) The calculated formation energies of intrinsic point defects for Cu2BaSnS4 as a function of chemical potentials.Reference Hong, Lin, Meng and Yan69 (b) The calculated transition energy levels of acceptor-like (left) and donor-intrinsic point defects (right) in Cu2BaSnS4.Reference Hong, Lin, Meng and Yan69 Reproduced with permission from Ref. Reference Hong, Lin, Meng and Yan69.
B. Potentials for earth-abundant Cu2BaSn(S,Se)4-based solar cells
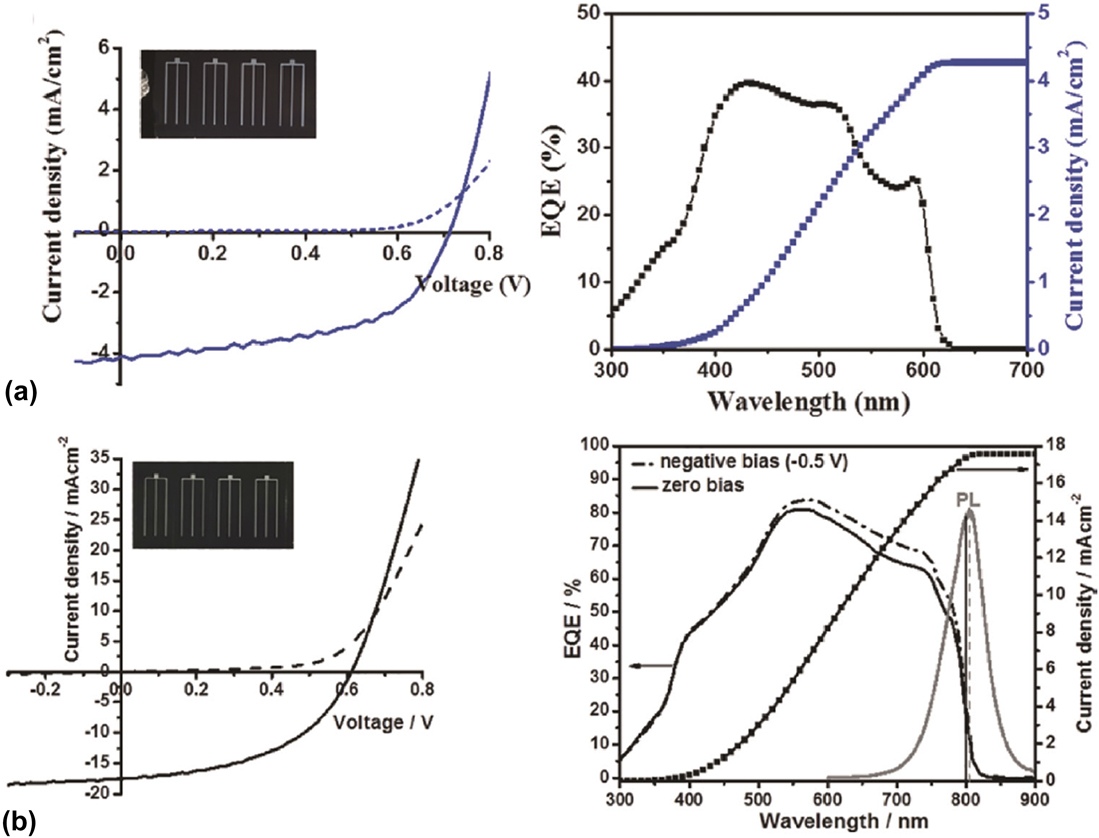
Recently, several groups demonstrated earth-abundant chalcogenide photovoltaic devices using trigonal Cu2BaSnS4−xSex (CBTSSe) absorbers.Reference Shin, Saparov, Zhu, Huhn, Blum and Mitzi68,Reference Hong, Lin, Meng and Yan69,Reference Ge, Koirala, Grice, Roland, Yu, Tan, Ellingson, Collins and Yan74,Reference Shin, Zhu, Huang, Gunawan, Blum and Mitzi75 As a proof-of-concept, the first reported CBTS-based photovoltaic device yielded 1.62% PCE using the same device architecture as CIGSe and CZTSSe solar cells [Fig. 8(a)].Reference Shin, Saparov, Zhu, Huhn, Blum and Mitzi68 A pure sulfide CBTS-based device with a CdS/CdS:O bilayer buffer achieved a higher PCE of 2.03% by Ge et al.Reference Ge, Koirala, Grice, Roland, Yu, Tan, Ellingson, Collins and Yan74 Low device efficiencies are due to the relative large band gap of CBTS, ∼2.0 eV, which is not optimal for single-junction solar cells. As previously stated, Se incorporation in CBTSSe leads to a reduction in the band gap; Cu2BaSnS4−xSex (x = 3) possesses a band gap of 1.55 eV as measured by PL [Fig. 10(b)].Reference Shin, Zhu, Huang, Gunawan, Blum and Mitzi75 An additional benefit of the selenization process is the enlargement of the CBTSSe grain size up to more than >1 μm, which is suitable for high-performance photovoltaic absorbers.Reference Shin, Zhu, Huang, Gunawan, Blum and Mitzi75–Reference Zhou, Shin, Ngaboyamahina, Han, Parker, Mitzi and Glass77 Because of the reduced band gap and improved microstructure of CBTSSe, Se-incorporated CBTSSe photovoltaic devices demonstrated the highest PCE of 5.2% with V oc = 611 mV, J sc = 17.4 mA cm2, FF = 48.9% as shown in Fig. 10(b).Reference Shin, Zhu, Huang, Gunawan, Blum and Mitzi75 The abrupt absorption transition in the EQE spectrum and sharp PL feature suggest that band tailing associated with antisite defects is not a substantial issue in this material. In terms of control over the detrimental antisite defects and associated band-tailing, Ba substitution makes the Se-rich CBTSSe absorber an attractive candidate for the use within earth-abundant photovoltaic devices.
The light (solid line) and dark (dashed line) current density–voltage characteristics and external quantum efficiencies spectrum of (a) Cu2BaSnS4-based and (b) Cu2BaSnS4−xSex (x ≈ 3)-based PV devices.Reference Shin, Saparov, Zhu, Huhn, Blum and Mitzi68,Reference Shin, Zhu, Huang, Gunawan, Blum and Mitzi75 In (b), the PL spectrum for Cu2BaSnS4−xSex (x ≈ 3) film is also displaced. Reproduced with permission from Refs. Reference Shin, Saparov, Zhu, Huhn, Blum and Mitzi68 and Reference Shin, Zhu, Huang, Gunawan, Blum and Mitzi75.

IV. CONCLUSION AND OUTLOOK
In this review, we discussed the point defects and secondary phases in the kesterite compound CZTSSe. Examining the point defects and phase inhomogeneity in the nanometer scale is advisable for gaining an understanding of the intrinsic properties of CZTSSe and to overcome the current challenges they pose. Using advanced characterization techniques such as STEM and APT, researchers have confirmed the presence of Cu–Zn disordering (point defects known to be the most detrimental for the CZTSSe device performance) and secondary phases distributed over CZTSSe. To suppress the cationic disordering, the substitution of Zn with an element that is different in size from that of Cu or Zn is particularly attractive because Zn 3d states do not play a critical role in the near-band-edge electronic structure, and therefore would not significantly alter the band gap. Recently, CBTSSe has emerged as a novel earth-abundant chalcogenide material that has a lower degree of antisite disordering with a remarkable efficiency over 5%. This novel strategy provides an open opportunity in the field of earth-abundant photovoltaic materials for further improvement that can ultimately achieve highly efficient earth-abundant thin film solar cells.
ACKNOWLEDGMENTS
This work was supported by the Korea Institute of Energy Technology Evaluation and Planning (KETEP) and the Ministry of Trade, Industry & Energy (MOTIE) of the Republic of Korea (Nos. 20163030013690 and 20173010012980), by the Technology Development Program to Solve Climate Changes (No. 2016M1A2A2936757) and Brain Pool Program (Grant No. 2018 H1D3A2002475) of the National Research Foundation (NRF) funded by the Ministry of Science and ICT. This research was also financially supported by the Framework of the Research and Development Program of the Korea Institute of Energy Research (KIER) (Grant No. B8-2421).