Introduction
In the 1960s researchers began to investigate earthen architecture in the European Union (Terra Europae, Reference Correia, Dipasquale and Mecca2011). According to Terra Europae (Terra Europae, Reference Correia, Dipasquale and Mecca2011) and Terra (In)cognita (CRAterre-ENSAG, 2008), earthen constructions were distributed widely across Europe through diverse traditional techniques in an astonishing historical language of earthen architecture. The oldest earthen techniques identified in Europe are: adobe, half-timber, cob, rammed earth and daubed walls. More recently techniques such as lump, compressed earth blocks, earth bags and straw-bale structure with earthen plaster have also been applied in construction. In 2011 a map of Earthen Heritage in the European Union was published that records four main techniques: half-timber with earth, adobe, rammed earth and cob (Terra Europae, Reference Correia, Dipasquale and Mecca2011). Important areas of adobe were identified in the coastal Central region of Portugal; in many regions of Spain (Salamanca, Valladolid, Burgos, Zaragoza, Murcia and others); in France mostly in an area between Bordeaux and Toulouse; in Italy as disseminated areas in the north (Milan–Bologna) and south (Potenza–Catanzaro); and many other countries. Earthen construction has a rich catalogue of practises and methods – a minimum of twelve main techniques of construction using earth have been identified worldwide by Houben and Guillaud (Reference Houben and Guillaud1994) – however they are disappearing due to the globalisation of modern techniques, such as use of reinforced concrete, as well as the lack of good practices in conservation.
Specific research lines have been orientated towards identification and characterisation of analytical methods as well as material improvement and performance (Costa et al., Reference Costa, Silveira, Tavares, Varum, Almeida, Arêde, Correia, Carlos and Rocha2014), structural performance (Lourenço and Peña, Reference Lourenço, Peña, Achenza, Correia, Cadinu and Serra2006; Costa et al., Reference Costa, Silveira, Tavares, Varum, Almeida, Arêde, Correia, Carlos and Rocha2014), historical study of earthen construction structures (Houben and Guillaud, Reference Houben and Guillaud1994; Tavares et al., Reference Tavares, Costa and Varum2012a; Fernandes and Tavares, Reference Fernandes and Tavares2016), physical condition (Lourenço and Peña, Reference Lourenço, Peña, Achenza, Correia, Cadinu and Serra2006), traditional methods and materials (Fernandes and Tavares, Reference Fernandes and Tavares2016), architectural design and typologies (Tavares et al., Reference Tavares, Costa and Varum2012a; Fernandes and Tavares, Reference Fernandes and Tavares2016), conservation case studies (Achenza, Reference Achenza2008: Tavares et al., Reference Tavares, Costa and Varum2012b; Fernandes and Tavares, Reference Fernandes and Tavares2016), building materials and techniques (Velosa and Veiga, Reference Velosa, Veiga, Neves, Varum, Fernandes and Correia2007; Tavares et al., Reference Tavares, Costa, Rocha and Velosa2016), and plaster analysis and preservation (Velosa and Veiga, Reference Velosa, Veiga, Neves, Varum, Fernandes and Correia2007; Costa and Tavares, Reference Costa, Tavares, Póvoas and Mateus2016; Tavares et al., Reference Tavares, Costa, Rocha and Velosa2016). Nevertheless, the abundance of earthen construction systems shows regional differences which can be seen in the type of construction of walls of old buildings, as is the case in buildings studied in this work in the Aveiro region, Portugal, the well-known ‘Portuguese Venice’.
The role of earthen walls in the traditional construction system of the coastal central region of Portugal is crucial, as they are the main loadbearing elements of the buildings, in line with almost all types of earthen construction worldwide. In this region, earthen architecture is distributed throughout the territory, in urban and in rural areas, in all types of buildings, from housing to public buildings. The main earthen construction techniques in the region are composed of formed masonry with lime mortar (a monolithic masonry with earth, stones and ceramic debris) and adobe masonry, for loadbearing walls and facades, complemented by half-timber with earth infill (tabique) for interior walls.
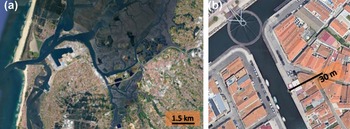
Although there is increasing recognition of the relevance of this legacy, the lack of knowledge in the practice of conservation is leading to the destruction of this built heritage, based on misunderstandings and incomplete or poorly communicated scientific knowledge. This is the case for the earthen architecture near the coastal lagoon named Ria de Aveiro, Portugal (40.66N, 8.69W, salt water with a length of 45 km, Fig. 1) in which the impact of floods in the past and the expected rise of sea water in the future require additional urgent preventive measures. In Fig. 1a the grey area shows the present flooding pressure and its proximity to the city centres of Aveiro (on the right) and Gafanha da Nazaré–Ílhavo (on the left). In addition to flooding risk, traditional earthen constructions in this region have walls with high porosity and consequent permeability, which, with the proximity to Ria de Aveiro and a high phreatic level, increases the decay of the walls due to rising damp with efflorescent salts. Most of the houses close to Ria de Aveiro channels have foundations built on sediments constituted of muds and muddy sands over clay materials and disintegrated sandstones of around one metre deep. The phreatic level is high, almost at the level of the ground floor of housing. In addition, in the past, sanitation was linked to the Ria de Aveiro, contaminating the channel water. This is the situation for the building chosen for this case study, located 30 m from the Ria de Aveiro channel (Fig. 1b).
(a) The coastal lagoon ‘Ria de Aveiro’ and the city centre of Aveiro (at the right in the image) (modified from Google maps). (b) Location of the old earthen case-study building in Aveiro (modified from Google maps).

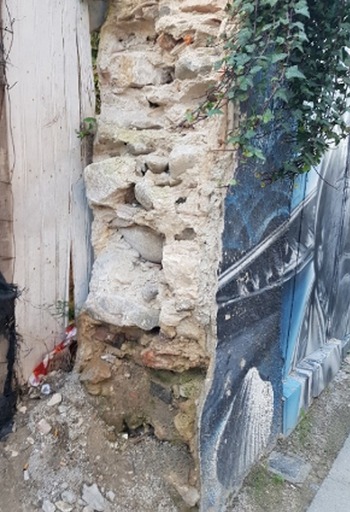
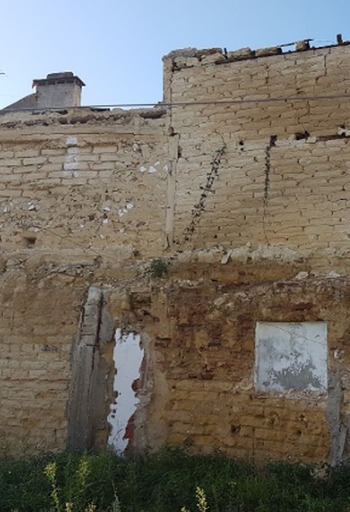
In this region, building walls are formed masonry with lime mortar (Fig. 2), usually over a stone masonry wall with earthen filling. This wall can contain several materials: rocks of different compositions, shapes and sizes; bricks; tiles; and timber – creating a wall similar to a rammed earth wall. Adobe masonry is composed of adobe blocks and earthen mortar, both with lime in their composition (Fig. 3). Their shallow foundations (0.30 m to 0.50 m deep) present the same diversity of materials but with much more rock debris with larger dimensions, sometimes the same as those used as ballast in ships. The foundation (footing) of adobe walls can also be made with the same material (adobe) with a different layout of adobe blocks to thicken the wall and may also have solid bricks around the windows. The reduced depth of the foundation is a problem in terms of wall strength and in relation to control of rising damp, as the ground soil is composed mostly of clays with a high phreatic level.
Section of formed masonry with lime mortar, Ria de Aveiro region. Width of wall 0.52 m (© Alice Tavares).

Traditional wall of adobe masonry, Ria de Aveiro region (© Alice Tavares).

The main scope of this research, at the University of Aveiro, Portugal, was to characterise the composition of the walls of two types of earthen construction, the efflorescent salts, their progression, and damaging effects on those walls. Two different possible remediation approaches were also tested to support future preliminary conservation measures to counteract one of the predicted consequences of climate change, the impact of sea level rise on urban structures.
To accomplish the defined objectives, the research pursued three main stages: Step 1 comprised a preliminary analysis of the building materials involving: the characterisation of the earthen walls to understand the interrelationship between the constitution of the walls and the differences in the observed efflorescence; analysis of the decay of the base of the earthen walls and identification of the salts; and hygrothermal monitoring of the interior space of the building, and outside during the in situ tests, to better understand the environmental conditions leading to the occurrence of the efflorescences of the identified salts and their specific phases.
Apart from the preliminary analysis of the materials and hygrothermal monitoring, two other phases related to possible techniques for preventing wall decay were implemented: Step 2 was to investigate the effect of a traditional preventive measure to counteract wall decay. A traditional lime water treatment was studied to understand its impact on the crystallisation of salts in the walls and to determine whether this traditional practice makes any contribution to salt decay prevention. Step 3 was to assess the effect of a sacrificial mortar previous to the intervention. A sacrificial mortar of air lime [Ca(OH)2] was used with diatomite (pozzolan) to understand whether its application was beneficial as a preliminary treatment measure, either to prevent the salt formation or decrease the salts effects in the walls. Previous laboratory tests were carried out and after verifying the suitability of the sacrificial mortar for the purposes, it was applied in the real context, on both walls of the case study, followed by analysis of the wall.
Site description
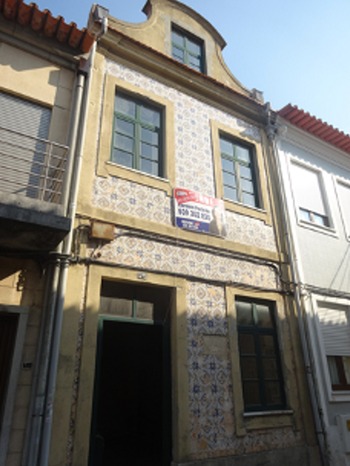
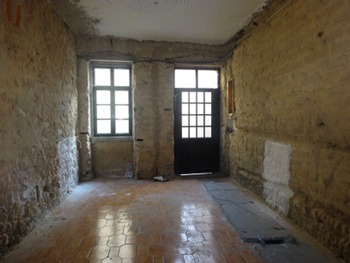
A century-old earthen building in Aveiro was chosen for the case study, shortly before its rehabilitation. The building with two floors and an attic (Fig. 4) is 30 m from a channel of the Ria de Aveiro (Fig. 1b). The construction system of the building comprises loadbearing walls of formed masonry and adobe masonry with timber structures for the floors and roof. Two parallel walls with different constitutions – a formed wall (left in Fig. 5) and an adobe wall (right in Fig. 5) – from the room close to front façade were chosen for in situ tests. Both walls are loadbearing gable walls of the main room facing the street (Fig. 5) and have an approximate thickness of 0.35 m. They have a height of 3.20 m and support the timber beams of the upper floor structure. Both walls have 0.30 m deep foundations. The formed wall foundation has the same type of masonry as described above and the adobe wall foundation is made up of adobe blocks. Although both earthen walls present different constitutions, both are subjected to the same environmental conditions and water pressure with the same phreatic level. The floor of this room was cemented and covered with glazed ceramic tiles. The front facade wall is composed of adobe masonry and for this reason has a role in the interior hygrothermal conditions, contributing to diminishing thermal amplitudes inside (in the case-study room).
Front façade of case-study building (© Alice Tavares).

Room of case-study building with lime water painting in two walls, left – formed wall; right – adobe wall (© Alice Tavares).

Usually, old buildings have a void for ventilation in the base of the walls (below the ground floor level) to better dry the basement walls and timber structures of the ground floor and consequently to increase the durability. This is not the situation for the case-study building. Due to changes in the urban streets, several buildings no longer have ventilation holes, associated with a basement void space, in their façades. The levels of the streets have risen due to successive application of pavement layers, resulting in covering and closure of the façade holes. In addition, the owners changed the structure of the ground floor, which involved the replacement of the timber beams by reinforced concrete slabs. The impact of both actions was to increase the efflorescence in the walls (interior and exterior) as the moisture from the soil cannot dissipate through the ventilation from the air void at the basement level. This case-study building contains the results of efflorescence in the base of the walls of the ground floor. The main lateral loadbearing walls are shared with the adjacent building on both sides which is common in the building stock of the city centre. This situation was an impediment to making a horizontal cut through the walls to insert a waterproofing barrier across the wall thickness and for this reason alternative accessible measures were tested and are presented here to surpass the rising damp effects producing salts.
Materials and methods
Before any intervention in constructions belonging to the earthen heritage buildings, it is important to know the specific earthen materials used in their construction. Severe problems have already been identified in the rehabilitation processes when new materials, such as cement or concrete, are mixed with old building materials, due to their different physical and chemical properties. Construction defects or the progress of ageing or even the impact of environment changes require an in situ investigation of existing materials.
Hygrothermal monitoring
Hygrothermal monitoring took place for approximately four months, throughout the end of winter and spring in Portugal, as this is a more aggressive period with higher humidity levels and lower temperatures. The in situ tests took place from the first of March until the 26th of June, 2018. The hygrothermal monitoring of the room atmosphere (Fig. 5) and the outside atmosphere were carried out simultaneously. For the hygrothermal monitoring of the interior and the exterior space of the building, a set of TESTO 174H temperature data loggers was installed, which recorded the temperature and relative humidity. They were placed in rooms on opposite sides of the building (close to the test areas) and on the terrace without being in direct sunlight or airflows.
Characterisation of walls and effects of salts
Due to the different absorption capacity of earthen materials, it was necessary to distinguish the original materials from other components that arise during the ageing process, or from later additions and interventions in the building's lifetime.
Samples were collected from the case-study building to characterise the two types of wall – formed masonry wall and adobe masonry wall (left and right sides of Fig. 5 respectively) – arising from different periods of construction. The adobe wall had two horizontal grooves cut for the passage of infrastructures, at levels of 0.30 and 1.10 m from the floor, resulting from an older rehabilitation intervention not completed (Fig. 5).
The two walls were not plastered, the plaster was removed prior to this study in a preliminary stage of rehabilitation, however the formed wall had a first layer of plaster with mortar and pieces of broken tiles to fill gaps and increase the strength of this sublayer. There are openings in the adjacent wall (main façade wall), with a window on the side nearest the formed wall and an aluminium door with an opaque bottom (Figs 4 and 5) on the side nearest the adobe wall.
A mortar sample was taken from the formed wall, an adobe block and mortar were removed from the adobe wall, and efflorescence (salts) were sampled from both walls, to determine the mineralogical composition, as well as microstructural aspects and granulometric characterisation of the aggregates. The samples were collected in the preliminary phase (Step 1) of the rehabilitation work.
The samples were ground and homogenised in an agate mortar and analysed by in situ powder X-ray diffraction (XRD) for crystalline phases characterisation. Data were collected in a Empyrean Panalytical diffractometer (Almelo, Netherlands) in Bragg-Brentano para-focusing optics configuration (CuKα X-radiation) with a fixed divergence slit of 0.25°, Ni filter, and a linear PIXEL detector with an active length of 3.3473°. Intensity data were collected using thecontinuous counting method (step 0.0263° and time 70 seconds) in a 2θ range from 5 to 80°. The quantification was performed by Reitveld refinement of mineral structures identified by comparison with the ICDD (International Centre for Diffraction Data, https://www.icdd.com/) database.
Traditional painting of walls with lime water
It was mentioned previously that the traditional way of preserving walls from deterioration has been painting with lime water. In Step 2, traditional lime water was used to understand its impact on the salt crystallisation in the walls. Lime water was prepared by mixing calcium dihydroxide with distilled water in the proportion of 1 g Ca(OH)2 for 700 g water. Hydrated lime (calcium hydroxide CL 90-S) was obtained from Maxical, Sociedade Industrial e Comercial de Cal da Maxieira, Fátima, Portugal.
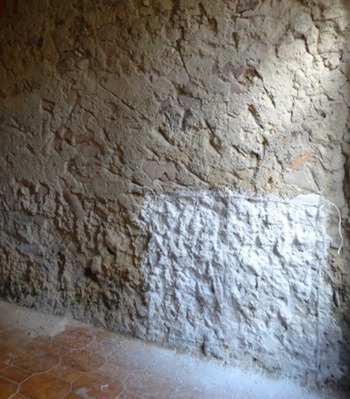
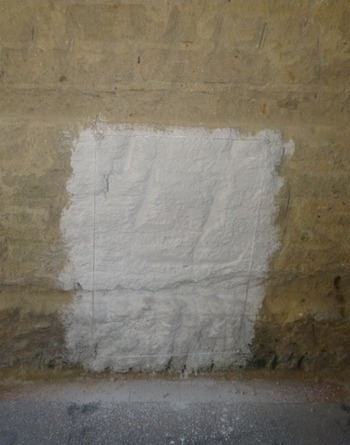
Prior to the lime water application, selected areas of both test walls were scraped and surface salts removed. After cleaning the wall, brushing and removing salt, lime water was applied to both walls of the room in an area 0.5 m wide by 1 m high (Figs 6 and 7).
General view of the beginning of the lime water application (1.10 × 1.0 m) on formed wall (© Alice Tavares).

General view of the beginning of the lime water application (1.0 × 1.10 m) on adobe wall (© Alice Tavares).

Sampling of salt efflorescence and wall observations were made seven and fifteen days after painting the walls with lime water. The characterisation of crystalline materials was done by powder XRD as described above.
Sacrificial mortar composition, characterisation and laboratory tests
As mentioned earlier, in Step 3 a sacrificial mortar was used. Before application to the wall, the mortars were prepared in the laboratory following the procedure AASTHO: T162-04 – ASTM C-305-99 – mechanical mixing of hydraulic cement pastes and mortars of plastic consistency (ASTM C-305-99, 1999). The mortars were composed of lime and sand in a proportion of 1:3 and pozzolan (5% of non-calcined diatomite). The progressive mixing process and mixing periods followed this regulation and were described in Tavares et al. (Reference Tavares, Costa, Rocha and Velosa2016). Tap water was used for mixing.
Two types of sand were used in the mortars from the Aveiro region with different granulometries to obtain an overall mixture of grains up to a dimension of ~2 mm.
Non-calcined diatomite (diatomaceous earth) is a powdery material composed of the fossilised skeletal remains of diatoms (microscopic single-cell aquatic plants) with a porous structure, each with its own distinct shape, ranging in size from <5 μm to >100 μm (Dolley, Reference Dolley2000). Their chemical composition (mainly amorphous silicon dioxide) and physical structure promotes their use for e.g. filter aids, functional fillers or components of aggregates (Dolley, Reference Dolley2000; Bakr, Reference Bakr2010). The non-calcined diatomaceous earth (from Portugal) was purified to improve the porous structure by removing impurities from the surface and clogged pores, and then milled to an average diameter of 10 μm.
Preliminary laboratory tests were carried out to characterise the behaviour of the mortars in relation to water absorption and capillary transport of salts. Several mortars with different compositions were tested for capillary water absorption by Tavares et al. (Reference Tavares, Costa, Rocha and Velosa2016), and for the purpose of this work, the mortar with the composition described above was chosen, based on laboratory experiments with aqueous solutions of sodium sulfate described here. The laboratory experiments were done with the chosen mortar applied to adobe cubes cut from adobe blocks taken from an existing building in the region of Aveiro (5 km from the case-study building) with characteristics similar to the case study. The adobe blocks were acclimatised to natural laboratory ambient conditions of temperature and humidity for three weeks before preparing the adobe combined blocks for laboratory testing.
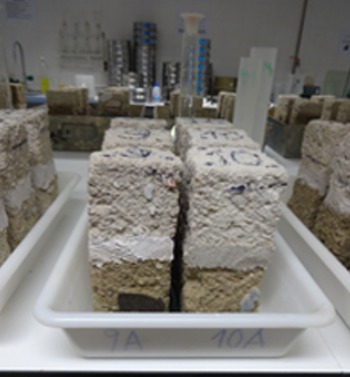
In the laboratory, the adobe combined blocks (adobe block + mortar + adobe block) (Fig. 8) were made from two 8 cm edge adobe cubes glued together by a 2 cm thick mortar of dolomitic aerial lime + sand (a slurry of calcium dihydroxide and water [w water = m water/m total = 0.56] was added to a mixture of sand and diatomite to which was added more water [w water = m water/m mixture = 0.20]). The cubes were numbered, weighed and each edge measured. Each adobe combined block was identified and numbered with a code (CADn1, CADn2, etc.). They were kept for 60 days in a conditioning chamber with constant temperature (θ = 20°C) and relative humidity (RH = 100 p w/p°w = 95, where p w is the water vapour pressure above the salt solution, and p°w is the saturation vapour pressure of pure water, at the measured temperature) (EN 1015-18, 2002). After this period, they were dried at 60°C until a constant mass was obtained. Then they were measured and weighed before capillarity testing. The preparation of all samples (mortars and adobe combined blocks) was done on the same day, under the same environmental conditions and by the same person.
Adobe combined blocks (18 × 8 × 8 cm) under capillarity test (© Alice Tavares).

For both capillarity tests, with distilled water and the aqueous solution of sodium sulfate ($m_{{\rm N}{\rm a}_2{\rm S}{\rm O}_4} = 1.15\;{\rm mol\;k}{\rm g}^{{-}1})$ , the adobe combined blocks were placed in a tray over a thin layer of sponge. Six adobe combined blocks were coupled in the same holder (Fig. 8). The capillarity tests were carried out following the recommendations EN 15801:2009 (2009) and EN 1015-18 (2002). Distilled water or 1.15 mol kg−1 aqueous solution of sodium sulfate was added to submerge the base of the specimens to a height of 10 mm (EN 1015-18, 2002). The height of the water was kept constant throughout the test, and corrections were made after weighing the samples. During the tests, the temperature was kept between 17.9 and 18.5°C, and the relative humidity in the range of 100 p w/p°w from 69 to 81.
Each specimen was weighed, and the respective wet front level was evaluated at the recommended times up to 1440 min, following the standards EN 15801:2009 (2009) and EN 1015-18 (2002). However, the weighing protocol was carried out for 72 h. The sample pieces were pulled successively, the submerged part was wiped to remove water droplets and weighed immediately. The time interval from the beginning of the test to the moment of the wet front and weighing measurements was recorded.
The replication of the oldest formed wall was not done, as it was not possible to reliably simulate its heterogeneous characteristics in the laboratory, however, in part, it is mainly composed of mortar earth.
The preliminary laboratory tests showed that the tested mortar was suitable to control the progress of salts crystallisation. Thus, it was applied on 30 cm × 30 cm areas of both walls of the building, in the same area where the lime water tests (Step 2) were carried out, but which had been removed by brushing.
Mercury intrusion porosimetry
The porosity of the lime mortar used in Step 3 was determined by mercury intrusion porosimetry using the certified Instituto Pedro Nunes, Coimbra, Portugal (IPN Led & Mot Laboratory) with Micromeritics AutoPore IV equipment. This method evaluates the pore size distribution and porosimetry of solid materials, according to ISO 15901-1 (2016), by the intrusion of mercury into pores with diameters between 360 μm for minimal pressure and 5.5 nm for maximum pressure. The CADn mortars were tested 50 days after their preparation.
Results and discussion
Hygrothermal monitoring of the interior space and outside
During the monitoring period external temperatures remained below 20°C on most days; for the entire monitoring period, the average external temperature was 15.5°C and the average relative humidity 100 p w/p°w = 80.4. These data are consistent with spring in Portugal and in the Aveiro region.
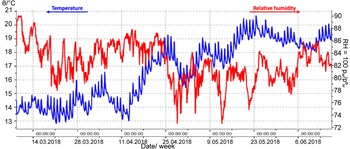
The temperature and relative humidity recorded inside the building for the test period are shown in Fig. 9. A summary of the maximum and minimum temperature and relative humidity records during the test period is presented in Table 1.
Graphic of time series plot of temperature and relative humidity changes inside the building for the period of test from 1st March to 26th June 2018.

Hygrothermal monitoring data (internal and external) during in situ experiments. Maximum and minimum temperatures and relative humidities recorded between 1st March and 26th June 2018.

* p w is the water vapour pressure above the salt solution, and p°w is the saturation vapour pressure of pure water, at the temperatures of the measurements.
Data from Table 1 show the thermal inertia of the adobe wall of the main façade, which kept the temperature inside the building (including the test room) between 13 and 21°C, while the outside temperature had a much wider temperature range. Note also the constant high levels of humidity, with RH = 100 p w/p°w between 90 and 73 inside the building, characteristic of a vacant building subjected to previous rehabilitation changes that reduced natural ventilation.
However, during Step 2, when the effects of traditional surface painting with lime water were observed and recorded as a preventive measure for walls deterioration, the maximum internal temperature was in the range between 13.5 and 15°C and the relative humidity (100 p w/p°w) between 81.8 and 89.3. About halfway through the total test period, there was a sudden increase in outdoor temperature for a short period of time, which explains the data in Table 1.
The data show that the adobe wall of the main façade has a thermal inertia capacity (a common feature of earthen walls such as adobe masonry), causing a considerable difference between the exterior and the interior, both in terms of temperature and in terms of humidity. These data were important for the overall analysis of the tests results.
Characterisation of earthen walls of civil architecture
In the region of Aveiro, due to its location on the west coast of the Iberian Peninsula where the mouths of several rivers are found, there are sedimentary deposits made up of materials of different dimensions with maritime, fluvial and wind origins from different geological periods (Carvalho, Reference Carvalho1951). Earthen constructions are considered sustainable with very low environmental and energy impact, as they use accessible raw materials gathered in the region where the constructions were built, involving the community. A good raw material for the manufacture of adobes is sand with clay (Costa et al., Reference Costa, Rocha, Varum and Velosa2013; Pereira, Reference Pereira, Jorge, Rocha, Pereira and Cruz2019). Adobe blocks were made and moulded with wet clayey sandy sediments mixed with lime, and dried in the sun.
The mineralogical composition of the materials of the adobes and of the formed walls is likely to be similar to the sands and clays of the region. The most abundant minerals in the sands of the Aveiro region are quartz (SiO2), (calcium–sodium) and (potassium–sodium) feldspars, and mica-group minerals (muscovite), and to a lesser extent calcite (CaCO3) and traces of dolomite [(Ca,Mg)CO3]. The clays are predominantly kaolinite [Al2Si2O5(OH)4] and illite, containing a small percentage of minerals from the chlorite and smectite groups (Rocha et al., Reference Rocha, Silva, Bernardes, Vidinha and Patinha2005; Costa et al., Reference Costa, Rocha, Varum and Velosa2013). In addition there are also iron(III) hydroxides–oxides in different states of crystallisation and solid phases.
The XRD analysis of samples from the formed wall (Supplementary figures 1S to 4S) and adobe wall (Fig. 5S) showed the presence, as expected, of quartz, feldspar and mica with different compositions, calcite and minor traces of dolomite, in addition to clays for which a specific analysis was not performed. In the samples of the formed wall, anhydrite (Supplementary fig. 2S) and iron(III) hydroxide oxide [FeO(OH)] were also identified. This solid phase, and probably other less crystalline solid phases, can be formed from possible reactions promoted by the addition of water to the mixture of sand and clay sediments with calcium oxide. In addition to the formation of calcium dihydroxide, an aqueous solution with pH > 10 can increase the solubility of some silicates and promote the formation of new silicate-containing solid phases. Over time, other chemical reactions will occur such as the formation of calcium carbonate from the reaction of calcium dihydroxide with the carbon dioxide from the atmosphere. Rocha et al. (Reference Rocha, Silva, Bernardes, Vidinha and Patinha2005) identified the presence of anhydrite in sediments sampled from the Aveiro Lagoon, which may explain the presence of anhydrite also identified in samples of the formed wall. The existence of anhydrite can be explained by its situation in the formed masonry where it does not contact the ascending salts solution (from rising damp). The fieldwork carried out did not change the conditions of progression of rising damp and as the formed masonry with lime mortar is a very heterogeneous system formed by an agglomerate of different materials, possible reactions involving anhydrite were not expected. As the anhydrite is vestigial in the wall and because it has not yet reacted with water, it can be considered that it would be in a place isolated from contact with moisture. The activity of water in rising damp with salts would cause a reaction with anhydrite to form gypsum. Despite the apparently similar mineralogical composition of both walls, the construction technique and materials are very different, causing differences in their behaviour, which can influence the response to the effects of salts.
Analysis of the decay of the base of the earthen walls and identification of salts
Although several authors (Camuffo et al., Reference Camuffo, Bertolin, Amore, Bergonzini, Brimblecombe, Degrigny and Cleaver2010; Fernandes and Tavares, Reference Fernandes and Tavares2016; Tavares et al., Reference Tavares, Costa, Rocha and Velosa2016; Shahidzadeh-Bonn et al., Reference Shahidzadeh-Bonn, Desarnaud, Bertrand, Chateau and Bonn2020) mention the problem of the effect of humidity and rain water on the conservation of earthen constructions, studies on the chemical effects of rising damp on the earthen buildings in the region is scarce. Regardless of location (urban or rural areas), in most cases, the presence of efflorescence was found at the base of the walls.
A visual inspection of the case-study building showed that there were some similarities and some differences in the distribution of efflorescence and granular disaggregation on both walls.
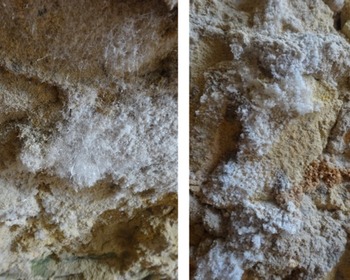
This first analysis based on visual inspection of the formed masonry wall (Fig. 10) recorded that the base of the wall was damp up to a height of 0.40–0.50 m, salt crystals could be observed in a dispersed form and up to ~1.00 m and the surface showed disaggregation. Above 0.50 m salt crystals in surface voids were visible, as well as a wider granular breakdown.
Presence of efflorescent salts in different locations on the formed wall, image height: left – 6 cm; right – 36 cm (© Alice Tavares).

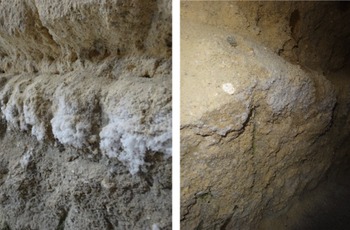
The visual inspection of the adobe masonry wall (Fig. 11) found the base of the wall was damp and had a groove in the wall 0.30 m from the floor that had salt crystals on the lower border of the groove. It presented disaggregation on the inner and lower face of the groove. Above the groove there were few dispersed salts, although the granular disintegration of the wall reached ~1.10 m in height.
Presence of efflorescent salts in different locations of the same row of the adobe wall, image height: left – 45 cm; right – 50 cm (© Alice Tavares).

Some objectives of this work were to identify and understand which salts existed and the reasons for the differences observed in the progression of the salt, including the fact that the disaggregation reached a higher level in the adobe wall than in the formed wall, however in the formed wall it was more severe in the affected areas. Before any intervention, the efflorescence on the walls was sampled and analysed by powder XRD (Supplementary fig. 6S). The analysis of the efflorescences of both walls showed that they contained the same solid phases, the simultaneous presence of thénardite (Na2SO4) and mirabilite (Na2SO4⋅10H2O) with a higher percentage of mirabilite. Apparently, the formed masonry wall showed a higher percentage of mirabilite than the efflorescence of the adobe masonry wall (Table 2), bearing in mind that XRD has quantitative limitations.
Ratio (%) of thénardite and mirabilite in efflorescences collected from the formed wall and adobe wall.

Steiger and Asmussen (Reference Steiger and Asmussen2008) made a thorough review of the literature on the system Na2SO4–H2O and concluded that the published literature was not fully consistent. These authors provided an updated phase diagram for the Na2SO4–H2O system based on their new experiments on the crystallisation of sodium sulfates. The data presented in Table 3 were taken from this reference and were used to analyse the observed changes in the thénardite–mirabilite system that can be represented by the chemical equilibrium:

Mirabilite (Mi) and thénardite (Th) solubilities (S), deliquescence relative humidities (RHsat = 100 p w/p°w)* and equilibrium relative humidities for the mirabilite–thénardite transition (RHTh-Mi = 100p w/p°w)*, at the maximum and minimum temperatures registered in the interior of the case study house.**

* p w is the water vapour pressure above the salt solution and p°w is the saturation vapour pressure of pure water, at the given temperatures
** Data calculated from Steiger and Asmussen (Reference Steiger and Asmussen2008)
Equilibrium between the two solid phases occurs for atmospheres with relative humidity, 100 p w/p°w between 70 and 77 depending on the temperature inside the room. Inside the case-study building, a minimum RH = 100 p w/p°w = 73 was measured, which explains the coexistence of both solid phases with mirabilite crystallised on thénardite. The relative humidity inside the room, remained in the range of 100 p w/p°w from 73 to 90, which allows the formation of thénardite and for greater relative humidity the formation of mirabilite. Evaporation of water from the surface of damp walls is necessary for the formation of crystals and will be faster if the relative humidity of the environment inside the room is lower. Thus, thénardite formation is expected to occur first and only later to convert to mirabilite when there is an increase in air humidity inside the room. The formation of mirabilite should occur on thénardite crystals, when the relative humidity of the room reaches values that promote the dissolution of thénardite, at 100 p w/p°w > 86–87, and then the formation of saturated aqueous solutions of mirabilite much less soluble in water (Table 3), which can crystalise slowly in equilibrium with thénardite.
Analysis of the effect of a traditional preventive measure of walls decay
In the past, it was common to use lime water annually on the walls, which, according to testaments from former residents, served to ‘disinfect’ the walls. In fact, the tests carried out showed that this action has a role to play in the preservation of the walls.
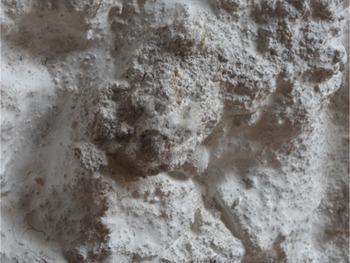
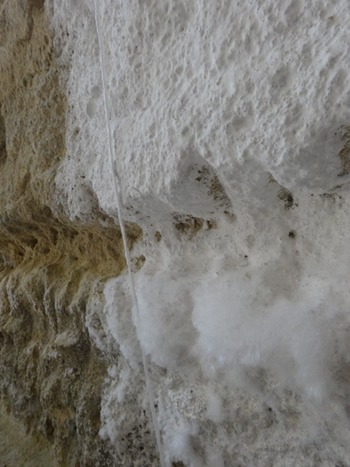
The first sampling of efflorescence and observation of the walls were carried out seven days after painting the walls with lime water. They showed that the presence of salts in the formed wall was still barely perceptible, by direct observation. Salts could only be seen in more prominent areas, though of reduced size, and some disaggregation was observed with loss of lime water paint (Fig. 12). On the contrary, on the adobe wall salts formed at its base (Fig. 13), especially on the lower edge of the groove, with greater expression than before the application of lime water. The upper part of the adobe wall groove had no visible salts or surface disintegration; they were concentrated in the lower part of the wall's groove. This occurrence may be associated with the fact that in the border area the nucleation proceeds more easily, probably due to a higher concentration of the solution promoted by possible evaporation of water.
Detail of salts and disaggregation in test area (image height – 20 cm) of formed wall seven days after lime water painting (© Alice Tavares).

Detail of salt efflorescences in test area (image height – 50 cm) of adobe wall seven days after lime water painting (© Alice Tavares).

The second efflorescence sampling and observation of the walls were done 15 days after painting the walls with lime water. As in the previous site analysis, the samples of salts were removed from the walls, kept in closed containers, and analysed by XRD. The composition of the efflorescent salts collected from both walls, either before the application of lime water or 15 days after painting with lime water, is presented in Table 4. Visual observation and the photographic record were able to confirm the two different types of crystalline forms identified by XRD. The results showed that the use of lime water can have different effects on the earthen walls depending on their composition i.e. formed masonry wall or adobe masonry wall. The application of lime water seems to decrease the presence of mirabilite in the adobe wall, whereas in the formed wall there is no marked variation in the composition of the efflorescent salts. The difference is not related to variations in the humidity of the room atmosphere, as both walls are in contact with the same atmospheric conditions. However, the data in Table 4 show the influence of atmospheric humidity on the composition of the efflorescences. The so-called samples E (more exterior) crystallised on the samples I (closer to the wall), and it can be observed that in the most external crystals there was a more extensive change from thénardite to mirabilite.
Comparison of ratio (%) of thénardite (Na2SO4) and mirabilite (Na2SO4⋅10H2O) in efflorescences present in formed wall and adobe wall before and 15 days after painting with lime water.

The harmful effect resulting from the crystallisation of sodium sulfates in porous materials is well known. A large number of articles on this subject have been published (Rodriguez-Navarro et al., Reference Rodriguez-Navarro, Doehne and Sebastian2000; Gonçalves, Reference Gonçalves2007; Steiger and Asmussen, Reference Steiger and Asmussen2008; Camuffo et al., Reference Camuffo, Bertolin, Amore, Bergonzini, Brimblecombe, Degrigny and Cleaver2010; Shahidzadeh-Bonn et al., Reference Shahidzadeh-Bonn, Desarnaud, Bertrand, Chateau and Bonn2020). The problem is associated with the presence and coexistence, under the experimental conditions, of anhydrous (thénardite, Na2SO4) and decahydrate sodium sulfates (mirabilite, Na2SO4⋅10H2O). The data in Table 3 show that, for course of this experiment (temperature 13.5–15°C, and relative humidity 100 p w/p°w in the range 82–89 inside the room) (Table 1), thénardite was the most stable solid phase when 100 p w/p°w < 86, though conditions existed that could promote the change to mirabilite as can be inferred from data in Table 3.
Shahidzadeh-Bonn et al. (Reference Shahidzadeh-Bonn, Desarnaud, Bertrand, Chateau and Bonn2020) studied the effect of crystallisation of sodium sulfate salts in porous materials and observed that the initial addition of a saturated aqueous solution of sodium sulfate and the subsequent evaporation of water did not promote any damage in the host material as a result of thénardite crystallisation. The problem was caused by yet another step of wetting the material. In this process, they observed a rapid formation of mirabilite on the thénardite crystals that had partially dissolved in the humid environment, which promoted the breakdown of the structure of the host material.
The solubility of thénardite in water, at 20°C, is 3.7 mol kg−1, whereas the solubility of mirabilite in water, at the same temperature, is 1.4 mol kg−1 (Steiger and Asmussen, Reference Steiger and Asmussen2008). In contrast, for temperatures lower or equal to 20°C the deliquescence humidity of mirabilite is always for 100 p w/p°w above 95, and the deliquescence humidity of thénardite is in the range of 100 p w/p°w from 85.9 to 86.6 (Steiger and Asmussen, Reference Steiger and Asmussen2008). The molar volume for thénardite is 53.11 cm3 mol−1 and the molar volume of mirabilite is 219.8 cm3 mol−1 (Steiger and Asmussen, Reference Steiger and Asmussen2008).
When the relative humidity of the room atmosphere is 100 p w/p°w > 86–87, the thénardite, which previously crystallised both inside and outside the porous materials, as a result of water evaporation, begins to dissolve in water vapour. However, as mirabilite is more stable under these environmental conditions, and as it is less soluble in water than thénardite, it begins to crystalise from highly supersaturated solutions after thénardite dissolution (Flatt, Reference Flatt2002; Steiger and Asmussen, Reference Steiger and Asmussen2008). The molar volume of mirabilite is more than four times that of thénardite, and the crystallisation of mirabilite from highly supersaturated solutions can originate large crystallisation pressures, exerting very high pressure on the surroundings that overcomes the cohesive forces in the host materials, promoting their disintegration (Flatt, Reference Flatt2002; Steiger and Asmussen, Reference Steiger and Asmussen2008; Shahidzadeh-Bonn et al., Reference Shahidzadeh-Bonn, Desarnaud, Bertrand, Chateau and Bonn2020; Tsui et al., Reference Tsui, Flatt and Scherer2003). During the test period (March 1st to June 26th, 2018) no perceptive variations of rising damp on the walls were observed in the case-study building. Building foundations should only be in contact with saline solutions when there is a rise in the water table, alternating periods of wetting and drying. The formation of mirabilite and the disaggregation of lime mortars and adobe blocks can happen when the temperature and relative humidity inside the room promote the dissolution of the thénardite and the crystallisation of the mirabilite. The results showed that the destruction of the base of the adobe wall is mainly associated with the mirabilite effect. However, regular traditional procedures of annual use of lime water paint on walls can have a positive impact on reducing mirabilite, as shown in Table 3, however only on adobe walls.
These observations provide interesting indications for rehabilitation interventions, because even in a situation where the problem cannot be solved, it may eventually be restricted to a non-visible area, which is the ventilation zone at the base of the wall (in the traditional system of construction).
Application of sacrificial mortar prior to the rehabilitation intervention
A sacrificial mortar is generally a temporary building material that can be removed prior to application of the final rehabilitation mortar. The use of sacrificial mortars can be a way of slowing down the progression of salts or decreasing the amount of salts inside the wall, absorbing more water than the wall material, increasing the amount of salts on the surface of the mortars, which can be removed more easily. Therefore, it is not a way to solve the problem of rising damp associated with the effects of salts, but one of the ways that can be used when rehabilitation conditions are difficult, as is the case here.
The literature has gaps on the problem of the effects of salts on old walls and their resolution in relation to earthen architecture. Experimental investigations have demonstrated that the use of sacrificial mortars could be more effective in decreasing the effects of salts on walls, due to their composition and structure that allows better ventilation and therefore causes a concentration of salts on the surface, from where they can be removed (Derluyn et al., Reference Derluyn, Janssen and Carmeliet2011; Foraboschi and Vanin, Reference Foraboschi and Vanin2014; Fragata et al., Reference Fragata, Veiga and Velosa2016; Husillos-Rodríguez et al., Reference Husillos-Rodríguez, Carmona-Quiroga, Martínez-Ramírez, Blanco-Varela and Fort2018).
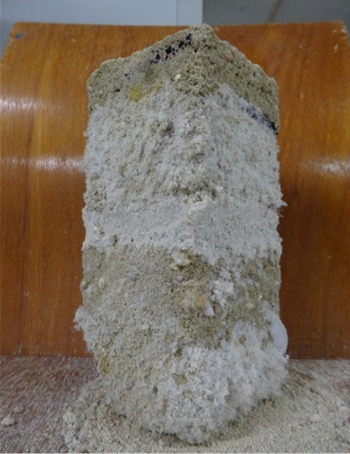
As mentioned previously in the description of samples preparation and characterisation of their properties, laboratory capillarity tests were done with adobe combined blocks (adobe + mortar + adobe) (Figs 8 and 14), using distilled water and an aqueous solution of sodium sulfate ($m_{{\rm N}{\rm a}_2{\rm S}{\rm O}_4} = 1.15\;{\rm mol\;k}{\rm g}^{{-}1})$ , to characterise their behaviour in relation to the progression of water and salts, and salts crystallisation. The main aim was to use air lime mortar with non-calcined diatomite as a sacrificial mortar to minimise the effect of salt efflorescence on both walls of the building.
Adobe combined block (18 × 8 × 8 cm) after capillarity test with aqueous solution of sodium sulfate 1.15 mol kg−1 (© Alice Tavares).

Despite the heterogeneity of the tested material (adobe +mortar + adobe) the absorption of water and aqueous sodium sulfate solution by the adobe combined blocks was rapid. The water front in the adobe combined blocks, as well as the saturation of the blocks by water or aqueous solution of sodium sulfate reached the top of the tested blocks (~18 cm height) after 70 h immersion (~1 cm) in distilled water or aqueous solution of sodium sulfate.
These preliminary tests showed the crystallisation of sodium sulfates on the surface of the mortar, without damaging its structure, from which it could be removed easily. The sacrificial mortar serves as a wall protector allowing the salts to crystallize on its surface without damaging the wall. The test also showed that the mortar was permeable to the aqueous solution of sodium sulfate, which could prevent its accumulation inside the wall of the case study with possibly more destructive effects.
During laboratory capillarity experiments with the aqueous solution of sodium sulfate, as can be seen from Fig. 14, the crystals started to grow immediately above the line of the aqueous solution (~1 cm high). The sodium sulfate salts also crystallised on the mortar and adobe surfaces above the mortar. It was also observed that the adobe was starting to have small fragments coming off, both in the lower block above the level close to the aqueous solution line and in the block above the mortar. A semi-quantitative analysis of the composition of the salts was not carried out, but the deleterious effect of the crystallisation of sodium sulfates in the adobes was clearly visible. Despite the crystallisation of salts on the surface of the mortar, there was no visible damage of its solid structure. Temperature and relative humidity during capillarity experiments were in the ranges of 17.9 to 18.5°C and of 100 p w/p°w of 69 to 81, respectively. For this experimental temperature range, the deliquescence relative humidity of thénardite is ~86.4 for 100 p w/p°w, the deliquescence relative humidity of mirabilite is ~96 for 100 p w/p°w and the equilibrium relative humidity for the mirabilite–thénardite transition is ~75 for 100 p w/p°w (Steiger and Asmussen, Reference Steiger and Asmussen2008).
In Table 3, the data for the solubilities of mirabilite and thénardite show that the aqueous solution of sodium sulfate, used for the capillarity experiments, was close to saturation in relation to mirabilite, under the experimental temperature range. When the sodium sulfate solution starts to rise, by capillarity, in the adobe block, a slight evaporation of water from the surface of the block will be enough to start the crystallisation of mirabilite. Inside the block, if the composition of the aqueous solution does not change, there will be no conditions for crystal formation and the ascent of the solution by capillarity will continue. However, under atmosphere temperature and humidity conditions, thénardite is the thermodynamically stable solid phase. In the laboratory experiments conditions were created on the surface of the block so that the alternating processes of wetting and drying could occur and thus the phase change of sodium sulfates. In the case-study building it was intended to prevent the transformation of thénardite to mirabilite both inside and on the surface of the wall.
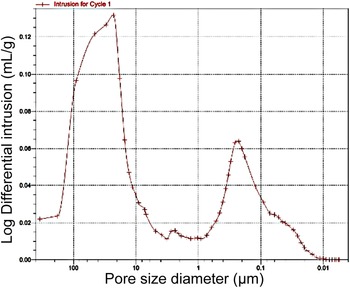
Steiger and Asmussen (Reference Steiger and Asmussen2008) studied the stress generated on the pore surface by the crystallisation of sodium sulfate salts during the drying and wetting stages. Similarly, other authors (Camuffo et al., Reference Camuffo, Bertolin, Amore, Bergonzini, Brimblecombe, Degrigny and Cleaver2010; Flatt, Reference Flatt2002; Shahidzadeh-Bonn et al., Reference Shahidzadeh-Bonn, Desarnaud, Bertrand, Chateau and Bonn2020; Tsui et al., Reference Tsui, Flatt and Scherer2003) observed that the crystallisation of mirabilite was the most important step in breakdown of the material structure. The pore size has a substantial influence on the impact of the crystallisation pressure on the stability of the structures. The influence is very small if pores are > 50–100 nm. The results of the porosimetry measurements of the mortar by mercury intrusion (Fig. 15), showed that most pores were >100 nm. The high porosity and large pore size of the non-calcined diatomite air lime mortar (Fig. 15) could be one of the causes of the crystallisation of sodium sulfates above the mortar and the absence of visible damage resulting from the crystallisation of salts. The porosimetry and capillarity tests aimed to verify, in a real context, if the high porosity of this mortar would be enough for an easy progression of the salts from the inside of the wall to the surface and act as a marker of what will happen after the application of the final plaster.
Result of mercury intrusion porosimetry analysis of mortar sample before capillarity tests (© Alice Tavares).

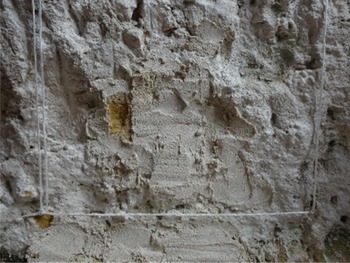
The mortar of air lime and sand with non-calcined diatomite was applied on a square area 30 cm wide, on both walls of the building studied (Figs 16 and 17). After cleaning the walls by brushing they were located in the same areas of the walls where the lime water paint was applied (Figs 6 and 7) and where larger amounts of salts crystallised in Step 2. Mortar samples from both walls were collected seven and ten days after its application and the collection sites are shown in Figs 16 and 17. Visual inspection of the mortar surfaces seven days after its application showed the absence of efflorescences, which was confirmed by XRD analysis of the mortar samples. However, the XRD pattern (Supplementary figs 7S and 8S) showed the presence of some calcium carbonate and calcium sulfate as anhydrite, in addition to calcium dihydroxide and silicon dioxide. Ten days after application of the mortar, the surface of the test area presented the same visual appearance without efflorescence, which was also confirmed by XRD analysis. The X-ray analysis showed, meanwhile, the formation of calcium sulfate dihydrate (gypsum), in addition to a more extensive presence of calcium carbonate.
Sacrificial mortar on the formed wall. Sampling sites are the yellow areas, grid size – 50 × 40 cm (© Alice Tavares).

Sacrificial mortar on the adobe wall. Sampling sites are the yellow areas, grid size – 50 × 40 cm (© Alice Tavares).

The complicated set of reactions, which must occur in the air lime mortar when in contact with aqueous solutions containing sulfates and the room atmosphere, can be represented by the equation:

The mortar used in this experiment, was chosen due to its porosity and capillary properties that predicted the possibility of sodium sulfate migration to its surface, decreasing the possible deleterious effect on the building material. As the in situ mortar experiment had longer contact time with the aqueous solutions containing sulfate ions, this could cause changes in its properties, mainly as a result of the formation of calcium sulfates. The formation of calcium sulfates can decrease the formation and impact of sodium sulfates that are known to have more negative impact on building materials than other salts (Steiger and Asmussen, Reference Steiger and Asmussen2008).
According to Camuffo et al. (Reference Camuffo, Bertolin, Amore, Bergonzini, Brimblecombe, Degrigny and Cleaver2010) the conditions necessary for mirabilite not to be present require 100 p w/p°w < 74 and a temperature <17°C. Steiger and Asmussen (Reference Steiger and Asmussen2008) showed that, under the temperature conditions that occurred throughout all experiments, 100 p w/p°w < 70 should prevent the formation of mirabilite, which was not attained during all experiments. Vacant buildings, without an internal control of temperature and humidity, are prone to more destructive processes similar to those analysed here.
The results obtained will contribute to the establishment of more informed and sustained repair and compatibility actions, within the scope of the rehabilitation of the built heritage.
Conclusions
One frequent cause of the degradation of buildings is the formation of salts on the walls of the built heritage, in places where there is proximity to water courses or where the water table is high. The action of salts on stone masonry has been studied by several authors, especially under conditions created artificially in the laboratory, either with materials produced for this purpose or with materials sampled in situ from old buildings.
The degradation of earthen building materials (adobe masonry and formed masonry with lime mortar) was studied by combining laboratory tests with measurements and experiments carried out inside an earthen architecture building situated next to the coastal Lagoon channel called Ria de Aveiro in Portugal. The hygrometric measurements carried out between the end of winter and the beginning of summer, inside the building with adobe masonry and formed masonry gable walls, showed small variations in temperature (13–21°C) and relative humidities (100 p w/p°w between 73 and 90), which are conducive to the coexistence of the observed thénardite and mirabilite efflorescences that grew on the walls.
Despite chloride being the most abundant anion in seawater, the presence of sodium chloride was not observed in any of the analysed wall samples. It is likely that the temperature and humidity conditions inside the room during the period of this study did not allow for crystallisation of sodium chloride or sodium nitrate. According to data published by Rörig-Dalgaard (Reference Rörig-Dalgaard2021) crystallisation of sodium chloride together with sodium sulfate will occur at 25°C for atmospheres with relative humidity below 74 and for mixtures of sodium chloride, sodium sulfate and sodium nitrate only for much drier atmospheres with relative humidity below 66.
The source of the efflorescences’ salts may be the cement pavement, probably due to the migration of sodium sulfate from the floor to the wall. The XRD analysis of powders from three samples of cement from the floor of the case-study building identified the presence of calcium carbonate, silicon dioxide, feldspars, gypsum and sodium sulfates.
The traditional Portuguese activity of periodically painting the walls of houses with lime water, which was tested in both walls (adobe masonry and formed masonry with lime mortar) of the case-study building, has some influence on the crystallisation of mirabilite by decreasing the amount of mirabilite – more visible on the adobe wall than on the formed wall – but it does not solve the problem.
Laboratory capillarity tests on adobe combined blocks (adobe + lime mortar + adobe), showed the deleterious effects of the crystallisation of sodium sulfates on adobe surfaces and the suitability of non-calcined dolomite air lime and sand mortar as a possible sacrificial mortar to lessen the effects of sodium sulfates on adobe. However, when applied to the two different walls of the case-study building, the possible sacrificial mortar showed a different behaviour as a result of secondary reactions not detected during the laboratory experiments.
The chemical characterisation of the building and mortar materials, as well as the efflorescence salts, allowed the effects of the two possible rehabilitation measures on the progression and phase change of thénardite into mirabilite to be identified. It also highlighted the importance of measuring hygrothermal parameters in the laboratory and in the building. The building's internal environment impacts on the results. The comparison between the laboratory results and those from the experiments done inside the building shows the importance of conducting in situ experiments to evaluate the effect of rising damp. The information obtained through laboratory capillarity tests, may be insufficient for the complete characterisation of the most complicated natural processes.
The in situ experiments allowed a better understanding of the exact effect of a traditional action to preserve the walls, such as the application of lime water and a preparatory measure for rehabilitation using sacrificial mortars with pozzolan. It was evident that it is important to control, fundamentally, the relative humidity of the air inside the house, to avoid formation of mirabilite. Combining the experimental results with published research on the crystallisation conditions of thénardite and mirabilite, and the transition from one solid phase to another, it can be concluded that to prevent the formation of mirabilite from equilibrium with thénardite at the temperatures measured inside of the building, the relative humidity of the internal atmosphere had to be 100 p w/p°w < 70. It is not the formation of thénardite that causes the greatest disaggregation of the support material (adobe block and wall), but the temperature and air humidity conditions that allow the dissolution of thénardite and the formation of highly supersaturated solutions with respect to mirabilite from where it will crystalise.
These are important data for rehabilitation that provide information for cases of aggressive damage to walls by sodium sulfate salts. It is possible to control the environmental conditions to avoid those conditions that allow the phase change of these salts and thus minimise their surface occurrence, damaging paints and plasters.
Supplementary material
To view supplementary material for this article, please visit https://doi.org/10.1180/mgm.2022.51
Acknowledgements
Alice Tavares thanks the FCT – Fundação para a Ciência e Tecnologia for postdoc research support (2021.03830.CEECIND), as well as CICECO-Aveiro Institute of Materials, POCI-01-0145-FEDER-007679 (FCT Ref. UID /CTM /50011/2013) of University of Aveiro in Portugal, financed by national funds through the FCT/MEC and when appropriate co-financed by FEDER under the PT2020 Partnership Agreement. Thanks also to the project Linking Landscape, Environment, Agriculture and Food Research Centre (UID/AGR/04129/2020) financed by the FCT/MEC through national funds, co-financed by FEDER within the PT2020 Partnership Agreement.