Though comparisons of the economic situation between China and West Europe can be traced back to Adam Smith,Footnote 1 they have only recently become a hotspot of research. Twentieth-century scholarship's conventional wisdom is that the Chinese people, in particular the peasantry, had lived at a “minimum subsistence level” of living for centuries before the 1949 Revolution.Footnote 2 To be sure, this trope was questioned by some leading historians who suggested that the Chinese peasant lived quite well in the late imperial times when compared with their counterparts in the major countries of early modern Western Europe.Footnote 3 Yet, little attention had been paid to the question how large or small the differences in income per capita and in economic welfare were between China on the one hand, and Western Europe on the other. Kenneth Pomeranz’ The Great Divergence vigorously contested the standard picture that by the eighteenth century there were large differences between these two parts of Eurasia. His argument built, amongst others, on the detailed research that had been carried out by scholars of the Yangzi delta. One of the most important points made by Pomeranz was that scholars before him tended to compare regions of very dissimilar sizes: China was often measured against the most advanced parts of Western Europe (England in particular). Within China, a continent-sized country, there were huge disparities in level of economic development and of economic structure. Much the same can be said about differences between England and many other parts of Europe, for example, Poland or Sicily. When comparing like with like, e.g., England with the most developed part of China, the Yangzi delta, the income gap in his view more or less disappeared. He then concluded that in the “Great Divergence” originated in the nineteenth century, and that before 1800 China and Europe, or England and the Yangzi delta, were rather similar in terms of economic performance.Footnote 4
This revisionist interpretation of the income gap between the two different parts of Eurasia contrasted sharply with the “orthodox” view that had held before. The standard account stressed the continuity of European development before 1800, and the fact that a gap in terms of GDP per capita between Europe and China had already emerged in the early modern period. This had been implicit in the writings of David Landes, Eric Jones, and others on the subject, and made explicit by Angus Maddison's estimates of GDP per capita in the world economy.Footnote 5 He arrived at the conclusion that GDP per capita in Western Europe in 1820 was probably double the level of China, a gap that according to his estimates emerged largely between 1500 and 1800.Footnote 6 For these scholars, the difference between China and the United Kingdom or Netherlands was even larger: Chinese GDP per capita was perhaps only a third of that of the most prosperous parts of the Western Europe. Yet the evidentiary basis for this position was thin at best.
The revisionist views of Pomeranz and other China specialists also suffer from lack of supporting data. Their conclusions have been criticized by a number of scholars working on different aspects of the China-Europe comparison. The evidence presented by Pomeranz was perhaps rather impressionistic—it related to consumption of certain goods (sugar, cotton), not to an integral measure of real incomes, or real wages, and was therefore not fully comprehensive.Footnote 7 A number of papers have been written since focusing on the comparison of real wages between China and Europe. Allen et al. concluded that in the eighteenth and nineteenth centuries, there was a large gap in the purchasing power of real wages of unskilled laborers between, on the one hand, the most advanced parts of Europe—Flanders, Holland, and England—and different parts of China (Canton, Beijing, and the Yangzi delta) on the other hand.Footnote 8 Similar work on India and Japan confirms this picture—also in those parts of Asia real wages were much lower than in the North Sea area.Footnote 9 The difference in wage levels between China and the rest of Europe—in Italy or Germany—were rather small, however; Chinese (and Japanese and Indian) laborers were all very close to the subsistence levels—“the bare-bones basket”—that was reconstructed in the Allen et al. paper.Footnote 10 In the eighteenth century, the real income gap in the world economy was not between Europe and Asia, but between east and south Asia and south and central Europe on the one hand, and the Low Countries and England on the other hand. This began to change during the nineteenth century, however, as large parts of Europe began to profit from industrialization processes, as a result of which real wages went up—but the same development did not occur in China (or India).
Real wages are often used in (European) economic history as an index of the standard of living. They are obviously also related to the (marginal) labor productivity in large parts of the economy; when the focus is on unskilled laborers, the real wage probably reflects labor productivity. The underlying assumption is that a large part of the labor force is wage earners, and/or that labor markets are so widespread that wages more or less reflect the opportunity costs of other (male) activities. It is clear, however, also in the European case, that trends in real wages do not necessarily reflect trends in real incomes per capita—due to changes in labor inputs, perhaps related to the “industrious revolution.”Footnote 11 In China (and Japan), labor markets were probably less widespread and more marginal in the economy at large, which may distort the comparison based on real wages.Footnote 12
Another approach to evaluating differences in income and output per capita is to measure productivity levels in a single sector, such as agriculture. In his analysis of levels of agricultural productivity of the English Midlands and the Yangzi delta, Allen confirmed the revisionists claim that differences in labor productivity between these very advanced regions were quite small. In fact, land productivity in this part of China was much higher than in any part of Europe, and labor productivity was almost on par with the—by European standards—very high level of the English Midlands.Footnote 13
In this article, we try to measure the economic performance of one of most developed parts of China, the Hua-Lou area,Footnote 14 part of the Yangzi delta relative to one of the most developed part of Western Europe, the Netherlands. For the period 1823–1829 one of the authors has made detailed estimates of the structure and level of GDP in Hua-Lou. These are the first pillar of this article. The other pillar are the comparable estimates of GDP of the Netherlands after 1807, published by J.P.H. Smits, Edwin Horlings, and Van Zanden, the result of a large research project into economic growth in the Netherlands in the nineteenth century.Footnote 15 This article presents these two sets of estimates, adds PPPs, to make it possible to compare in some detail the economic structures of these two highly developed parts of Eurasia. Moreover, for key sectors of the economy—agriculture, textiles, printing, and transport—we also try to explain the patterns in relative productivity found. We demonstrate, for example, that the structure of labor productivity in the different sectors of the economy in China (the Yangzi delta) and the Netherlands differed a lot. In the Netherlands, we find the “usual” pattern of high labor productivity in services, medium levels of productivity in industry, and low productivity in agriculture (although the differences are rather mild in international comparative context). One of the main results of our analysis is that this pattern does not occur in China, where labor productivity in agriculture was much higher than in large parts of the industrial sector. This special feature of the Chinese/Yangzi economy helps to explain the paradox that, on the one hand, differences in real wages between the two economies are large, whereas in terms of labor productivity in agriculture the gap is very small.
We chose these two regions because they were both highly developed parts of their respective Chinese and European economies as their high levels of urbanization testify. In Hua-Lou in the 1820s, 39 percent of the population of 560,000 lived in towns and cities (with more than 1,500 inhabitants), of which about 170,000 in the largest city, Songjiang City (which was the capital city of Songjiang Prefecture and is now a satellite town of metropolitan Shanghai). In the Netherlands, the level of urbanization was similar at 35 percent; of the 2.5 million inhabitants about 220,000 lived in the capital city, Amsterdam, the rest of the urban population of some 800,000 was distributed over a large number of small and big towns. They also shared a common geography: the Netherlands is located in the delta of the Rhine and the Meuse rivers, the Hua-Lou area is part of the Yangzi delta and the Huangpu River run across the area. Both regions were low-lying, relatively flat, with many waterways and easily accessible for (cheap) water transport. Thus how to manage the water system was an important issue in the two regions. Each relied on different institutional solutions: in the Yangzi delta, the local governments and local communities led by elites, mainly the “gentry,” were working together in managing the water system; in the Netherlands, specialized institutions—the waterboards—took care of this job. Heavy, alluvial soils, which were difficult to work, but potentially highly productive, were another common feature, although these clay soils covered only about half the Netherlands.Footnote 16 Both regions were gateways to large hinterlands a fact that promoted employment in (water) transport, trade, and banking. Such activities help explain the high level of urbanization. Population density in the Yangzi delta was however much higher than in the Netherlands: about 900 people per kmFootnote 2 versus 65 in the Netherlands. Finally, both regions were highly commercialized, implying that a very large part of total output entered the market; Bozhong Li, for example, estimated that 80 percent of output and 67 percent of consumption was bought and sold at the market.Footnote 17 For the Netherlands, we do not have similar estimates, but the level was probably as high (for example, a large part of the staple food was imported from the Baltic).Footnote 18 Moreover, even if labor or capital markets were more extensive in the Netherlands than in the Yangzi delta, it can be argued that such differences do not matter much for the effects markets had on economic decision making by households.Footnote 19
We focus on the 1820s because this is the first period for which we have sufficient data on income and output levels in Hua-Lou district to reconstruct the regional GDP. Moreover, as a test of the Maddison estimates, the 1820s also make sense because his first comprehensive figures for the world economy relate to 1820. The Great Divergence debate, however, concerns relative income levels during the eighteenth century, before the Industrial Revolution.
The economy of the Yangzi delta did probably contract after about 1820 due to a crisis in the cotton industry; we will try to estimate the consequences of this. But the Dutch economy also did not do well in the decades before 1820, and in particular the years of the French occupation of the country between 1795 and 1813 were very difficult. It is therefore unlikely that the income gap that we find is caused by developments after 1780, but due to the absence of time series of GDP for (parts of) China, we can only speculate about trends before the 1820s.
This reconstruction of the economic disparities between Hua-Lou and the Netherlands wishes to establish a number of things: (1) How large were the differences in income per capita between the two regions? Pomeranz's view is that in the mid-eighteenth century this was probably to be close to zero, whereas Maddison would expect relatively large differences (say in the order of two to one); we can, however, only measure this for one benchmark period, the 1820s, and will only very tentatively speculate about these differences during the eighteenth century; (2) What were the main differences in economic structure and level of productivity between these two advanced economies? (3) Can this help to explain the divergent development of the two regions, the Netherlands and the Yangzi delta (more specifically Hua-Lou district)?Footnote 20
One caveat should be added here. GDP per capita measures the capacity of a country or region to produce commodities and services. In the long run, it is linked to the welfare of the population, but this is not a simple, one-to-one relationship, but intermediated by the structure of the income distribution, the relative prices of food versus other commodities, and other variables. To get a full picture of the standard of living of the population of the Netherlands compared with that of the Yangzi delta, one would have to include other measures such as life expectancy, the biological standard of living (heights), income distribution, and literacy, but these are beyond the scope of this article.
THE HUA-LOU ESTIMATESFootnote 21
We chose 1823–1829 because this is the earliest date at which data become available for China and Hua-Lou is one where these data are most abundant. Indeed, as one of the economically and culturally richest parts of China, the Hua-Lou area has boasted abundant local literatures, which contain valuable information on the local economy. To arrive at our estimates of output, we have culled evidence from a many different kinds of sources. These include local histories or gazetteers, agricultural handbooks, and modern field investigations.
A brief introduction is warranted.
Gazetteers
Traditionally, each Chinese province, prefecture, and county, and even some township and village, has kept a record of significant events and data. Compared with those compiled in most other parts of China, the quantity and quality of the gazetteers of the Hua-Lou area are obviously better. The chronicles contain abundant information on the local economy during the late eighteenth and most of the nineteenth centuries. In addition, some information relevant to the Hua-Lou area was found in the gazetteers of the neighboring areas.
Agricultural Handbooks
In the premodern Hua-Lou society, many scholars were keenly interested by local affairs, including the economic situation. They recorded their observations in their writings and the most important of those are “agricultural handbooks.” These dealt directly not only with farming practices, but also other aspects of rural economy. For our study, the most valuable such source is an agricultural handbook entitled Pumao nongzi (Report on agriculture in the Huangpu River and Mao Lake area), which carries both rich and firsthand information of rural economy of the Hua-Lou area in 1823–1834 as well as a considerable amount of quantitative data.Footnote 22
Modern Field Investigations
In the twentieth century, several modern field investigations were made in this area and neighboring areas, both by the Chinese and by foreigners. The major results of the Chinese investigations which relate to this study are available in the 1991 edition of the Gazetteer of Songjiang County and other twentieth-century gazetteers of the neighboring areas. Among the investigations carried out by the foreigners, the surveys made by the Japanese South Manchurian Railway Company in 1937–1941 remain the most precise and detailed body of information available on society and economy of the Hua-Lou area in the first half of the twentieth century.
The data in these sources, however, are far from ideal for the purposes of this study. There are many gaps in the material, both quantitative and qualitative, and much of the information is not particularly reliable. The validity of data for the period of 1820s has frequently been assessed on whether the data is consistent with those from the sources of the earlier and later periods or from the materials of the neighboring areas, and with historical development in the intervening periods and areas, thus, for many issues, comparisons with the data of 1930s, 1940s, and early 1950s are crucial. Yet we also evaluate them based on another obvious criterion: their internal consistency.
The Li study is the first attempt to apply the methods of SNA (system of national accounting) to Chinese economic history prior to the twentieth century.Footnote 23 As often in economic historical research, we do not apply this concept to the nation state, but to a region within such a state for which we have sufficient sources. The “national” (or rather regional) income measured in this way is roughly the same as what is used to measure GDP today. They include the three major approaches—the production, expenditure, and income, with production being the most important. There are some problems, however, when we try to apply these methods in a premodern economy. First, the GDP is the market value of all final goods and services produced within a region in a given year. In a preindustrial economy, however, many activities are nonmarket, but they are still considered as part of national income. Therefore, a value must be calculated even when the goods or services have no actual market price. Second, there are many gaps in the surviving materials, both quantitative and qualitative, which have to be filled in on the basis of evidence from other regions and sometimes periods (see the Appendix for more details). The fact that we could use three supplementary approaches to GDP did help a lot to solve such issues: for the services sector, for example, which was quite important in the Yangzi delta (as in the Netherlands), we had to rely a lot on the income approach based on estimates of wage levels and employment, whereas for the rest of the economy output and income estimates could be made.
On the basis of the data which were obtained from the sources mentioned before, we can estimate the value added of the major sector of the economy of the Hua-Lou area in 1823–1829. Putting these estimates together allows us to compute the gross added value of the area, or the GDP of Hua-Lou in this period. This provides the output (or production) based estimate of output and this result should be tested with the results via the income and expenditure approaches which were made more or less independently (because for the services sector no independent output estimates are feasible). This offers a good test on the consistency of the estimates: GDP according to the output approach was estimated at 13.5 million taels of silver a year, whereas the income-based estimate resulted in 13.3 million taels and 13.9 million taels from the expenditure approach.Footnote 24 Since the differences between the three results are not big, we can conclude that the GDP of the Huating-Lou area in 1823–1829 was around 13.5 million taels of silver a year. Because the population of the area was around 560,000, the GDP per capita was about 24 taels of silver.
THE NETHERLANDS ESTIMATES
We will briefly discuss the estimates for the Netherlands, because they have been presented in detail elsewhere, are available online, and have been widely used for economic historical research.Footnote 25 The results are based on detailed estimates of the output and value added in the most important sectors of the economy.Footnote 26 As checks, the same scholars also calculated GNP and GDP via the income and the expenditure approach, these resulted in estimates of close to the estimates based on the production approach.Footnote 27 The project also produced estimates of the structure of the labor force. More recently, this work had been extended into the early modern period, which has resulted in estimates for the growth of the economy of Holland (the largest and most wealthy province of the Netherlands) going back to the early sixteenth century.Footnote 28
Perhaps a few words about the margins of error of these estimates—both the Chinese and the Dutch ones—are necessary. The big advantage of the system of national accounts is that it requires a full coverage of the economy, making it necessary to collect a large set of data and to produce estimates on all aspects of the economies concerned. This means that the estimates of total GDP are probably much less sensitive to the large margins of error that are inherent to all historical work of this nature (due to the lack of adequate national censuses and other sources which directly register the output and income of the country or region involved). The estimates of GDP and its components are based on many dozens underlying estimates of prices, technical coefficients, the inputs of land and labor, etc., which all have relatively large margins of error. If we are allowed to assume that these margins of error are not correlated, the “law of big numbers” will result in final estimates which are relatively robust, because no single estimate dominates the final results, and the margins of error of the many dozens of data points used will have the tendency to cancel each other out. Such estimates are therefore probably less sensitive to mistakes made by the scholars involved than estimates of individual data: of literacy, for example, or the rate of urbanization, or the wage rate. In other words, the method requires the researcher to make the best use of all the information that is available on the economy concerned; another way to interpret the presented results is that it is the best available summary of the state of our knowledge of this historical economy. Moreover, and perhaps more importantly, the output estimates could also be checked with more or less independent information on incomes; for both regions, the differences between the two approaches were relatively small.Footnote 29 Finally, one could also interpret this experiment as follows: revisionists such as Pomeranz have based their reassessment of the economy of China—and in particular of the Yangzi delta—to a large extent on the detailed research published by Li.Footnote 30 By converting his estimates into internationally comparable estimates of GDP, we try to find out what the implications of his research—and of the claims of the revisionists—are in terms of GDP. Was the level of productivity of the Chinese economy indeed as high as has been claimed by the revisionists?
TWO REGIONAL ECONOMIES
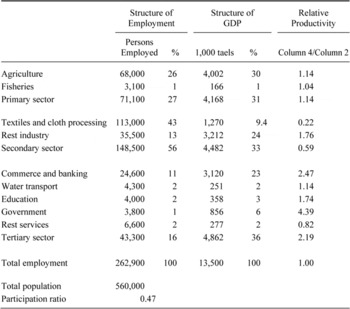
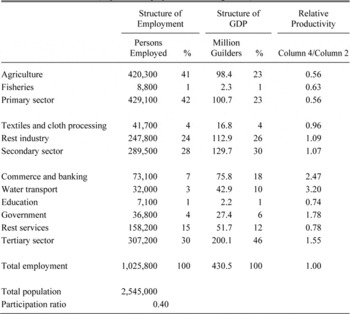
We start with comparing the structures of the two economies (Tables 1 and 2). Hua-Lou had a very modern economy, with only 27 percent of the labor force active in agriculture, whereas this share in the Netherlands was 41 percent. This is a striking result—this part of the Yangzi Delta apparently was a more modern economic structure than the Netherlands. It is one of the paradoxes of Dutch economic development that one of the most important legacies of the Golden Age was a highly productive and export-oriented agriculture. In the 1820s large surpluses of livestock products were sold abroad, in particular to the United Kingdom, and the liberalization of international trade during the 1840s resulted in real export boom to that market, which may even have “crowded out” industrial growth in that period.Footnote 31 In a sharp contrast, the Hua-Lou area was a major importer of agricultural products. Though the area was self-sufficient in food, all the raw cotton used in the prosperous textile industry had to be imported from its neighboring areas, and large amounts of bean cake and bean—a very good fertilizer—were imported as well. Moreover, in Holland, the most urbanized part of the Netherlands, (in terms of its absolute size more similar to Hua-Lou), the share of agriculture was much lower: 21 percent in 1807. This again demonstrates that the unit of comparison is of crucial importance.
STRUCTURE OF THE HUA-LOU ECONOMY, 1823–1829 (in persons employed and 1,000 taels)

Source:
Li, Zhongguo, pp. 219–20, table 9-7, p. 247, table 12-1.
More important, perhaps, is that Hua-Lou was also more industrialized than the Netherlands, with 53 percent of employment in the secondary sector, against only 28 percent in the Netherlands. What has to be added perhaps is that this 28 percent was a bit a low point in Dutch history, the result of deindustrialization of particular Holland in the eighteenth century.Footnote 32 Textiles dominated the industrial sector in Hua-Lou, but this sector was relatively small in the Netherlands—the textile industry had in fact declined in the century and a half before the 1820s (but would reemerge again after about 1830, thanks to subsidized exports to Java). Finally, the services sector was much larger in the Netherlands, which was due to the much larger share of “other services” in employment. This category is a bit of a mixed bag, with, on the one hand, a lot of domestic servants, and, on the other hand, various professionals: notaries, priests and vicars, doctors etc.Footnote 33 Another difference between the two economies is the share of the population in the total labor force (self-employed and wage earners), which was higher in Hua-Lou than in the Netherlands, mainly because of a larger involvement of women (in textiles, as we will see).
STRUCTURE OF THE ECONOMY OF THE NETHERLANDS, 1823–1829 (in persons employed and million guilders)

Source:
Smits, Horlings, and Van Zanden, Dutch GNP.
It is impossible on the basis of the comparison of the structures of these two economies, to assess which economy was more “modern” than the other. The lower share of agriculture in employment suggests that the balance should tip towards Hua-Lou, but a large service sector can also be seen as quite modern (or rather “postmodern”: in most economies a large service sector emerges after manufacturing has peaked in importance).
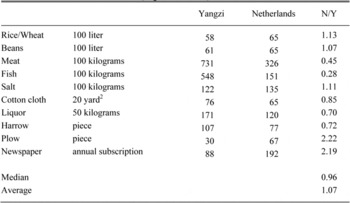
PRICES OF COMMODITIES IN HUA-LOU AND NETHERLANDS, 1823–1829 (in grams of silver)

Notes:
We tried to compare the same of very similar products; in one case, the plow, we compared different kinds of plow, and for both countries focused on the heavy plow pulled by an ox (China) or two oxen/four horses (the Dutch plow).
Sources:
Netherlands: Foodstuffs, salt, cloth, and liquor from data sets national accounts: www.iisg.nl/hpw. Harrow and Plow from Van der Poel, “landbouw-enquête,” vols. 1–2; and Li, Zhongguo, pp. 375–78. Newspaper: Hemels, Nederlandse pers; and Fang Hangqi, Zhongguo xinwen shiye tongshi, vol. 1, chap. 1, sec. 6.
The next step in the analysis is to compare the two economies. We can do so directly in terms of silver. Indeed, from Table 1 we can derive the average income per capita of Hua-Lou of 24 taels, which is 895 grams of silver (one tael (kuping liang, or financial tael) is about 37.3 grams). Table 2 tells us that income per capita in the Netherlands is 169 guilders, the equivalent of 1,620 grams of silver (a guilder consists of about 9.6 grams). At the exchange rate—using ratio between the silver contents of the two currencies, the tael and the guilder as the exchange rate—the per capita income gap between the two regions is therefore 81 percent (the Dutch level is 81 percent higher than the Hua-Lou level).
Using silver however, assume that purchasing power parity holds. Rather than assuming, we construct a purchasing power parity index that reflects the relative purchasing power of the Chinese and the Dutch currencies during the 1823–1829 period. It is an average of the ratio between prices of the same or similar commodities, weighted according to the importance of each commodity in the economies concerned. We were able to collect prices of ten different commodities, ranging from bread grains to newspapers (Table 3). The most important assumption underlying this comparison is that we compared the price of the Yangzi delta's staple food, rice, with that of the Northern European standard food, wheat, using their calories as the basis for comparison.
The comparison presented in Table 3 shows that prices of meat and fish were relatively low in the Netherlands, but that other basic foodstuffs were perhaps somewhat cheaper in China than in Western Europe. Differences in the prices of textiles were small; the British revolution in cotton textiles leading to the “cotton invasion” of the 1820s and 1830s had just started to affect textile prices in the Netherlands and in China. In view of these large scale exports of cotton goods originating from the United Kingdom, cotton prices in Northwestern Europe had probably for the first time in history fallen below those in East and Southern Asia, which is reflected in the price ratio found. We have not found out why a harrow was much cheaper in the Netherlands, whereas a plow was much more expensive there (we checked for different types of plow, and for both regions selected prices of heavy plows, used on clay or similar soils, so quality differences did not play a role). Finally, newspapers were much cheaper in China than in the Netherlands, but the difference was mainly due to the heavy excises on newspapers in the latter country, which lead to a more than doubling of their price.
On average, prices in the Netherlands and in the Yangzi delta did not differ a lot, which is perhaps a surprising result.Footnote 34 This it is more or less consistent with the reconstruction of the value of the “bare-bones” consumer baskets by Allen et al.; their results show that the 1820s were a period of very low prices in the Netherlands, which during this decade fell below the price level estimated for the Yangzi delta. The Allen et al. results also demonstrate that prices in England were much higher than in the Netherlands or in the Yangzi delta, which is again consistent with other work by Allen, who found that agricultural prices in England were higher than those in the Yangzi delta (but he also compared 1800 prices in England, during the peak years of the Napoleonic period, with prices in the Yangzi during the 1820s, when they had gone down quite a lot in both regions).Footnote 35
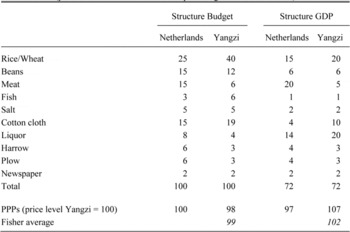
There are a number of ways in which PPPs can be constructed. One can focus on the structure of the budget of consumers only, arguing that one is interested in the (final) purchasing power of the population, because comparisons of GDP per capita are supposed to measure the relative welfare—the ability to buy goods by consumers—of the regions concerned. An alternative approach is to use the structure of the economy as a whole as a weighting scheme, the argument being that one is interested in relative levels of productivity of the two economies concerned, and therefore an integral PPP, which also takes the prices of, for example, investment goods into account, is to be preferred. These two options are presented in Table 4; in both cases, we have tried to establish the stylized structures of the Hua-Lou and the Dutch economy. We had to assume, because of the limited availability of industrial prices, that harrows, ploughs, liquor, and cotton textiles more or less represent the whole range of industrial commodities. Fortunately, the differences between the two approaches are relatively small—less than 10 percent on average—which is not unexpected as consumer demand usually dominates economies. As could be expected, taking budgets from the Netherlands results in a lower PPP (expressed as the ratio between Dutch and Chinese prices), which demonstrates that Dutch consumers tend to concentrate on products which are relatively cheap in the Netherlands (and vice versa, of course: Chinese consumers focus on goods that are relatively cheap there). More surprisingly, the differences in PPP using Chinese or Dutch budgets or structures were rather small.
PPPs FOR HUA-LOU AND THE NETHERLANDS, DIFFERENT WEIGHTING SCHEMES (price level of the Netherlands as a percentage of that of Hua-Lou)

Sources:
See Li, Zhongguo, pp. 363–64, app. 4-14, pp. 377–78, app. 6-2; and Smits, Horlings, and Van Zanden, Dutch GNP.
COMPARISON OF DIFFERENT LEVELS OF LABOR PRODUCTIVITY PER BRANCH/SECTOR, 1823–1829 (Hua-Lou = 100)

Sources:
Tables 1, 2, and 4.
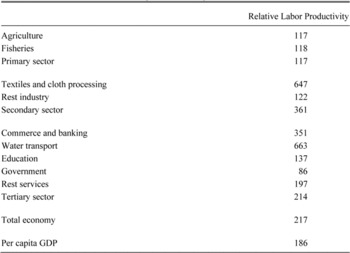
For final comparison of the two economies, we used the Fisher average of the expenditure PPP, which seems most appropriate, but the difference with the Fisher average of the output PPP's is only 3 percent. We can now combine the information from Tables 1, 2, and 4 into comparisons of the level of GDP per capita and per person employed, and of the relative labor productivity of the various branches of the economies. Because PPPs are very close to 100, the estimate of the difference in real per capita GDP is similar (in fact, using the Fisher average of the expenditure PPPs, we get a result that is only 1 percent higher). Because the labor force is a larger share of the population, the difference in terms of labor productivity (per person employed) is larger (Table 5). We conclude at this point that there seems to be a substantial gap in terms of GDP per capita between the two economies concerned. The gap in terms of GNP was probably even larger, as the Yangzi delta was the major source of net tax revenue for the imperial government in Beijing, which resulted in net transfers of income to the north.Footnote 36 The Netherlands, on the other hand, received large net incomes from its overseas possessions and its investment in the (public) debt of other European countries, as a result of which GNP was as much as 10 percent higher than GDP.Footnote 37
We can only speculate about the development of GDP per capita in China and the Yangzi delta in the period before 1823. There is a consensus that the 1820s was a period of depression, due to problems in textiles (see below) and low returns in agriculture. GDP per capita at about 1800 may have been 20–25 percent higher than in the 1820s.Footnote 38 Real incomes in the Dutch economy were also below previous peak levels; it was still recovering from the depression of the 1806–1813 period, when the country was hurt by warfare and the Continental System imposed by Napoleon. Moreover, due to structural problems and competition from the United Kingdom, Holland's economy, after peaking in the 1760s and 1770s, had shown slow but more or less persistent decline since, reducing its GDP per capita also by about 20–25 percent.Footnote 39 The gap we estimate for the 1820s, may have been somewhat smaller in 1800 or 1760, but probably was already substantial at that time, perhaps in the order of 50–70 percent, but due to the absence of time-series estimates of real incomes in the Yangzi delta, we cannot be more precise.
Perhaps even more interesting than the gap in GDP per capita are the differences in the levels of labor productivity in the various sectors and branches of industry. What is the most striking is that in the agricultural sector, the productivity gap is very small indeed, which is consistent with the estimates published by Allen for the comparison between the Yangzi delta and the English Midlands.Footnote 40 By contrast, in the industrial sector as a whole the differences between the two regions are very large, which is entirely due to the extremely low labor productivity in textiles in the Hua-Lou area. Finally, in the tertiary sector, the difference in labor productivity is about average, with a few notable exceptions, such as government, where Hua-Lou seems to be on par with the Netherlands, and water transport, where the difference is again very large. These large disparities in relative labor productivities are already evident from Tables 1 and 2. It is striking that, in Hua-Lou, labor productivity in agriculture is higher than the average for the economy as a whole, and in particular much higher than labor productivity in textiles, whereas labor productivity in services is—as usual—substantially higher than the average. In the Netherlands, we find the “usual” pattern, with agriculture having a relatively low output per employee, followed by industry (which is about average), and services (where income are relatively high). This is the “Kuznetsian” pattern consistent with a positive feedback between economic growth and structural change: a rise in income leads to a transfer of labor from agriculture to industry, which is stimulated by the income gap between the two sectors, and in turn stimulates economic growth as productivity is much higher in the secondary sector.Footnote 41 The different pattern found in the Yangzi delta—the result of extremely high productivity in agriculture in combination with relative low productivity in industry—requires explanation (see below).
In the rest of this article, we will concentrate on explaining these relative productivities, and their consequences for long-term growth. Are these estimates plausible, in view of what is known about production technologies in various parts of the economy? And what may have been the implications for the interpretation of the development trajectories of the two economies involved?
AGRICULTURAL PRODUCTIVITY
One of the striking results of this comparison is the high level of productivity in agriculture in the Yangzi delta; this is not completely unexpected, as Allen's paper on the same subject, also produced very similar results.Footnote 42 These results are confirmed when we construct a PPP index for agriculture only (and ignore the nonagricultural prices of Table 3); we get a PPP for agriculture alone of 85 when using Dutch weights, of 107 when applying Chinese weights; the Fisher average is 95, which is not very different to the PPP we used for GDP as a whole. Applying this partial PPP leads to a somewhat higher relative productivity of Dutch agriculture, but the difference is relatively small.
We can dig somewhat deeper into the structure of productivity by including other inputs into the comparison. The total cultivated area of Hua-Lou was about 60,000 hectares; given the much lower population pressure, it is not a surprise that the cultivated area of the Netherlands was more than 31 times that of Hua-Lou at 1,886,000 hectares. Total value added of agriculture in the Netherlands was only about six times the level of Hua-Lou, resulting in much higher land productivity in the latter region (the Dutch level of land productivity was about 19 percent of the Hua-Lou level). Clearly, land productivity in the Yangzi delta was much higher than in Western Europe.
It is an interesting question to what extent the small difference in labor productivity was linked to differences in the available draught power. E. A. Wrigley has argued that the very high level of labor productivity in English agriculture at the beginning of the nineteenth century was linked to the presence of large number of horses on English farms—in contrast to France, for example, where the supply of horsepower was much more limited.Footnote 43 We estimate that there were about 34,000 water buffaloes in Hua-Lou area, or slightly more than one buffalo per 2 hectare of cultivated land. In the Netherlands, horses were used, but on a much more modest scale: there were probably about 218,000 horses, or about one horse per 9 hectare. Part of the explanation is perhaps that farms were much larger in the Netherlands, making it possible to economize on horsepower. Another part of the story is that probably as much as 50 percent of Dutch farms had specialized in livestock farming, and therefore did not need horses for ploughing, harvesting etc.—horses were in those parts of the Netherlands mainly used for transport. The ratio between horse power and labor force did not differ much, however; in Hua-Lou there were 0.45 buffaloes per person employed in agriculture, the Netherlands had slightly more, 0.52 horses per laborer; the difference between the two in fact almost mirrors the difference in labor productivity.
Finally, we can compare total factor productivity of the two regions involved; we compare PPP corrected value with the weighted inputs of labor, land, and livestock (as a proxy for capital), using a Cobb-Douglas production function with the following share: labor 50 percent, land 35 percent, and livestock 15 percent. Hua-Lou had, if we apply this formula, a level of total factor productivity about 75 percent higher than that of the Netherlands. When correcting for the higher quality of land in the Yangzi delta—the average quality of land in the Netherlands can, following Pieter Buringh, H. D. J. van Heemstra, and G. J. Staring, be estimated to be 66 percent of that of Hua-Lou—this declines to 50 percent.Footnote 44 Other specifications of the Cobb Douglas function (for example, 60 percent labor, 30 percent land, 10 percent livestock) lead to similar results (in this case a 60 or 40 percent gap in total factor productivity respectively).
Agricultural value added per capita in the Netherlands was somewhat higher than in the Yangzi delta: in nominal terms, the difference was 43 percent, and somewhat more corrected for the small difference in price level. This translated in differences in consumption per capita. Meat is perhaps a good guide to this, as in both societies it was a typical luxury product. Li estimated an average consumption of 16.5 kg of meat in Songjiang (the region in which Hua-Lou is located in); for the Netherlands, this estimate is more than double: 35.7 kg per capita (in 1812/13).Footnote 45 This is a sizeable difference, partly explained by the much lower relative price of meat (Table 3), and perhaps also related to the higher income level of the Netherlands. The higher level of output and consumption of agricultural goods in this country appears therefore to be consistent with the estimates of real income levels presented here.
INDUSTRY AND SERVICES
The gap in labor productivity in agriculture was small. By contrast, in industry, and in particular in textiles, the gap was huge. We will first focus on textiles, before moving to the rest of industry and services.
Part of the explanation for the extremely low level of labor productivity in textiles in Hua-Lou is that the cotton industry was severely depressed in the 1820s, the result of a strong decline of cotton prices during that decade. This was the beginning, in fact, of the “cotton invasion,” the flooding of non-European markets by European, mainly English, textiles. At the same time, the bad weather reduced greatly the production of raw cotton in its neighboring areas which were the major sources of raw cotton of Hua-Lou, the prices of raw cotton went up strongly, which in turn led to strong reduction of margins in this sector. If we, tentatively, compare the value added of the 1820s with what was usual before, we get the following picture: prices of raw cotton probably doubled between the 1810s and the 1823–1829 period, whereas the price of cotton cloth fell by 40 percent (from 0.60 tael per bolt to 0.35 tael per bolt.)Footnote 46 Before 1820 the total value added of this sector was probably about twice the level we included in the estimates of GDP, resulting in a much higher relative income in this sector.
Differences in the structure of the labor force also played a role. The textile industry in China was almost exclusively carried out by rural women, whereas their husbands were occupied in agriculture. These women were employed full time in carrying out the major stages of the production process: one day on weaving, another on ginning, fluffing, and sizing, and four on spinning.Footnote 47 This lack of specialization may also have affected labor productivity. Only the final stages of the production process, dyeing and calendaring were carried out by male artisans in firms. In the Netherlands, men dominated the mainly urban textile industry, and the share of women was (only) 28 percent of the total labor force in this sector (data for in 1849, when we have the first detailed statistics).Footnote 48 Dutch textiles mainly consisted of high value-added activities with high levels of regional specialization. Almost all yarn was imported (mainly from Germany). Capital-intensive finishing activities (bleaching, dying, and printing) linked to the international trade of the country dominated the industry. Cotton was already quite important, but the production of linen and woolens traditionally dominated the industry.Footnote 49 The different mix of males and females is therefore linked to a radically different structure of the textile industry.
When we correct for the different structure of the labor force—assuming that relative wages of women were about 50 percent of that of men, and that this reflects relative levels of labor productivityFootnote 50—the labor input in Chinese textiles has to be reduced by perhaps as much as 50 percent,Footnote 51 whereas that of the Netherlands by only 14 percent. When we combine these two corrections—for the crisis in textiles in the 1820s and for the “overrepresentation” of women in this part of the labor force—we get the following results. In Hua-Lou, 56,000 male equivalents produced about 2.4 million taels in spinning and weaving (the estimate of value added before 1820),Footnote 52 which is about 43 taels per “man year.” As for industry as a whole, the average would be 63 taels. Footnote 53 This compares well with the average of 66 taels per man year for the economy as a whole (after these corrections have been taken into account); labor productivity in industry recalculated in this way is 92 percent of labor productivity in the economy as a whole, which is perhaps not implausible.
This also helps to explain the paradox that Hua-Lou was a highly urbanized region with an “inverted” structure of value added per worker, in which labor productivity in agriculture was higher than in industry. Why did people move to the cities when incomes were lower there? For men, real incomes in other industrial activities (besides textiles) and in most services (commerce, banking, education, and government) were higher than in agriculture, creating the “normal” incentive to migrate to the cities (although the differences were not very large, perhaps helping to explain the slow progress made by the process of urbanization). It was the women active in textiles in the countryside who earned the very low incomes. What is therefore striking about the Yangzi economy is that “surplus labor” was not concentrated in subsistence agriculture, but consisted of women's labor in textiles as a cottage industry, carried out by the spouses of the highly productive farmers who were active in the primary sector. This labor was by its nature not very mobile, as it was tied to the farm. Opportunities for moving out of textiles were probably limited—the high value-added activities in industry and services were all dominated by men.Footnote 54
Still, the problem remains why the labor productivity in large parts of industry and in services was so much lower in the Yangzi delta than in the Netherlands. Relative factor costs may have played a large role here, we think. Interest rates in the Yangzi delta, where they were usually around 2 percent monthly issued by pawnshops in the eighteenth and early nineteenth centuries or 0.4–0.8 percent by piaohao on commercial loans and mortgages in the mid-nineteenth century, were probably higher than in the Netherlands, where they varied between 3 and 5 percent annually (on commercial loans, mortgages, and on government debt).Footnote 55 On the other hand, nominal and real wages were lower in the Yangzi delta (and in other parts of China). Nominal daily wages of unskilled laborers in the Netherlands were about 60 percent higher than real wages of long-term hired farm hand in Hua-Lou (0.75 guilders compared with 0.122 tael,Footnote 56 or 7.2 grams of silver versus 4.5 grams). Because the cost of living in the Netherlands were about the same (Table 4), this implies that real wages were also about 70 percent higher than in the Yangzi level. This result is consistent with the estimates by Allen et al. about the wage gap between Western Europe and China.Footnote 57
Relative prices affected, not unexpectedly, capital-labor ratios and the level of labor productivity. Let us give a few examples. In both China and Western Europe there was a large printing industry, catering for the demand for books of a (in both regions) relatively well-educated public. But production technologies were quite different: since the middle of the fifteenth century, Western Europe concentrated on moveable type printing as the most important technology, which was a very capital-intensive process, with high levels of labor productivity. Although this technique was known in China, and was used sometimes in prestige projects sponsored by the emperor and some other persons, most commercial printers preferred to use a more labor-intensive technology, woodblock printing, which was much less capital intensive.Footnote 58 The labor productivity linked to these technologies was different, as can be illustrated using data from Walter H. Medhurst, a Christian missionary, who planned to print the Bible in Chinese in the 1830s. He made a detailed comparison of the production costs of the two techniques. He estimated that producing 2,000 copies of the Bible with woodblocks would cost 1,900 pounds and would take three years to finish the project, during which nine block cutters and five printers and binders had to be employed, whereas with metal moveable type it would take seven workers one year, at a total cost of 1,515 pounds.Footnote 59 That in this specific case—perhaps because the missionary had access to relatively cheap capital—moveable type printing was less costly, is not the point we would like to make. Medhurst's data imply that to make the same 2,000 volumes of the Bible, one needed either 42 men-years when using the woodblock technology, or 7 men-years when using metal movable type. This illustrates the labor productivity gap we find in our estimates about the manufacturing sector.
Because of high wage costs, Dutch entrepreneurs had tried to develop labor-saving technologies. The different solutions the Dutch and the Chinese developed for managing water in both regions are telling examples of the effects that relative factor prices had on technologies. The Chinese, of course, had a good knowledge of windmills, but rarely used this technology. The complex water management systems of the Yangzi delta were almost completely dependent on human power and, on a much smaller scale, on animal power (oxen/buffaloes).Footnote 60 The use of wind power was very limited and man power was overwhelmingly dominated the scene in the Yangzi delta.Footnote 61 The same difference applies to oil pressing, which was a large industry in both regions: the Dutch developed a highly capital intensive windmill technology to press their oilseeds, the Chinese version of this was driven, again, by humans or oxen.Footnote 62
Other examples of technological choices which may be related to different factor prices are found in the transport sector. In both countries, transport along the canals and rivers was a very important part of the economy. In the Netherlands, the system of internal transport used horsepower to pull the barges.Footnote 63 Along the Grand Canal, similar barges were pulled by human labor, which was an important source of employment in the region. A tribute boat sailing along the Grand Canal carried 1,500 shi of rice or equivalent (around 110 tons) on average in the early nineteenth century and was manned with nine sailors.Footnote 64 This implies a ton-per-man ratio of 12. Similar differences existed in international transport. John Crawfurd informs us (writing in the late 1820s), “A Chinese junk is manned with an extraordinary proportion of hands, as compared to European vessels—a circumstance which chiefly arises from the awkwardness of the rudder, the cable and anchor, and the weight and clumsiness of the enormous square sails which are used of. A junk of 8,000 piculs or about 500 tons, requires a crew of ninety men, and the proportion is still greater for vessels of smaller size.”Footnote 65 This implies a ton-per-man ratio of 5.6, and possibly lower on smaller ships. Eighteenth-century data for the Indonesian Archipelago also suggest that the ton-per-man ratio, also on the large Chinese junks, was relatively low.Footnote 66 In Dutch shipping, a ton-per-man ratio of 15 to 25 was already usual in the eighteenth century; in 1830 this had increased to 46 ton per sailor, and 56 tons in 1840.Footnote 67
Factor prices are not the entire story, however. If we look at the government, and at education, it appears that other causes play a role as well. The value added of tertiary activities are measured by the salaries of their employees (it is still impossible to quantify the output of these government officials in a satisfactory way). The fact that Chinese employees in government are more productive than Dutch employees is therefore related to their relative remuneration (see Table 4). The government sector was relatively small in the Yangzi delta, but incomes were relatively high (Tables 1 and 4). By contrast, the Netherlands had a large government sector, dominated by the navy and the army, but also consisting of a relatively large group of civilian state employees, who, however, received relatively low salaries (Tables 2 and 4). The different political economies of the two regions were behind these differences: in China, the state was a major gateway for upward social mobility. Rich merchant families tried to get access to the state via training their children for the state examinations—and once they were in, a high position in government could be a source of even higher incomes.Footnote 68 Dutch civil servants were, on the other hand, paid quite poorly, and so were the soldiers and sailors who manned the army and the navy. Rich merchant families were only rarely interested in badly paid and socially unrewarding careers in public service.
It can also be noticed that the differences in productivity (i.e., salaries per employee) in education are relatively small. Whereas nominal wages of unskilled laborers in the Netherlands were, as we saw already, 70 percent higher than in the Yangzi region, the difference of the salary of teachers was much smaller—close to zero in nominal terms, which points to a relatively large skill premium (teacher/unskilled laborer) in China.
In industry and services, because of the different factor costs, Chinese entrepreneurs applied more labor-intensive and less capital-intensive production techniques, and used less horsepower, wind power, and other capital goods than producers in the Netherlands.Footnote 69 We think that this goes a long way to explain the differences in labor productivity we found in these sectors. Differences in real wages were on the one hand causing these differences in choice of technique, but the capital intensive techniques used in the Netherlands also made it possible to pay the high nominal wages there.Footnote 70 In China, where the same or similar technologies were often well-known (such as the windmill, or movable type printing), relative prices dictated the choice of much more labor intensive production techniques. In terms of total factor productivity, the gap between the two regions was probably much smaller than in terms of labor productivity; as we saw, in agriculture the Yangzi delta even had a much higher level of total factor productivity than the Netherlands (or England).
CONCLUSION
We have demonstrated that it is possible to reconstruct the national accounts of one of the most advanced and highly productive parts of China during the 1820s, and compare the structure and level of GDP and GDP per capita with that of other (more or less comparable) societies, such as the Netherlands in the same period. The results we found were a bit puzzling. On average, labor productivity in the Netherlands in the 1820s is about double the level found in Hua-Lou, the region we concentrated on, and GDP per capita is circa 86 percent higher in this part of Western Europe (the difference being the participation ratio, which is somewhat higher in Hua-Lou). We have suggested a number of explanations for this large difference, which seems to be linked to the fact that real wages in the Netherlands were much higher than in the Yangzi delta, whereas interest rates and capital costs were probably lower. These differences in relative factor costs induced entrepreneurs in the Netherlands to choose a much more capital-intensive technology, with a much higher level of labor productivity. The fact therefore that the Netherlands was part of the area of high real wages in Northwestern Europe, seems to be part of the explanation (although this does of course not explain why real wages were much higher there—but that is another story). There was one, very important exception to this “rule”: agriculture; in the primary sector labor productivity in Hua-Lou was almost as high as in the Netherlands (which is consistent with Allen).Footnote 71 The high quality of the land, the much longer growing season, and the relatively high productivity of rice agriculture, all probably played a role in explaining this. Perhaps even more striking is the fact that within Hua-Lou, labor productivity in this sector was much higher than in the industrial sector, which was entirely due to the low productivity in textiles. Correcting for the depressed state of the textile industry in the 1820s helped narrowing down the difference, but the issue remained that the gap in terms of labor productivity between agriculture and industry was relatively big, even after these corrections have been made. The “labor surplus” in this economy was not concentrated in (subsistence) agriculture (the “usual” pattern in developing countries), but consisted of the labor of women who dominated work in the textiles industry, and were much less productive compared with the men in agriculture. Perhaps the limited gap in “labor surplus” between agriculture and industry was also linked to the political economy of China: agriculture was the main source of taxation and most of the “profit” from agriculture went to the landlord as the rent, whereas rural textile industry was not taxed at all and no rent was required. The returns to labor in agriculture were therefore smaller than the labor productivity of that sector suggests.Footnote 72
Finally, what can we say about the big question raised by Pomeranz about the relative levels of real income in Western Europe and China? Our results show that GDP per capita in the Netherlands was 86 percent higher than in the Hua-Lou area. Moreover, if we accept Maddison's estimates for Europe in 1820, the average level of GDP in Western Europe (excluding Central Europe and Russia) was 1194 dollars (in 1990 dollars), or 65 percent of the level of Dutch GDP in the same year, which was, again according to Maddison, 1838 dollars.Footnote 73 The level of the GDP per capita in Hua-Lou would then be 988 dollars (or 54 percent of the Dutch level), or 83 percent of Western Europe. We do not know, however, the ratio between the real income in this part of the Yangzi delta, and that of China as a whole. Debin Ma has estimated that both in the late eighteenth century and in the 1930s the average real income for the Yangzi delta was about 40–50 percent higher than that of China as a whole (a ratio which, by the way, is almost identical to that between the Netherlands and Western Europe as a whole).Footnote 74 If we apply such a ratio, we get an estimated GDP per capita for China as a whole of 659 to 706 dollars, which is “only” 10 to 20 percent higher than the level estimated by Maddison (which is 600 dollars). These results appear to confirm the view that there existed large differences in GDP per capita between these two parts of Eurasia. Perhaps the gap between the Yangzi and the rest of China proper is smaller (although it was an important point in the debate opened by Pomeranz that there was a substantial gap). One reason for this may be that labor productivity in agriculture was higher than in industry, implying that the more agrarian parts of the country could perhaps have relatively high levels of income. The data on wages that have been published by Allen et al. suggest something similar: nominal wages in the Yangzi delta are not higher than elsewhere, which may mean that also nominal incomes are not higher. The only exception is the north (Zhili, with Beijing), where nominal wages are much higher than in the south.Footnote 75 Perhaps, therefore, the income gap between the Yangzi delta and the Chinese average was smaller than 40–50 percent suggested by Ma.Footnote 76 The results presented here therefore cannot answer all questions related to the relative levels of real incomes of China and Europe in the period before the Industrial Revolution, but we hope that they do shed some light on the structures of the two economies and the determinants of their long-term growth.
Appendix: Data and Sources of the Hua-Lou Study
An important feature of this study is that it makes use of a wide range of materials from many different kinds of sources. We have relied principally on three types of materials: local histories or gazetteers, agricultural handbooks, and modern field investigations.
Gazetteers
Compared with gazetteers compiled in most of other parts of China, both of the quantity and quality of the gazetteers of Huating and Lou counties (Hua-Lou area) and of Songjiang Prefecture (both of the two counties belonged to the prefecture administratively and the three administrative units shared the same city as the prefectural capital and county seats) are obviously better.
Among the 241 gazetteers of different districts, from prefecture to township, under the jurisdiction of the Songjiang Prefecture, the following six were the most important, which contain abundant information on the local economy of Hualou during the late eighteenth and most of the nineteenth centuries:
The 1818 edition of the Gazetteer of Songjiang Prefecture (
 )
The 1884 edition of the Gazetteer of Songjiang Prefecture (
)The 1791 edition of the Gazetteer of Huating County (
)The 1879 edition of the Gazetteer of Huating County (
)The 1788 edition of the Gazetteer of Lou County (
)The 1879 edition of the Gazetteer of Lou County (
)
 )
 )
 )
 )
 )
 )
In addition, information on Hua-Lou is also kept in gazetteers of Hua-Lou's neighboring areas, not just of other counties under the same jurisdictions of Songjiang Prefecture (Shanghai, Fengxian, Baoshan, Qingpu, Jinshan, Nanhui, and Chuansha), but also of counties of Jiading and Chongming (they are under the same jurisdictions of present-day Metropolitan Shanghai), and Suzhou area in the west.
Agricultural Handbooks
The most valuable source of the materials crucial to this study is an agricultural handbook entitled Pumao nongzi (PMNZ,  , A Report on agriculture in the Huangpu River and Mao Lake area) which carries rich and firsthand information of rural economy of the Hua-Lou area in 1823–1834, with a considerable amount of quantitative data.
Modern Field Investigations
In the twentieth century, several modern field investigations were made in this area and neighboring areas, both by Chinese and by foreigners. The major results of the Chinese investigations which relate to this study are available in the
1991 edition of the Gazetteer of Songjiang County and other twentieth-century gazetteers of the neighboring areas. Among the investigations carried out by the foreigners, the surveys made by the Japanese South Manchurian Railway Company (Mantetzu, for short. The full name is  Minami Manshu tetsudo kabushiki kaisha Shanghai jimusho). Koso-sho So-kan ken noson jittai chosa hokokusho in 1937–1941, in particular the surveys on the Hualou area (
 ) in 1940 stands as the most precise and detailed body of information available on the society and the economy of the Hualou area in the first half of the twentieth century.
The data in these sources, however, are far from ideal for the purposes of this study. There are many key gaps in the materials, both quantitative and qualitative, and much of the information is not particularly reliable. We have frequently judged the validity of data for the period of 1820s on whether the data is consistent with those from the materials of the earlier and later periods or from the materials of the neighboring areas, with historical development in the intervening periods and areas. We have also evaluated the 1820s’ and modern data on the basis of their internal consistency, totally apart from the twentieth-century figures.
The following sources were used per sector:
Agriculture: PMNZ, Pumao nongzi.
Fisheries: Mantetzu, (Minami Manshu tetsudo kabushiki kaisha Shanghai jimusho). Koso-sho So-kan ken noson jittai chosa hokokusho. 1941; and PMNZ, Pumao nongzi.
Textiles: Mainly based on the information from Lindsay, Report of Proceedings. Judged on the basis of their consistency with the records of different sources of the preceding and following periods. For the details, see Li, Zhongguo, appendix 4 and chapter 7.
Shilbuilding: Calculated with the price of farm wooden water pumps in PMNZ and the prices ratio of farm pumps and farm boat in Mantetzu 1940. For the details, see Li, Zhongguo, appendix 6.
The tertiary sector and some parts of secondary sector (construction) were calculated with the income approach to which wages are crucial. The major source of the wage of farmers is PMNZ, Pumao nongzi, while the data of the government employees’ salaries are mainly from the 1818 edition of the Gazetteer of Songjiang Prefecture. But the sources of the wage of workers in secondary and tertiary sector are diverse. For the details of the sources, see Li, Zhongguo, appendix 14 and “Wages in Huating-Lou.”