


Introduction
The interaction of a floating ice sheet with a vertical structure may result in either crushing or buckling failure of the ice. Although considerable experimental and theoretical research has taken place to determine the horizontal force which ice exerts on structures in the crushing mode, comparatively few theoretical studies have been conducted to determine the load required to buckle an ice sheet. The objective of this study was to conduct systematic buckling experiments and to compare the results with theoretical results.
When an ice sheet moves against a wide structure such as a beach or artificial island, the ice may fail in bending, crushing, buckling and rubble-forming (Reference KryKry 1980). The possibility of buckling is great when the contact area is non-continuous, i.e. over small regions spaced along the edge of the ice sheet (Kovacs and Sodhi 1981). In small-scale tests on ice ride-up and pile-up, the occurrence of buckling was predominant. Several observations have been reported of the buckling of ice sheets against artificial islands (Reference GladwellGladwell 1977) and in the process of formation of pressure ridges.
The buckling analysis is conducted by treating floating ice sheets as beams and plates resting on elastic foundations. The force offered by the elastic foundation is assumed to be linearly proportional to the vertical deflection of the ice sheet, an assumption that is valid as long as the ice does not submerge completely or emerge from the water. This assumption is adequate for the linear buckling analysis that determines the load for the incipience of instability. A review of the buckling analyses of floating ice sheets is given by Sodhi and Nevel (1980), in which the buckling loads are given for different boundary conditions and geometrical shapes of the ice sheets, e.g. uniform cross-section and tapered beam, semi-infinite and wedge-shaped ice sheets. The buckling analyses of semi-infinite and wedge-shaped ice sheets relevant to this study have been conducted by Sodhi and Kamza (1978), Wanq f19781 and Reference SodhiSodhi (1979).
To the knowledge of the authors, no systematic experimental study has been conducted to verify the theoretical results. Buckling of ice sheets has been observed (Nevel and others 1977, Afanas’yev and others 1971, Hirayama and others 1974) during small-scale tests designed to measure the crushing load of the ice, but a comparison of the measured forces from those studies with theoretical buckling loads is not possible because the values of characteristic length or modulus of elasticity of the ice sheets have not been reported. Wang (1978) attempted a comparison of his theoretical results with the experimental results of Mevel and others (1977) by assuming a range of values for the modulus of elasticity. He concluded that the theoretical buckling loads are higher than the experimental results by about 32% on the average.
Sodhi and Nevel (1980) have shown that the buckling load can be normalized by the product of the Structure width, the square of the characteristic length of the ice sheet, and the specific weight of water. Thus the characteristic length, which expresses the relative magnitudes of the flexural stiffness of the ice sheet and the foundation modulus in terms of a length parameter, is the only ice property needed.
Since the theoretical buckling loads change by orders of magnitude with respect to the width of the structure, the present experiments were conducted with different structure widths relative to the characteristic length.
Experimemtal Procedure
Basically, the experiments were conducted by pushing a floating ice sheet against vertical structures and monitoring the horizontal forces when it buckled.
Each ice sheet was grown by seeding and freezing a solution of 1% urea in water at an ambient temperature of -12°C. The texture of the resulting ice sheet may be described as columnar. Before each test, the room was warmed, and the ice temperature was allowed to stabilize at 0°C.
Before experiments were conducted, the characteristic length of the floating ice sheet was determined by placing dead weights in discrete increments and monitoring its deflection. This procedure gives consistent results, and it is described in detail by Sodhi and others (1982).
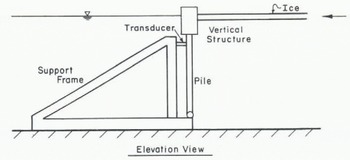
The structures employed had widths of 89 mm, 305 mm and 1.83 m. Figure 1 shows the test set-up for the narrow structures (89 mm and 305 mm) and Figure 2 for the wide structure (1.83 m). During one experiment, the ice sheet buckled against the pusher, which was 2.44 m wide, while the load was being monitored at the other end of the ice sheet.
Schematic sketch of test set-up for structures 89 and 305 mm wide.
Schematic sketch of test set-up for structure 1.83 m wide.
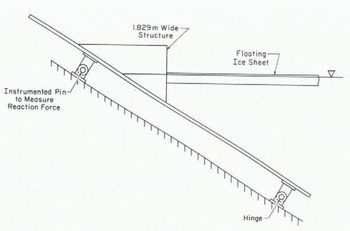
The load was measured by an instrumented support and recorded in digital and analogue forms. The peak force was taken to be the buckling load.
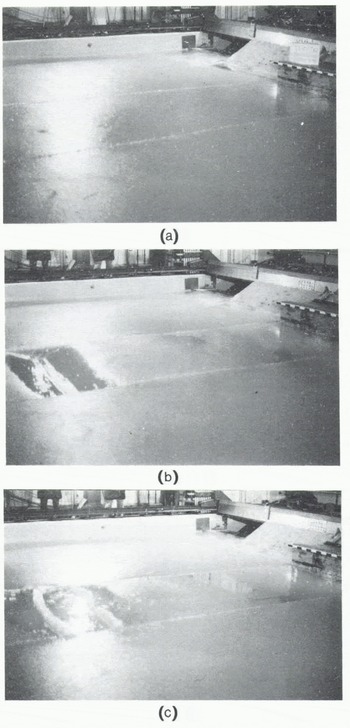
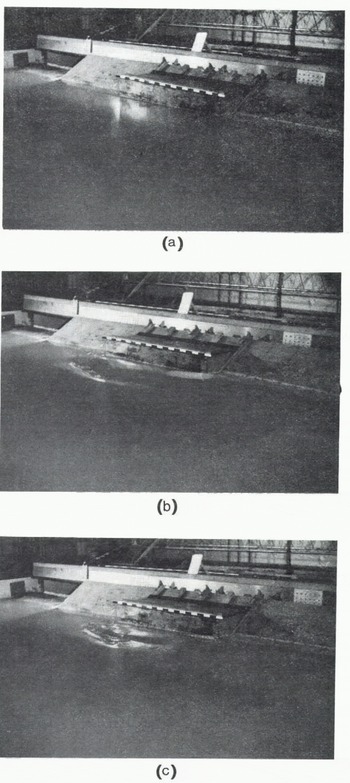
The edge of the ice sheet was sawn parallel to the structure to ensure uniform contact. In five experiments with the wide structure, two slots were sawn parallel to the direction of ice movement and 1.83 m apart, as shown in Figures 3 and 4. These slots allowed the simulation of buckling of an ice sheet against an infinitely wide structure. The ice sheet between the slots behaves as a beam on an elastic foundation. The unslotted ice sheet is a semi-infinite ice sheet as shown in Figure 5.
Photographs showing buckling of a long beam (a) before, (b) during, and (c) after the experiment. Black and white markings are 10 cm long.
Photographs showing buckling of a short beam (a) before, (b) during, and (c) after the experiment. Black and white markings are 10 cm long.
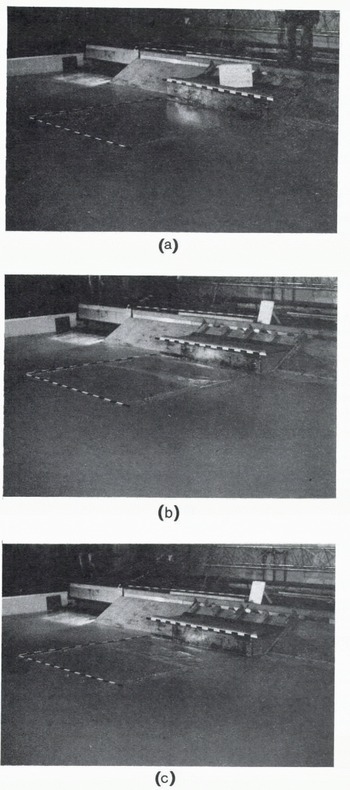
Photographs showing buckling of a semi-infinite ice sheet against a structure 1.83 m wide (a) before, (b) during, and (c) after the experiment. Black and white markings are 10 cm long.
When experiments were conducted with narrow structures (89 mm and 305 mm) the speed of the ice sheet was increased at a constant rate from 0 to 10 cm s_1. The ice sheet failed many times in crushing and buckling. While tests were being conducted with the wide structure (1.83 m), the speed of the ice sheet was held constant (≈ 1 to 5 en s−1), and the experiment was stopped as soon as the ice sheet failed once in buckling.
Each experiment was photographed and recorded on video.
Results and Discussion
(a) Buckling load
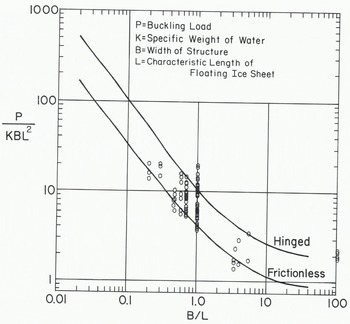
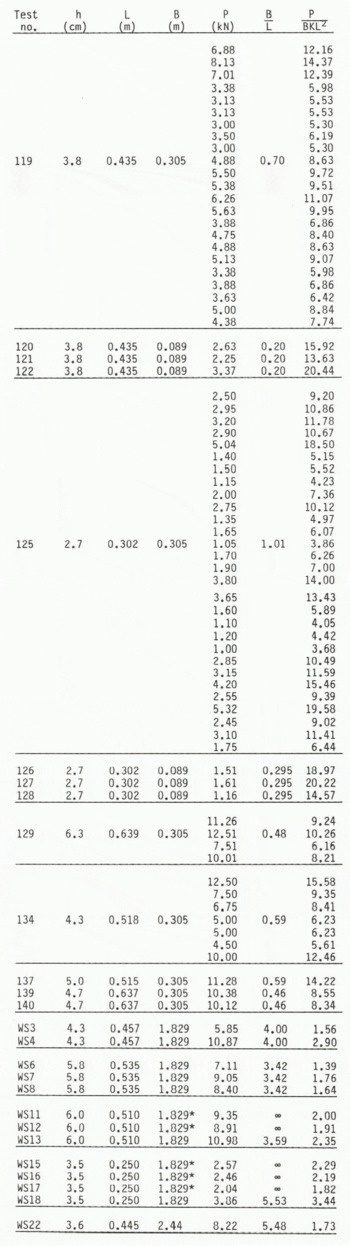
The results of the experiments are given in Table I. The normalized buckling load (P/BKL2 where P is the buckling load, B the width of the structure, K the specific weight of water, and L the characteristic length of the floating ice sheet) is plotted with respect to the ratio of structure width to characteristic length in Figure 6. In the case of the structure of width 89 mm, the mode of failure was mostly crushing, but there were some buckling failures at low speed. However, the failure of the ice sheet against the structure 305 mm wide was mostly in buckling, although with some crushing. The dataset in Table I and Figure 6 represents the peaks in a force record that are known to be caused by buckling failure.
Comparison of theoretical and experimental results. Heavy lines: theoretical results (Reference SodhiSodhi 1979), hexagonal rings: present study.
DATA OBTAINED DURING BUCKLING EXPERIMENTS (h: ice thickness, L: characteristic length of floating ice sheet, B: width of structure, P: buckling load) (Note: for experiments where multiple buckling loads are reported (test nos. 119, 125, 129 and 134) the are in order of increasing velocity (0 to 10 cm s- ).)
The theoretical buckling loads (Reference SodhiSodhi 1979) of a semi-infinite ice sheet are also plotted in Figure 6 for frictioriless and hinged boundary conditions at the ice/structure contact. In our experiments, a frictionless boundary condition may be considered as one for which no frictional resistance is developed between the ice edge and the structure when the ice sheet moves or deflects in the vertical direction. A hinged boundary condition requires complete restraint of the ice sheet against vertical deflection at the line of contact with the structure. Since the ice sheet was free to rotate at the edge, there was no bending moment applied at the boundary. These two boundary conditions represent the extreme situations in our experiments, as there was no control over the boundary condition at the ice/structure interface. The scatter in the experimental result may be attributed to the variability of the boundary condition at the ice edge and partly to variations in the ice speed. As most of the experimental data points in Figure 6 are between the theoretical buckling-load curves for the two boundary conditions, the agreement between the theoretical and experimental results is considered to be good.
The results of the experiments with parallel slots (Figs.3 and 4) are plotted on the right-hand side of Figure 6 as these represent the buckling load for an infinitely wide structure. The edge of the ice sheet in contact with the structure was observed not to move up or down which means that the boundary condition can be said to be hinged. The theoretical buckling load (P/BKL2) of long, floating ice beams with a hinged boundary condition is 2 (Reference HetenyiHetenyi 1946: chapter 7, Sodhi and Nevel 1980) and the five experimental data points are very close to 2.
Since the urea ice used in our experiments was relatively ductile, no cracks were observed to emanate near the structure before buckling of the ice sheet. After the buckling failure, circumferential and some radial cracks were observed within the damaged area.
(b) Mode of buckling
The buckled shape of the ice sheets was not measured. However, a qualitative assessment of the mode of buckling can be made from the photographs in Figures 3, 4 and 5.
The beam in Figure 3 was about 6 m long, and four half-waves of the buckled beam can be seen in Figure 3(b) and (c) (test no. WS12). This corresponds to the length of a half-wave equal to about 1.5 m. This compares well with the theoretical value of π times the characteristic length (≈> π × 0.51 m ≈ 1.60 m).
The beam in Figure 4 (test no. WS16) is short (≈ 2 m) and the buckled shape of the beam is not as simple as in the case of a long beam.
The buckled portion of a semi-infinite ice sheet, shown in Figure 5 (test no. WS18), is in the vicinity of the structure in accordance with the theoretical mode of buckling (Sodhi and Hamza 1978, Reference SodhiSodhi 1979). However, the area of buckled ice sheet in Figure 5 is limited in contrast to the large area of beam affected by buckling (Figs.3 and 4).
Summary
Floating ice sheets were pushed against vertical structures of different widths to determine the buckling load of the ice. The characteristic length of the floating ice sheet was determined to enable a comparison to be made between theoretical and experimental results.
The boundary condition at the ice/structure interface was not controlled, and the actual boundary condition during the experiments represents a situation between frictionless and hinged boundary conditions. The normalized experimental buckling loads have a scatter, but most of the data points are within the theoretical values of the normalized buckling load for frictionless and hinged boundary conditions. Thus the agreement between the theoretical and experimental buckling loads is considered to be good.
There is a qualitative agreement between the theoretical and experimental buckling modes of ice beams and semi-infinite ice sheets.



