





Introduction
Dicamba, a systemic herbicide used for selective control of broadleaf (dicotyledonous) weeds, was historically applied mainly as a preemergence herbicide in many crops or in early postemergence in corn (Zea mays L.) due to monocotyledons’ natural tolerance to auxin mimic herbicides (Cobb and Reade Reference Cobb and Reade2010). Starting in 2017, low-volatility dicamba products were first approved for postemergence use in dicamba-tolerant (DT) soybean [Glycine max (L.) Merr.] and cotton (Gossypium hirsutum L.) (USEPA 2026). Growers benefited from the availability of this postemergence weed control tool, as some of the hard to control weeds (e.g., waterhemp [Amaranthus tuberculatus (Moq.) Sauer]) have become increasingly resistant to other herbicides (Baek et al. Reference Baek, Bobadilla, Giacomini, Montgomery, Murphy and Tranel2021). As a result, between 2017 and 2020, dicamba use in soybean increased significantly and, at its maximum, was applied on approximately 13.6 million soybean ha in 2020 (USDA-NASS 2025). However, by 2023, dicamba use in DT soybean declined to approximately 9.7 million ha per year (USDA-NASS 2025).
This rise and fall of postemergence dicamba use in tolerant soybean is partly due to incrementally restrictive labels that were approved by the U.S. Environmental Protection Agency (USEPA) in response to alleged claims of off-target movement and complaints of visual symptomology on non-target crops, primarily on conventional and non-DT soybeans (USEPA 2018, 2020). The approved labels in 2020 required, in addition to previous restrictions, increased downwind spray drift and omnidirectional volatility buffers and the addition of a volatility-reducing adjuvant for every spray application (USEPA 2020). While these increased restrictions can serve to significantly limit the already-low off-target movement potential of these dicamba herbicides, two other concurrent uses without the same restrictions have continued.
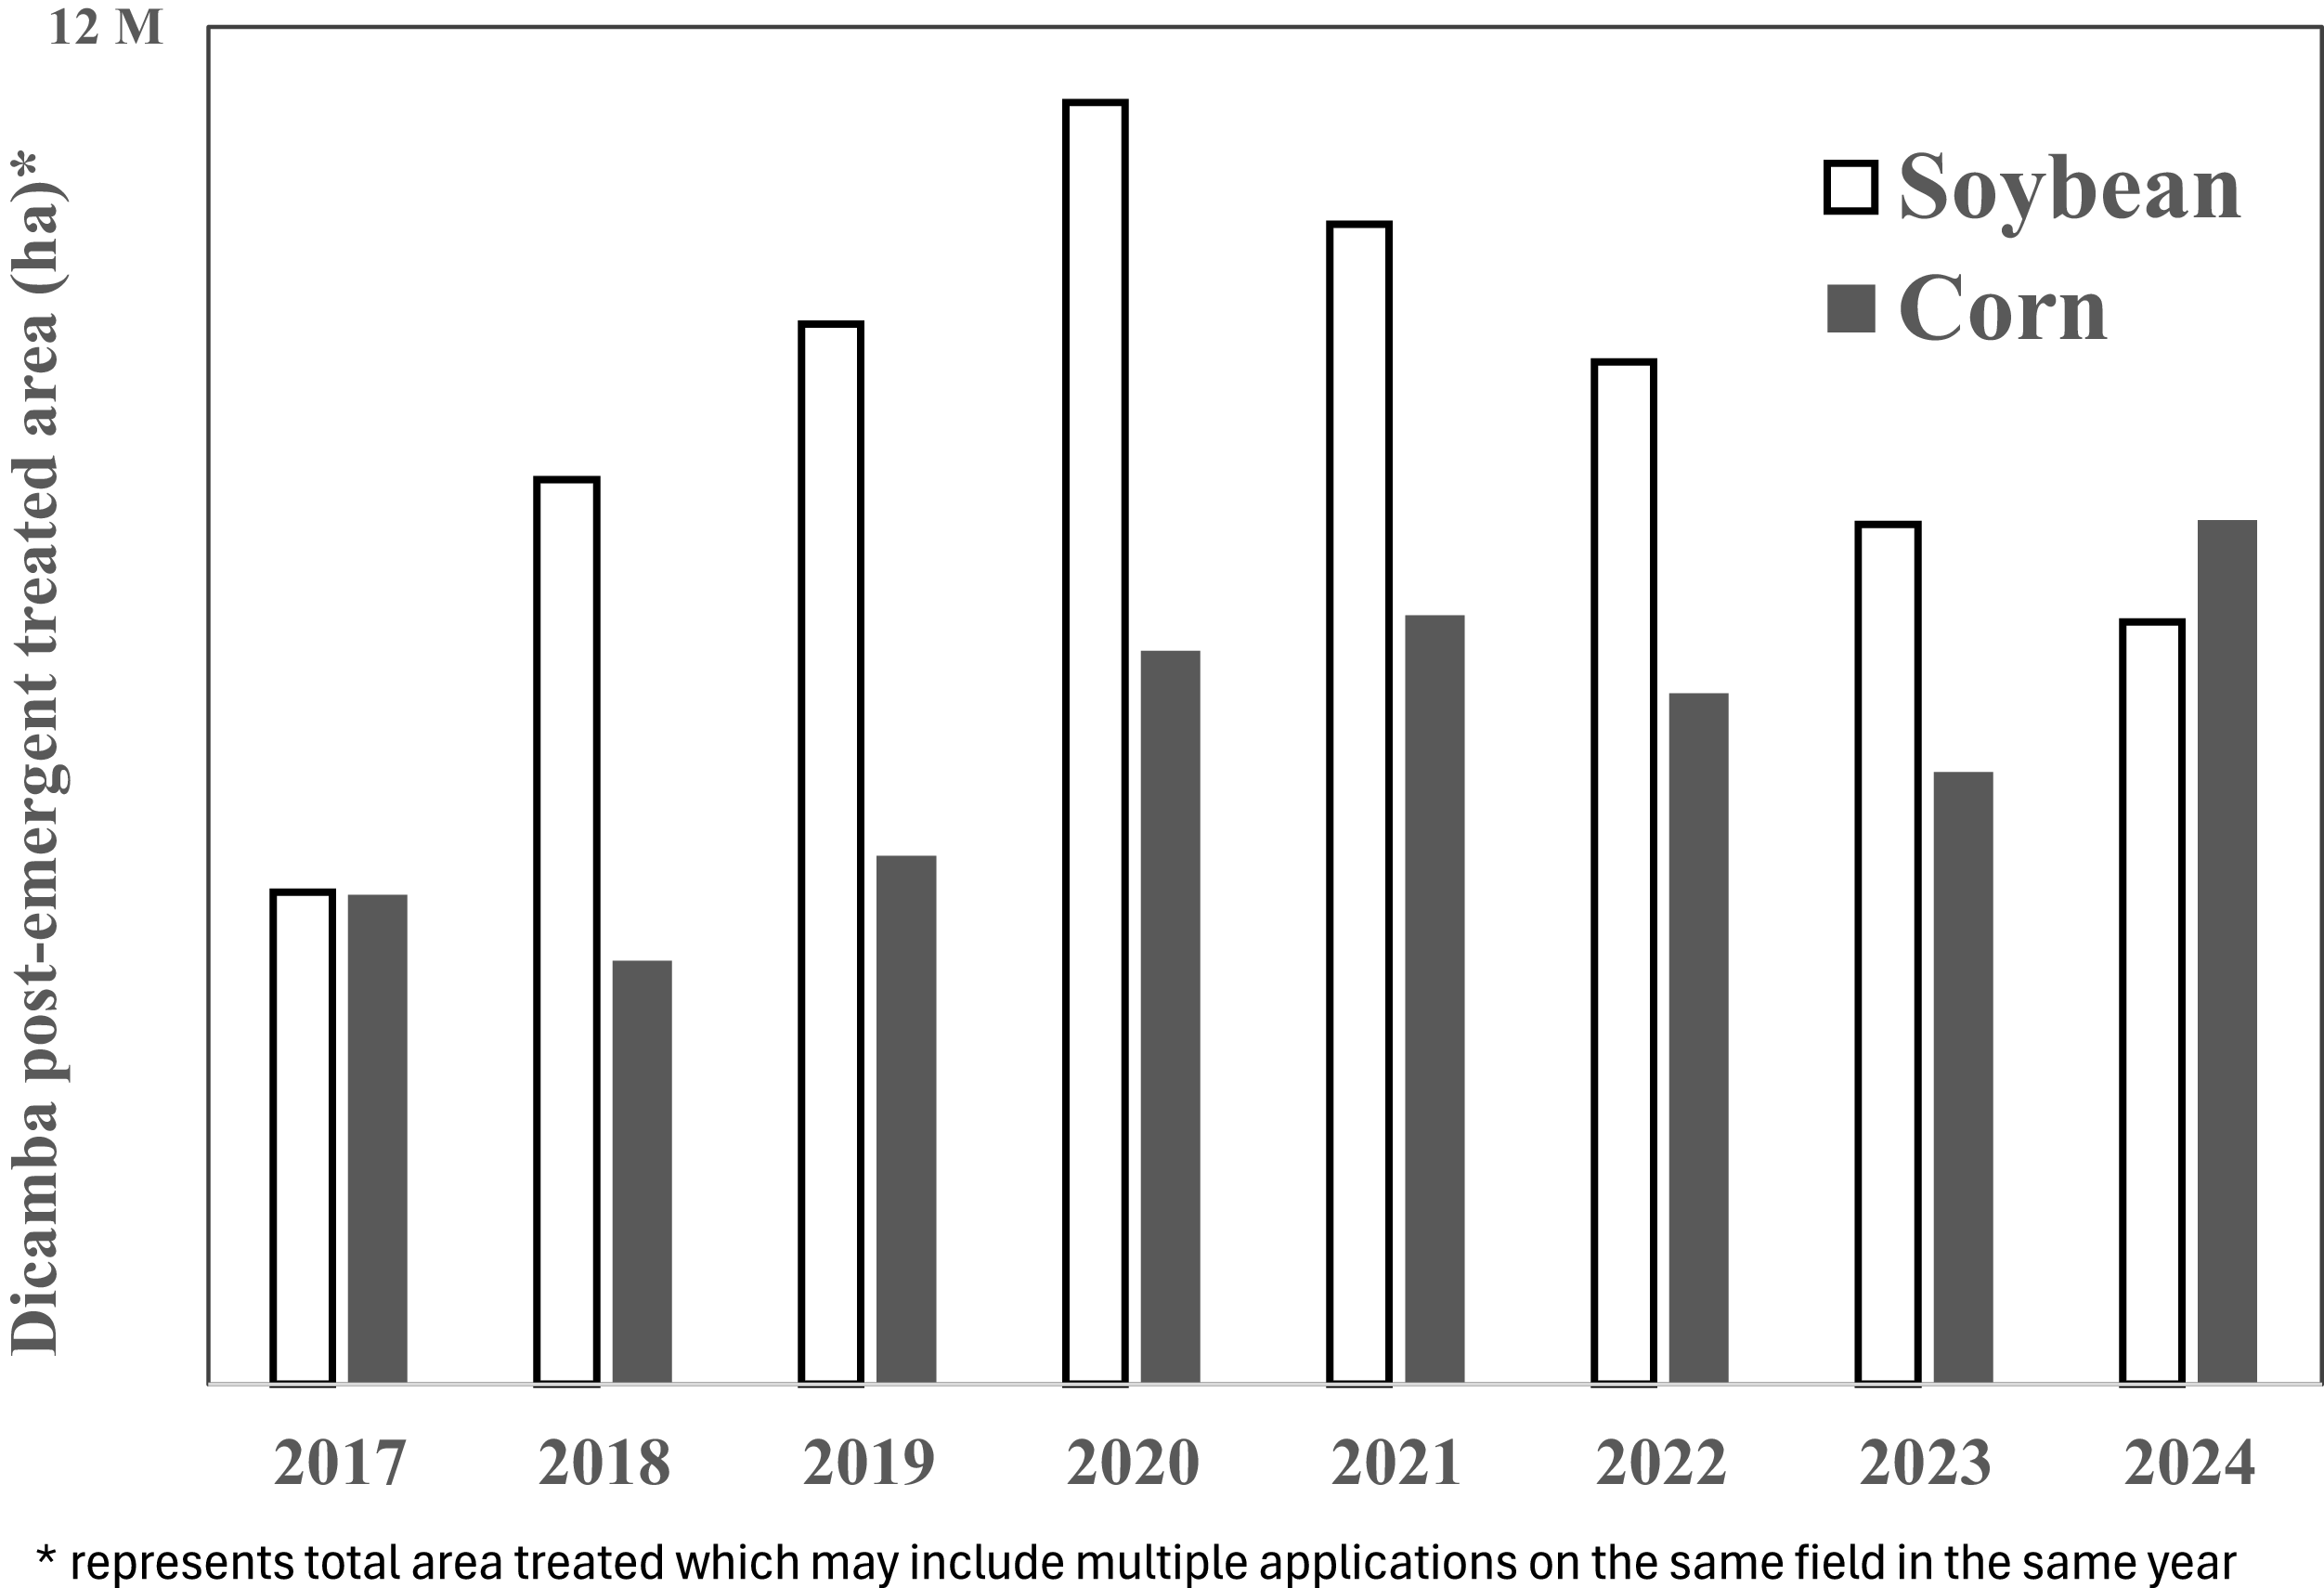
The first use of dicamba concurrently used with postemergence broadcast to DT crops evaluated in this paper is related to corn production. In the midwestern United States, corn and soybean are often grown next to each other, as this is a common crop rotation practice. The seasonal use of dicamba in corn temporally overlaps with soybean and has been consistently increasing, spurred by the increased resistance of common weed species to many crop protection products across multiple modes of action. Third-party data show that in recent years (2017 to 2024), dicamba use on corn has ranged between 0.5 to 1.1 times the dicamba use in postemergence soybeans (Figure 1). Yet the spray drift and volatility emissions from dicamba uses in corn have not been evaluated since 2006, in part due to the standard 15-yr re-registration cycle of pesticides at the USEPA. The tank mix of dicamba, glyphosate, and ammonium sulfate is commonly used in corn, despite previous research showing that these tank-mix partners have the potential to increase dicamba volatility (Mueller and Steckel Reference Mueller and Steckel2019). Similarly, from a spray drift perspective, while the DT uses require applications to be made using coarse to ultra-coarse spray droplet quality, there is no comparative field information when a different spray quality (e.g., medium spray droplet quality) is used in corn. In fact, the USEPA noted a general lack of data on spray drift and volatility from approved corn uses in their recent ecological risk assessment (USEPA 2022).
Third-party data showing the area of postemergence soybean and corn treated with dicamba in the United States from 2017 to 2024. Sparse y-axis tick labeling is intentionally applied for data protection.

The second complicating use of dicamba evaluated in this paper is the use of unapproved formulations of dicamba on DT crops (Unglesbee Reference Unglesbee2018). The ability to plant DT soybean comes with the obligation under a trait license agreement to use only approved low-volatility formulations. As mentioned previously, dicamba has been used for several decades on other crops, so several formulation types and salts (e.g., DMA, DGA, Na, etc.) of dicamba are readily available in the market but are not approved for use with DT soybean. These older products have neither the same formulation advancements nor corresponding label restrictions that are critical for minimizing spray drift and volatility emissions. Further, the older products lack the newer low-volatility formulations’ restrictions on tank mixing with products that can lower the pH of the tank solutions (e.g., ammonium sulfate, which is commonly added to increase the activity of glyphosate). These tank-mix partners are known to exacerbate volatility emissions (Mueller and Steckel Reference Mueller and Steckel2019; Sall et al. Reference Sall, Huang, Pai, Schapaugh, Honegger, Orr and Riter2020; Singh et al. Reference Singh, Barnes, Dintelmann, Bradley, Hager and Jhala2024).
In recent years, the volatility of dicamba formulations that are approved for DT soybean and cotton uses has been a significant area of research (Riter et al. Reference Riter, Pai, Vieira, MacInnes, Reiss, Hapeman and Kruger2021; Soltani et al. Reference Soltani, Oliveira, Alves, Werle, Norsworthy, Sprague, Young, Reynolds, Brown and Sikkema2020). Volatility resulting from DT uses has been associated with many factors, including temperature inversions (Bish et al. Reference Bish, Oseland and Bradley2021), dew (Henry et al. Reference Henry, Lin and Smeda2021), application surface, spray mixture pH (Mueller and Steckel Reference Mueller and Steckel2019), and soil pH (Oseland et al. Reference Oseland, Bish, Steckel and Bradley2020), yet there is lack of information on relative differences between these uses and other approved uses such as corn or potentially unapproved soybean dicamba uses under field conditions. The objective of this study was to compare the volatility and spray drift emissions from postemergence dicamba applications from an approved use on DT soybean, an approved use on corn, and an example of an unapproved use on soybean.
Materials and Methods
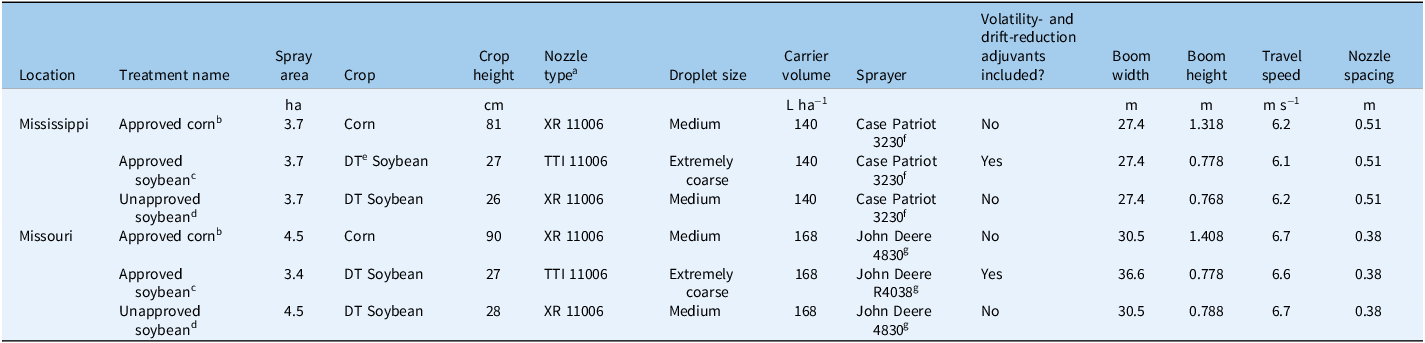
The experimental design consisted of dicamba applications on three approximately 4-ha square fields that were co-located (within 0.8 km of each other). This design was replicated at two locations (Greenville, MS, and Perry, MO). Each location comprised a single experiment with three fields (treatments). Because geographic and environmental conditions can affect spray and vapor drift, it is important that such studies be co-located and conducted at near-simultaneous times. At each location, two of the three fields were planted in DT soybean, and the third field was planted in corn. Each experiment sought to measure and compare volatility and spray drift deposition from three unique dicamba use patterns (treatments). Three treatments labeled “approved soybean” (following the labeled use at the time of the experiment in 2023, including the required volatility- and drift-reduction agents), “approved corn,” and “unapproved soybean” were selected to differ primarily by tank-mix components, nozzles used, droplet size, and crop (Table 1). At each location, all three co-located treatments were applied on the same day within several hours of each other. Application verification samples including in-swath filter papers and tank-mix samples were collected at each location. The soil in MS was predominantly Sharkey clay (very-fine, smectitic, thermic Chromic Epiaquerts), with a pH of 6.1 and organic matter content of 1.9%. The soil in MO was predominantly Putnam silt loam (fine, smectitic, mesic Vertic Albaqualfs), with a pH of 5.9 and an organic matter content of 2.0%.
Treatment and application details.

Table 1. Long description
The table compares treatment and application details for dicamba use patterns in Mississippi and Missouri. It has 10 rows and 15 columns. The columns are Location, Treatment name, Spray area, Crop, Crop height, Nozzle type, Droplet size, Carrier volume, Sprayer, Volatility- and drift-reduction adjuvants included, Boom width, Boom height, Travel speed, and Nozzle spacing. The rows are labeled with different treatments and locations. Row 1: Mississippi, Approved corn, 3.7, Corn, 81, XR 11006, Medium, 140, Case Patriot 3230, No, 27.4, 1.318, 6.2, 0.51. Row 2: Mississippi, Approved soybean, 3.7, DT,, , Soybean, 27, TTI 11006, Extremely coarse, 140, Case,, , , Patriot 3230. Row 3: Mississippi, Yes, 27.4, 0.778, DT, 6.1, 0.51, Soybean, 26, XR 11006, Medium, 140, Case,, , Patriot 3230. Row 4: Mississippi, Unapproved soybean, 3.7, DT,, , Soybean, 26, XR 11006, Medium, 140, Case,, , Patriot 3230. Row 5: Missouri, Yes, 27.4, 0.768, DT, 6.2, 0.51, Soybean, 27, XR 11006, Medium, 168, John Deere,, , R4038. Row 6: Missouri, Approved corn, 4.5, Corn, 90, XR 11006, Medium, 168, John Deere 4830, No, 30.5, 1.408, 6.7, 0.38. Row 7: Missouri, Approved soybean, 3.4, DT,, , Soybean, 27, TTI 11006, Extremely coarse, 168, John Deere,, , , R4038. Row 8: Missouri, Yes, 36.6, 0.778, DT, 6.6, 0.38, Soybean, 28, XR 11006, Medium, 168, John Deere 4830,, , No, 30.5. Row 9: Missouri, Unapproved soybean, 4.5, DT,, , Soybean, 28, XR 11006, Medium, 168, John Deere 4830,, , , R4038. Row 10: 0.788, 6.7, 0.38,, , , , , , , , , , . The table provides detailed information on the spray area, crop type, crop height, nozzle type, droplet size, carrier volume, sprayer type, volatility- and drift-reduction adjuvants, boom width, boom height, travel speed, and nozzle spacing for each treatment and location.
a All nozzles were set to a pressure of 345 kPa.
b Approved corn was treated with a tank mix of ClashTM Selective Herbicide (dicamba, DGA salt, 0.28 kg ae ha−1, NuFarm, Alsip, IL), Roundup PowerMax®3 (glyphosate, K salt, 1.26 kg ae ha−1, Bayer CropScience LLC, St Louis, MO), and Amsol5 (liquid AMS, 2.8 kg ha−1, Winfield Solutions LLC, St Paul, MN).
c Approved soybean was treated with a tank mix of XtendiMax® with VaporGrip® Technology Herbicide (dicamba, DGA salt, 0.56 kg ae ha−1, Bayer CropScience LLC, St Louis, MO), Roundup PowerMax®3 (glyphosate, K salt, 1.26 kg ae ha−1, Bayer CropScience LLC, St Louis, MO), VaporGrip® Xtra (volatility reducing adjuvant, 1.46 L ha−1, Bayer CropScience LLC, St Louis, MO), and Cognitive 1 (drift reducing adjuvant, 0.5% by volume, West Central, Wilmar, MN).
d Unapproved soybean was treated with a tank mix of ClashTM Selective Herbicide (dicamba, DGA salt, 0.56 kg ae ha−1, NuFarm, Alsip, IL), Hi-Yield Killzall II (Glyphosate, IPA salt, 1.26 kg ae ha−1, Voluntary Purchasing Groups, Inc., Bonham, TX) and Amsol (liquid AMS, 2.8 kg ha−1, Winfield Solutions, LLC, St Paul, MN).
e DT, dicamba tolerant.
f CNH Industrial America LLC., Racine, WI.
g Deere & Co., Moline, IL.
Meteorological Measurements
At each experimental site, four meteorological stations were constructed to collect weather data during and after applications. These included a 10-m station that was centrally located to the three treatments and three in-field stations. The 10-m station measured wind speed, wind direction, air temperature, and relative humidity at three nominal heights (1.7, 5.0, and 10 m), and it measured precipitation and solar radiation at a nominal height of 1.7 m. The in-field stations measured wind speed, wind direction, and air temperature at four heights (0.33, 0.55, 0.90, and 1.5 m above crop canopy). These stations were staged outside the treatments before application and were moved to the center of the test plots immediately following application.
Sedimented Spray Drift
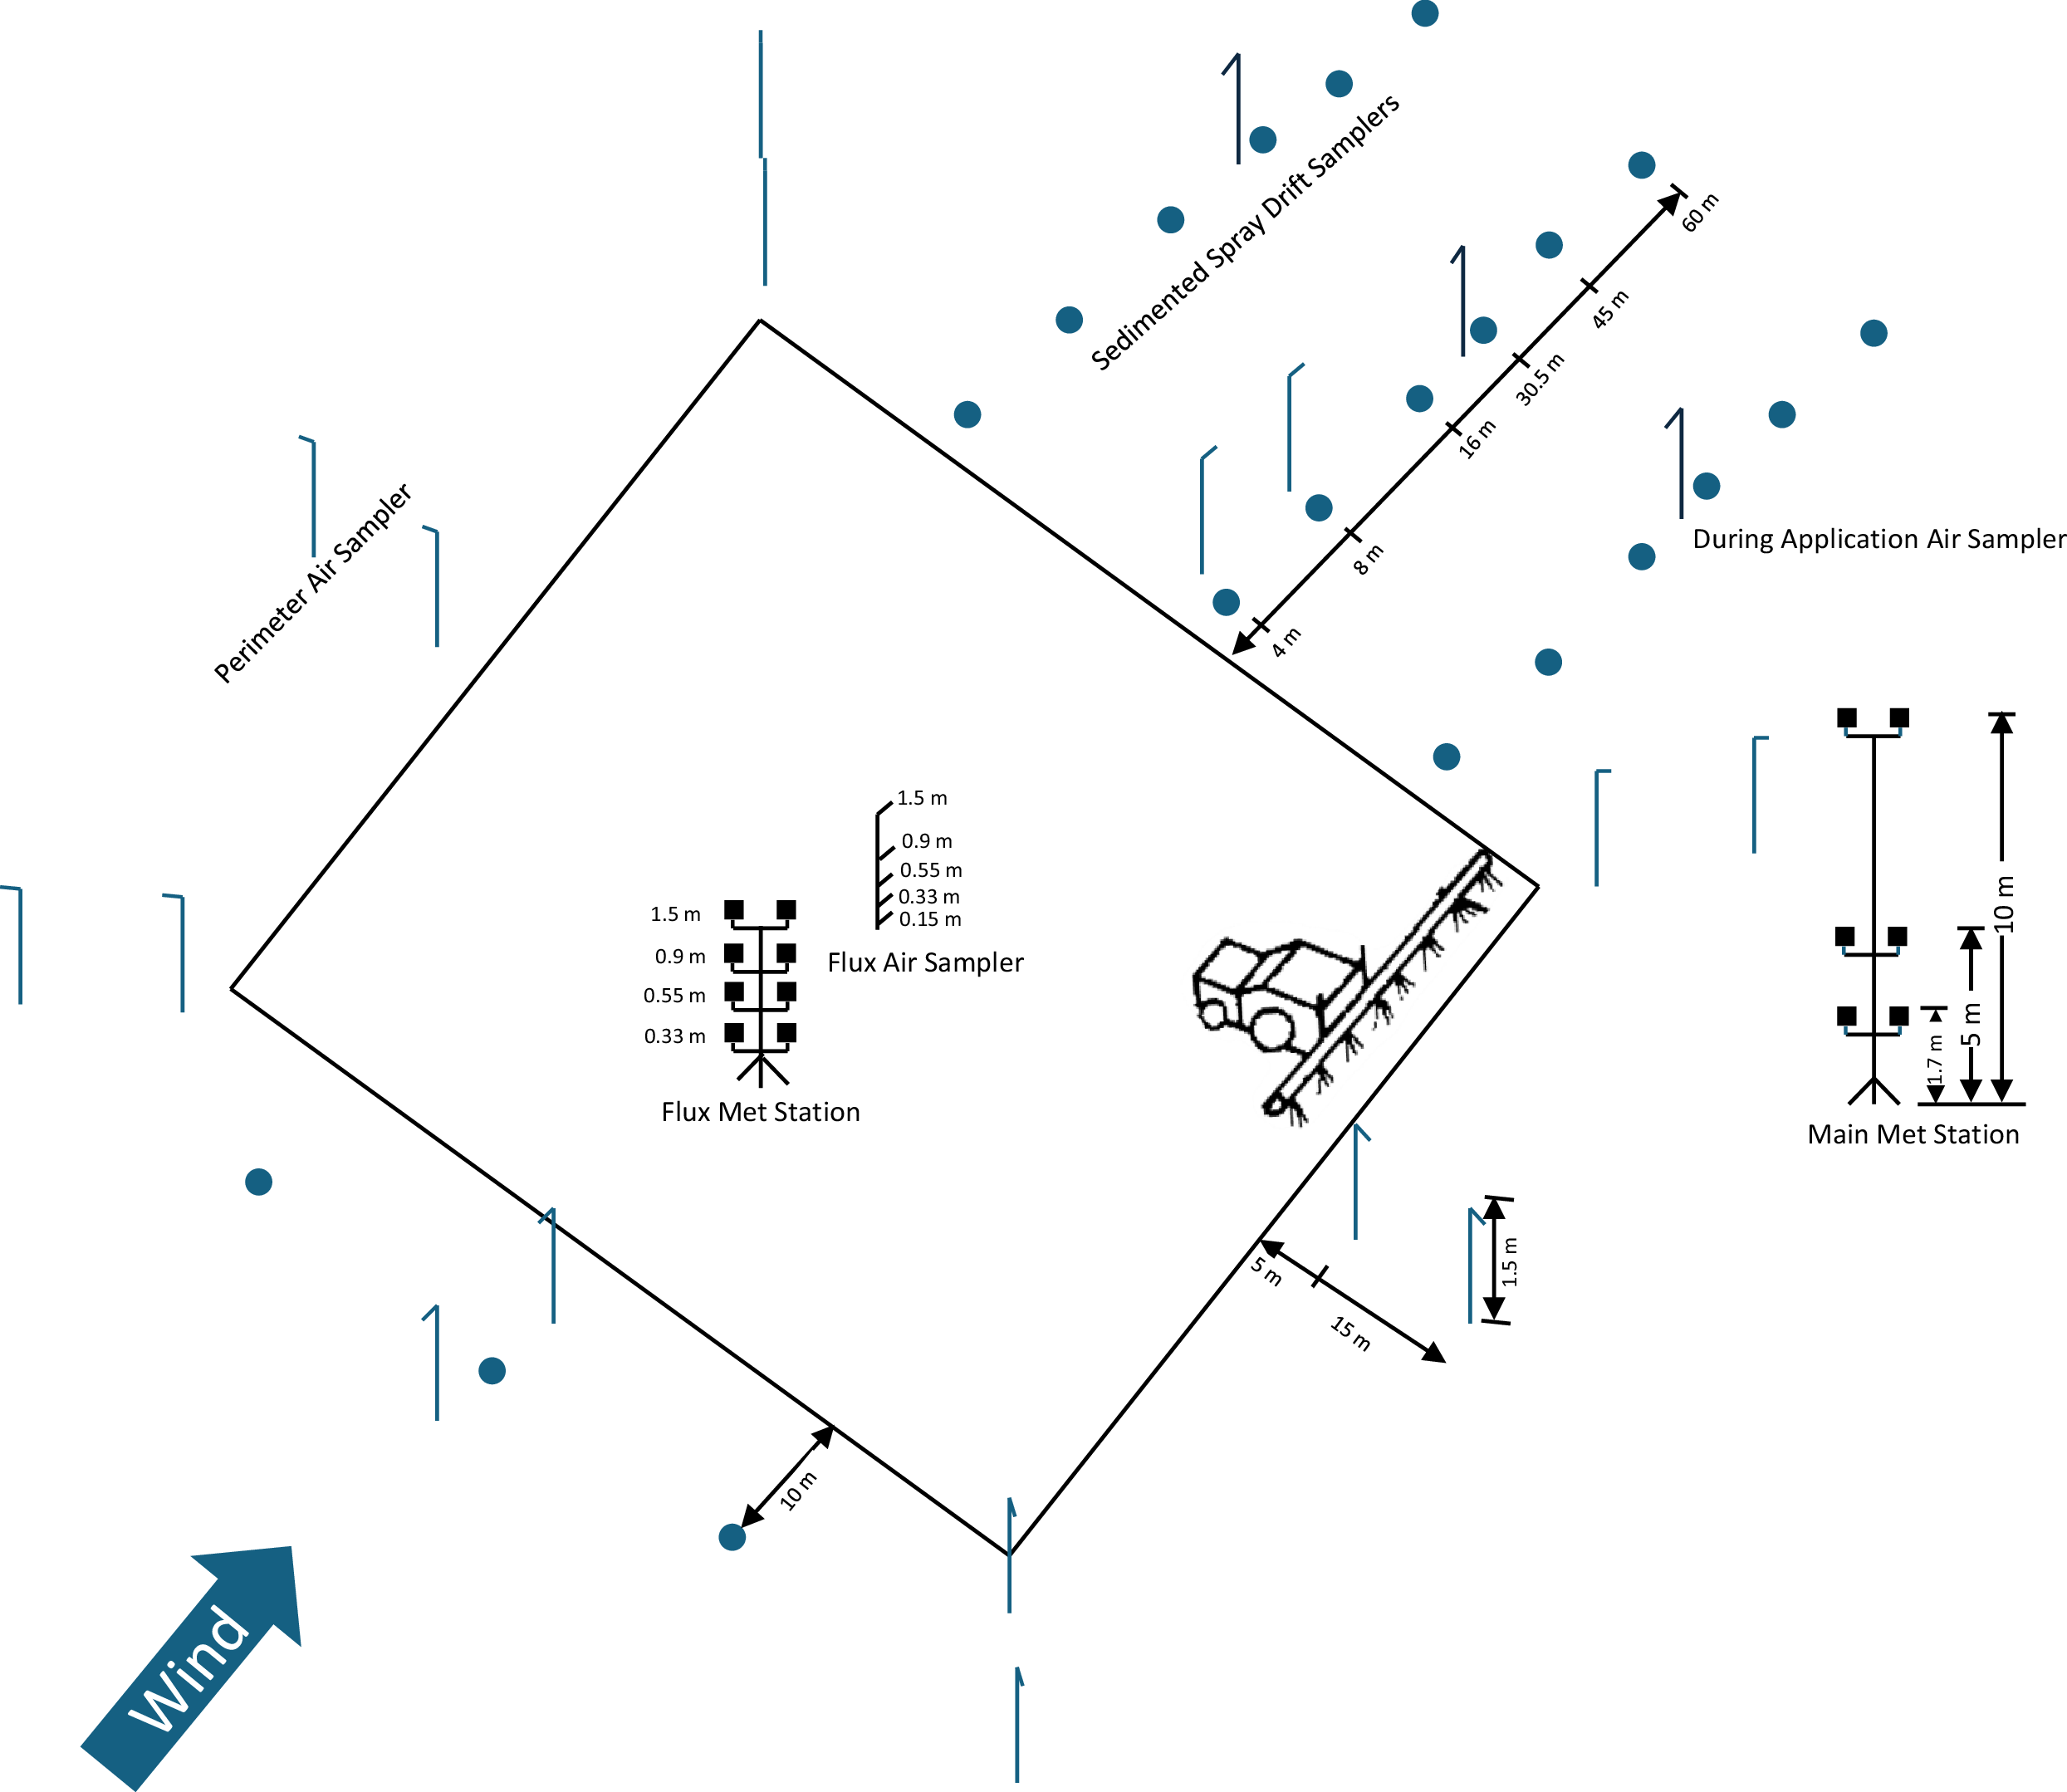
Following the release of spray from a nozzle, droplets are subject to transport as governed by their physical characteristics (e.g., density, size) and environmental conditions (e.g., wind speeds, turbulence). Droplets that are larger are likely to fall on ground closer to the field edge compared with smaller droplets. Deposited droplets are called sedimented spray drift. Spray drift samplers were placed at crop height in the upwind and downwind direction of each application area (Figure 2). Each sampler contained a filter paper (Whatman® #1, 150-mm diameter) pinned to a cardboard square positioned on wood blocks at crop height. For all applications, spray drift deposition samples were located along three parallel transects at 4, 8, 16, 30.5, 45, and 60 m downwind of the edge of the spray area of each treatment. Samples were collected at least 5 min after application starting at the farthest downwind sample. Samples were stored in coolers with dry ice until transferred to the analytical laboratory. Upwind deposition samples were placed 10 m upwind of each spray area and were prepared and collected in the same manner as the downwind samples.
Schematic layout of experimental fields showing location of dicamba application area, meteorological stations, and sampling points for sedimented spray drift, airborne (during application) spray drift, and volatilization measurements. Sampling locations include upwind and downwind transects for deposition, center-mast measurements at multiple heights (flux air sampler), and off-field air samplers (perimeter air sampler) positioned at 5 m and 15 m from the field edge.

Figure 2. Long description
A schematic layout of experimental fields showing the location of dicamba application area, meteorological stations, and sampling points for sedimented spray drift, airborne spray drift, and volatilization measurements. The layout includes a central area where dicamba is applied, marked by a tractor. Surrounding this area are various sampling points and meteorological stations. Upwind and downwind transects are marked for deposition measurements, with sampling points located at various distances from the application area. A flux met station and flux air sampler are positioned at multiple heights within the central area. Perimeter air samplers are placed at 5 meters and 15 meters from the field edge. The wind direction is indicated by an arrow pointing towards the left side of the diagram.
Airborne Spray Drift
As the spray plume moves in the downwind direction, certain droplets remain in the air and are called airborne spray drift. The proportion of airborne droplets decreases as many droplets continue to fall out of the plume. Airborne spray drift mass was measured through polyurethane foam (PUF) traps (SKC item number 226-92, Eighty Four, PA) placed 30.5 m downwind of the spray area of each treatment. The PUF traps were in glass tubes connected to an air pump (SKC, Eighty Four, PA) at 1.5 m above crop canopy and calibrated to 3 L min−1. These PUF traps were pointed toward the spray area and sampled air during the applications. For each plot, three PUF samples were placed downwind of the spray area spaced 15 m apart (Figure 2). Air pumps were turned on approximately 30 min before application and sampled at least 10 min after the sprayer completed all the passes.
Vapor Measurements
Volatilization was quantified from each treatment through air samplers placed at the center as well as outside the spray area at 5 m and 15 m from the field edge in eight cardinal locations (Figure 2). The center air-sampling mast measured vapor at five heights (0.15, 0.33, 0.55, 0.90, and 1.5 m above the crop canopy), while the off-field samplers measured at a single height of 1.5 m above the crop canopy. Sampling was conducted using PUF traps, similar to airborne spray drift sampling, except samplers were pointed away from the spray area to minimize collection of any droplets.
The center and 5 m off-field samplers PUF traps were collected and refreshed with new PUFs every 12 h up to 108 h (MS) or 156 h (MO) post application. Reduced sampling hours at MS were the result of an extreme weather event that required early termination of sampling. PUF collector samples at the 15 m off-field locations were collected every 24 h up to 96 h (MS) or 156 h (MO). A total of 135 and 195 center-mast samples and 312 and 480 perimeter samples were collected in MS and MO, respectively. Samples were collected and stored in coolers with dry ice until transfer to the analytical laboratory.
Sample Analysis
Spray drift filter paper samples were extracted using 30 ml of 25% methanol in water and were shaken for 5 min on a high-speed shaker. Extracts were centrifuged 5 minutes at 4500 × g, and then a 1.0-ml aliquot was combined with the stable labeled internal standard of [13C6]dicamba. Extracts were filtered using a polypropylene filter and quantified for dicamba using liquid chromatography-tandem mass spectrometry. The PUF samples were extracted and quantified using a previously described method (Riter et al. Reference Riter, Sall, Pai, Beachum and Orr2020) with a few alterations. Dicamba was extracted from the PUF samples using 30 ml of methanol with a stable labeled internal standard of [13C6]dicamba and was shaken for 30 min on a high-speed shaker. However, the extracts were concentrated to a factor of 100× in the current study instead of 10× using the following methodology. First, 10 ml of the filtered extract was evaporated using nitrogen at approximately 45 C to 1 ml. Next, the concentrated extracts were transferred to a 96-well polypropylene filter plate and evaporated to dryness. Finally, samples were reconstituted to 0.100 ml with 25% methanol in water.
For filter papers and PUF samples, quantitation was performed using a Shimadzu ExionLC AD HPLC (Shimadzu, Kyoto, Japan) coupled to an AB Sciex API 6500 + with SelexION® + triple-quadrupole mass spectrometer (AB Sciex, Marlborough, MA, USA) via a Turbo-V electrospray ion (ESI) source in negative ion mode. Extracted samples were separated using a gradient from 20 or 30 to 95% B (mobile phase A = 0.05% formic acid in water and mobile phase B = methanol) at a flow rate of 0.3 L min−1 on a Phenomenex Kinetex Biphenyl column (Phenomenex, Torrance, CA) (50 mm by 3.0 mm, 2.6 μm) with a 3.0-mm biphenyl guard column held at 40 C.
The limit of detection (LOD) and limit of quantitation (LOQ) for filter papers were 84.8 ng m−2 and 283 ng m−2, respectively, and for PUFs were 0.03 ng PUF−1 and 0.1 ng PUF−1, respectively.
Modeling and Statistical Analysis
At each location, each use pattern was applied to a single field; therefore, treatments are confounded with field and do not constitute true plot-level replication. Treatments were extensively sampled to characterize spatial variability; however, individual samples within a field are not statistically independent and should be considered pseudo-replicates. Accordingly, statistical analyses are intended to be descriptive and exploratory within each site rather than fully replicated tests of treatment effects. Sample analysis on filter paper provided the mass of sedimented spray drift. This mass was converted into percent of applied units using the filter paper area and target application rate to normalize for the difference in application rates across the treatments. This normalized sedimented drift was analyzed to evaluate the effect of treatments across distances and locations. A one-way ANOVA was performed independently for each combination of distance and location to determine whether there were significant differences in deposition among the three treatments. The treatment factor was used as the independent variable, and deposition was the dependent variable.
Following the ANOVA, pairwise comparisons between treatments were conducted using Tukey’s honest significant difference (HSD) test to identify specific differences among treatment means. Compact letter displays (CLDs) were generated using the emmeans package in R to visually represent the results of the pairwise comparisons. Treatments that were not significantly different (P > 0.05) were assigned the same letter, while treatments with significant differences (P ≤ 0.05) were assigned different letters. The extraction from during-application PUF samples yielded the mass of dicamba that was airborne at 30.5 m downwind from each treatment. Tukey’s HSD was employed to identify any significant differences (α = 0.05) in airborne spray drift mass across the three uses. For sedimented and airborne drift, multiple downwind transects within each field were treated as subsamples representing spatial variability within a single plot, rather than as independent replicates. All analyses were performed using R Statistical Software (v. 4.4.1; R Core Team 2024), utilizing the emmeans, dplyr, and ggplot2 packages.
Volatilization from the three treatments was quantified through flux estimation. The flux, which has a unit of mass of dicamba volatilized per unit area and per unit time (e.g., ng m−2 s−1), provides the temporal trend of emission rate from the field. Three types of flux estimation methods (aerodynamic [AD], integrated horizontal [IH], and indirect [ID]) were employed in this study.
The AD and IH methods have been described in detail previously (Sall et al. Reference Sall, Huang, Pai, Schapaugh, Honegger, Orr and Riter2020). Briefly, the steps involved are as follows. First, the mass of dicamba measured on PUF, average flow rates, and sampling duration were used to calculate the volatile air concentration. For each sampling period, the in-field air concentrations were regressed against the height to establish the log-linear relationship between these two variables. For fields with adequate fetch, a log-linear relationship is expected (Sall et al. Reference Sall, Huang, Pai, Schapaugh, Honegger, Orr and Riter2020). An outlier test using the deleted studentized residual (DSR) approach was employed to check for any significant deviations from the relationship. Values with DSR values greater than the threshold were deemed outliers and were excluded from further analysis. This relationship for each sampling period was paired with corresponding meteorological measurements such as temperature and wind speed to derive the AD and IH flux. Each flux method provides a temporal emission profile.
A third type of flux estimate, ID, was derived from the off-field sampler air concentrations, an air transport model (AERMOD) (USEPA 2024), and meteorological measurements. AERMOD was set up for each field independently and run on an hourly basis for the sampling duration (108 h for MS, 156 h for MO) assuming a nominal emission rate (1 g m−2 s−1). This emission profile used by AERMOD, along with field-specific meteorological data, was used to simulate the off-field transport. The model also needs upper layer atmospheric data, which were acquired from nearby weather stations and were similar for all three fields. Air concentration data simulated by the model at the off-field samplers were then used to adjust the nominal emission profile. This approach takes advantage of the linear relationship in AERMOD between input emission rate and output air concentration (USEPA 2024).
Each flux estimation method has its strengths and weaknesses as described in previous publications (Wilson and Shum Reference Wilson and Shum1992; Majewski Reference Majewski1999). Hence, an average of three flux methods for each sampling period is provided to represent the emission rate. The average flux from the three methods was converted to a cumulative volatile mass loss for each location and treatment using the surface area, target application rate, and sampling duration.
Results and Discussion
Spray Applications/Conditions
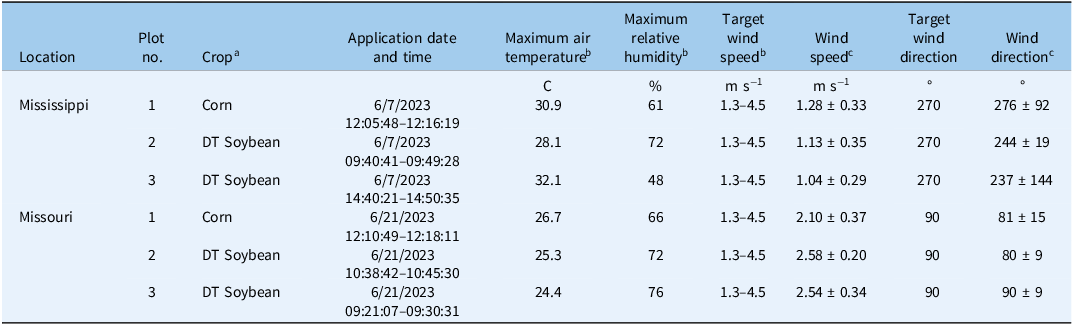
In-field filter paper samplers indicated that the sprays resulted in 80% to 93% of the target dicamba application rate at the MO location. For the MS location, spray application resulted in 78% to 84% of the target dicamba application rate. Samples collected from the tank mix showed 77% to 80% of target in MO and 91% to 96% of target in MS. Average wind speeds were higher during applications in MO (2.11 to 2.63 m s−1) than MS (1.05 to 1.31 m s−1). However, within a location, the wind speeds were similar across the three dicamba treatments. For example, the wind speed during the applications for approved corn, approved soybean, and unapproved soybean uses were 2.11 m s−1, 2.63 m s−1, and 2.63 m s−1, respectively at the MO location. The similarity in wind speed favors the evaluation of sensitive factors affecting drift such as spray quality and boom height. During the applications, maximum air temperatures were slightly higher in MS (28.1 to 32.1 C) than MO (24.4 to 26.7 C; Table 2). However, over the study duration, the temperature was similar across the treatments and ranged from 14.4 C to 35.3 C in MO and from 19.3 C to 34.1 C in MS, as measured at 1.7-m height. Relative humidity ranged from 28% to 96% in MO and 37% to 96% in MS, as measured at 1.7-m height (Supplementary Table S1).
Meteorological conditions during application.

Table 2. Long description
The table compares meteorological conditions during dicamba application in Mississippi and Missouri. It has 10 rows and 9 columns. The columns are labeled as Location, Plot no., Crop, Application date and time, Maximum air temperature, Maximum relative humidity, Target wind speed, Wind speed, Target wind direction, and Wind direction. The rows are labeled with locations Mississippi and Missouri, and plot numbers 1, 2, and 3. The table provides specific data for each plot, including the crop type, application date and time, maximum air temperature in degrees Celsius, maximum relative humidity in percent, target wind speed in meters per second, actual wind speed in meters per second, target wind direction in degrees, and actual wind direction in degrees. For Mississippi, the data shows application dates on 6/7/2023 with varying times, maximum air temperatures ranging from 28.1 to 32.1 degrees Celsius, maximum relative humidity ranging from 48 to 72 percent, target wind speeds between 1.3 and 4.5 meters per second, actual wind speeds between 1.04 and 1.28 meters per second, target wind directions of 270 degrees, and actual wind directions ranging from 270 to 276 degrees. For Missouri, the data shows application dates on 6/21/2023 with varying times, maximum air temperatures ranging from 24.4 to 26.7 degrees Celsius, maximum relative humidity ranging from 66 to 76 percent, target wind speeds between 1.3 and 4.5 meters per second, actual wind speeds between 2.10 and 2.58 meters per second, target wind directions of 90 degrees, and actual wind directions ranging from 81 to 90 degrees.
a DT, dicamba tolerant.
b Recorded at 1.7 m above ground surface.
c Wind speed and direction were recorded approximately at boom height or 0.55 m above the crop canopy height. Average ± SD of data that were recorded every second and averaged by minute.
Timings are on a 24-hour clock.
Sedimented Spray Drift
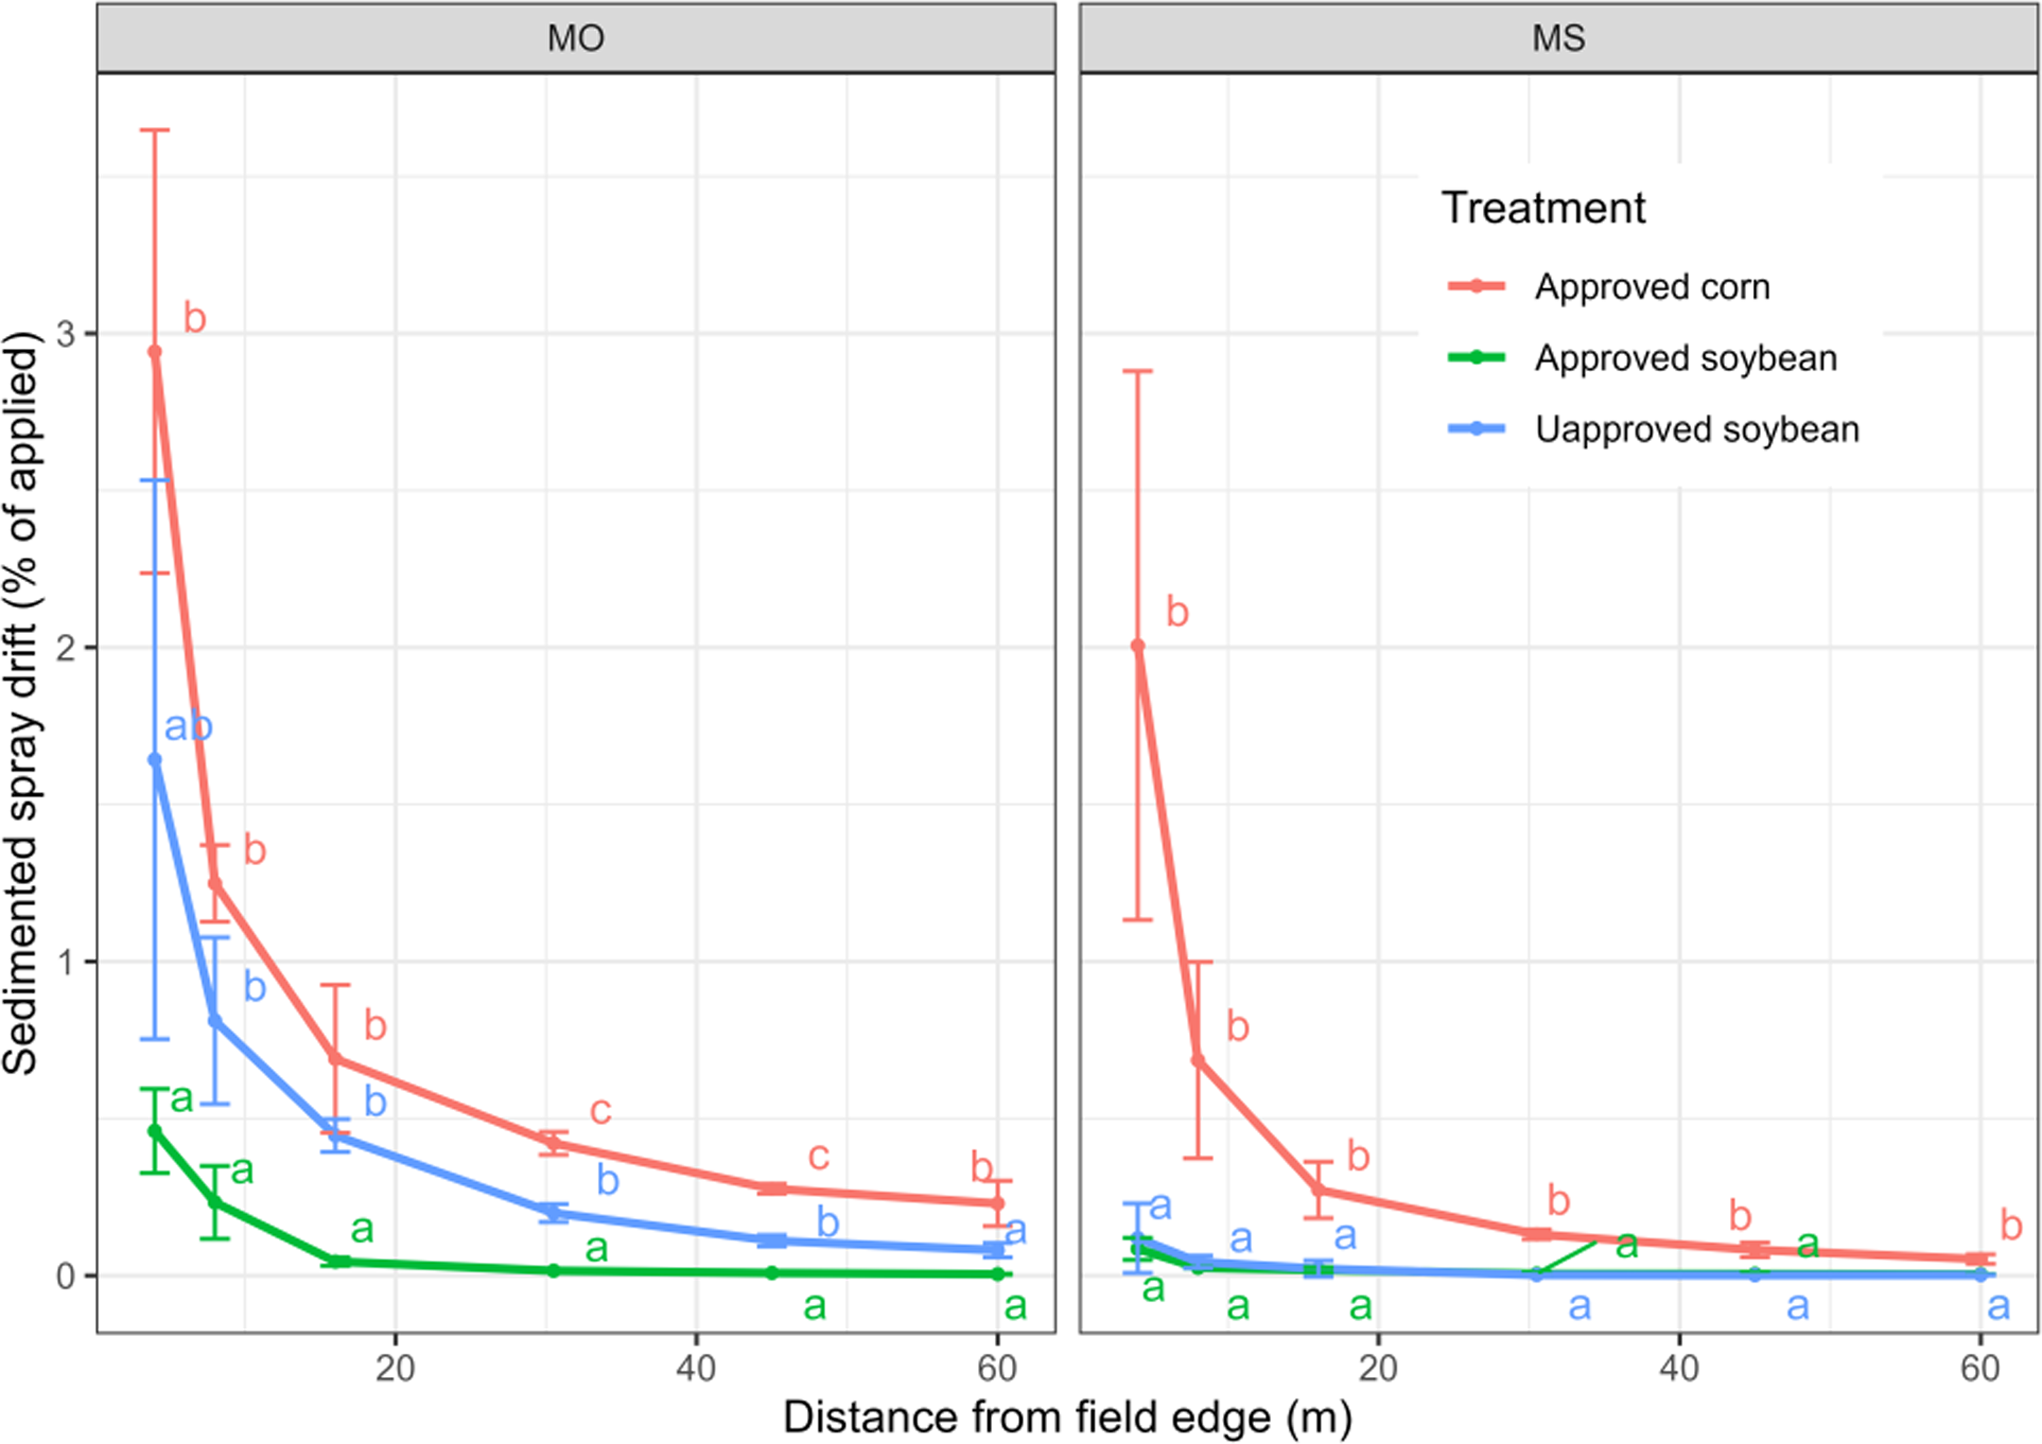
As expected, sedimented spray drift exhibited an exponential decline with distance (Figure 3; Supplementary Table S2). The MO and MS approved soybean spray drift results are within the range of a separate study (Soltani et al. Reference Soltani, Oliveira, Alves, Werle, Norsworthy, Sprague, Young, Reynolds, Brown and Sikkema2020) that conducted a similar experiment at six locations. In the referenced study, the amount deposited at 4 m from the field edge ranged from 0.03% of applied in Indiana to 1.86% of applied in Nebraska, whereas the current study reported an average of three replicates ± SD of 0.085 ± 0.035% of applied in MS and 0.46 ± 0.13% of applied in MO at 4 m.
Sedimented dicamba spray drift expressed as percent of applied mass as a function of distance from field edge (4–60 m) for three dicamba use patterns: approved corn (medium droplet size, higher boom height, DGA dicamba + K salt glyphosate + AMS), approved soybean (extremely coarse droplet size, lower boom height, DGA dicamba + K salt glyphosate with volatility and drift-reduction adjuvants), and unapproved soybean (medium droplet size, lower boom height, DGA dicamba + IPA salt glyphosate + AMS). Measurements were collected at crop canopy height along three parallel downwind transects at each distance. Results are shown for dicamba applications at Missouri (MO) and Mississippi (MS) locations. Points represent mean across transects, with error bars indicating SD. Means followed by the same lowercase letters within each distance are not significantly different (Tukey’s honest significant difference [HSD], α = 0.05).

The upwind filter paper samples were below the LOQ at two of the three plots at the MO study. At the unapproved soybean plot in MO, trace residues up to 888 ng m−2 (corresponding to 0.0016% of applied) were observed on the upwind deposition filter paper samples. At low wind speeds, the wind direction can be variable, and trace residues of pesticides upwind of the application area can sometimes be observed (Kruger et al. Reference Kruger, Alves, Schroeder, Golus, Reynolds, Dodds, Brown, Fritz and Hoffmann2023). The wind speeds during application were lower in MS, which may have resulted in variable wind directions; therefore, the 10-m upwind filter paper samples frequently had higher amounts of dicamba detected, up to 980 ng m−2 (corresponding to 0.0035% of applied).
At the MO location, there was a clear separation in spray drift between the three treatments. Spray drift was highest for approved corn use and lowest for approved soybean treatment. For example, at 8 m from the field edge, the mean sedimented spray drift in percentage of applied for the approved corn treatment was five times the mean sedimented spray drift for the approved soybean treatment (1.24 ± 0.12% compared with 0.23 ± 0.12%). Similarly, the mean drift from unapproved soybean treatment was 3.5 times the mean drift from approved soybean treatment (0.81 ± 0.27% compared to 0.23 ± 0.12%). The ANOVA results revealed significant differences in deposition among the three treatments at various distances and locations (P ≤ 0.05). Tukey’s HSD test and CLDs identified specific treatments that differed significantly, with distinct patterns observed across distances and between locations (Figure 3).
At the MS location, the approved corn treatment resulted in distinctly higher drift (0.69 ± 0.31% of applied at 8 m from field edge) when compared with the other two treatments; however, the approved and unapproved soybean treatments had similar lower spray drift (0.025 ± 0.002% and 0.044 ± 0.020%, respectively, at 8 m). This lack of differentiation in spray drift between soybean treatments resulted likely from low wind speeds (1.05 to 1.18 m s−1) during application. The approved corn treatment drifted higher, possibly due to higher wind speed (1.31 m s−1) but more likely from the higher boom height (1.3 m above the ground) compared with the unapproved soybean treatment (0.77 m above the ground).
Airborne Spray Drift
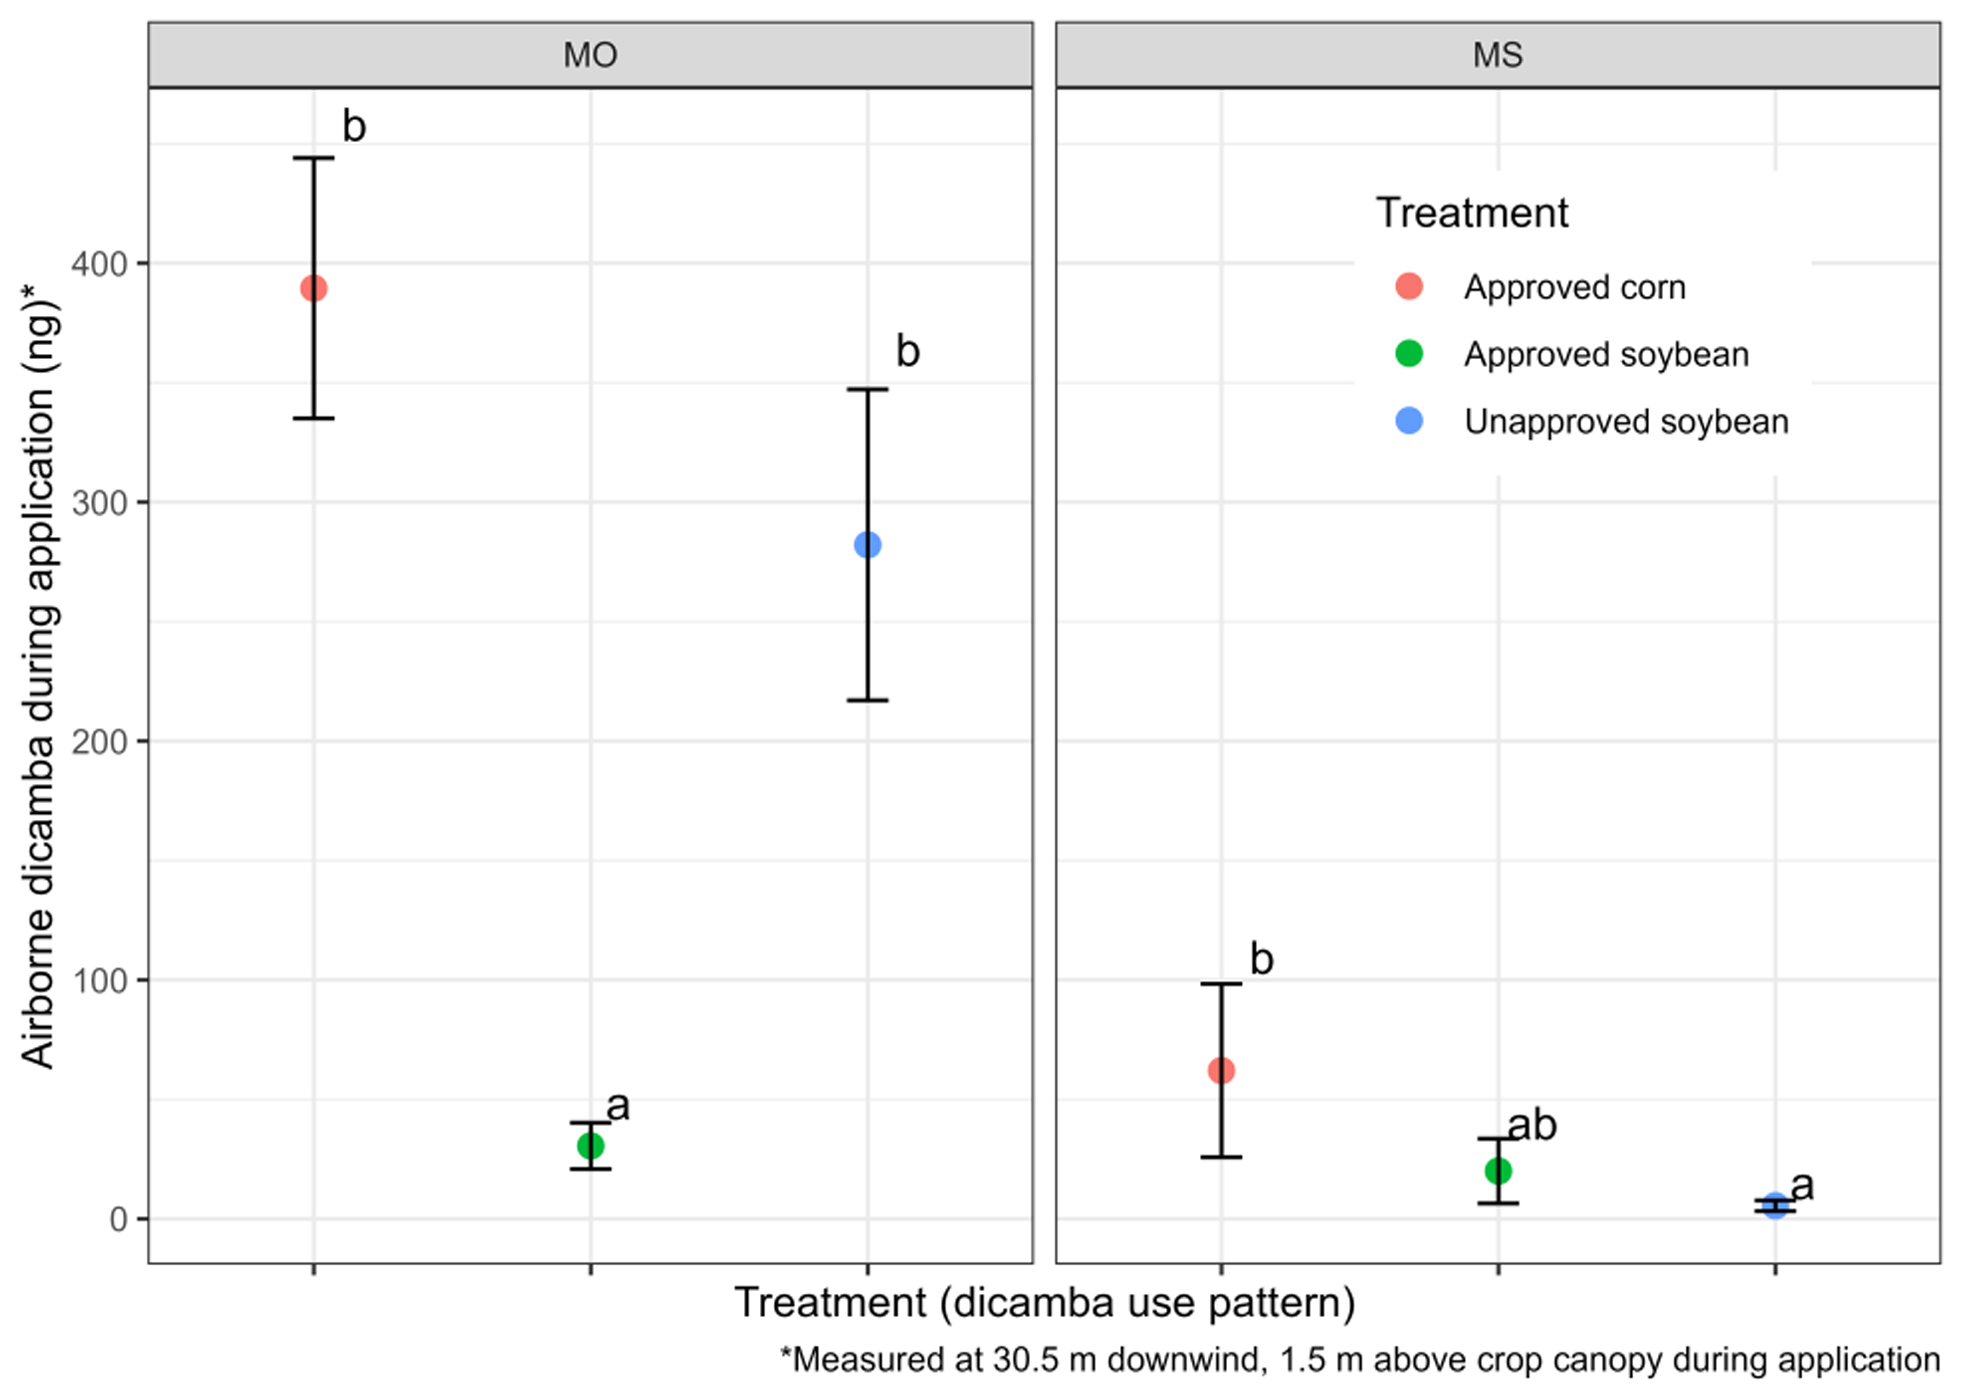
At the MO location, airborne spray drift mass (as measured at 30.5 m from the downwind edge) was significantly (α = 0.05) higher for the approved corn and unapproved soybean treatments compared with the approved soybean treatment (Figure 4). Airborne drift for approved corn treatment (average of three replicates ± SD of 390 ± 54 ng) and unapproved soybean treatment (282 ± 65 ng) was 13 and 9 times higher, respectively, compared with approved soybean treatment (31 ± 10 ng). Like sedimented spray drift, due to lower wind speeds at the MS location, airborne spray drift was statistically similar across the three treatments. The approved corn treatment had higher airborne spray drift at both study locations, likely because of the use of the smaller spray droplet quality (medium) and higher release height of the spray compared with soybean treatments. A previous study compared dicamba drift from several nozzles including TTI, AIXR, XR, and TT nozzles and reported that for three of the nozzles (AIXR, XR, and TT), the spray drift increased exponentially with wind speeds (Alves et al. Reference Alves, Kruger, da Cunha, de Santana, Pinto, Guimarães and Zaric2017). In contrast, the same study reported that the spray drift from TTI nozzles exhibited a linear relationship with wind. For the current study, even with similar wind speed (2.1 to 2.6 m s−1) and boom height in MO for soybean treatments, the unapproved soybean treatment showed higher airborne drift compared with the approved soybean treatment, likely from the smaller droplet size.
Airborne dicamba mass (ng) measured at 30.5 m downwind and 1.5 m above crop canopy for three dicamba use patterns: approved corn (medium droplet size, higher boom height, DGA dicamba + K salt glyphosate + AMS), approved soybean (extremely coarse droplet size, lower boom height, DGA dicamba + K salt glyphosate with volatility and drift-reduction adjuvants), and unapproved soybean (medium droplet size, lower boom height, DGA dicamba + IPA salt glyphosate + AMS). Results are shown for dicamba applications at Missouri (MO) and Mississippi (MS) locations. Points represent mean of three downwind sampling positions, with error bars indicating SD. Means followed by the same lowercase letters are not significantly different (Tukey’s honest significant difference [HSD], α = 0.05).

Figure 4. Long description
The image contains two vertical bar graphs comparing airborne dicamba mass during application for different dicamba use patterns in Missouri (MO) and Mississippi (MS). Each graph represents the airborne dicamba mass measured at 30.5 meters downwind and 1.5 meters above the crop canopy. The x-axis of both graphs indicates the treatment patterns: approved corn, approved soybean, and unapproved soybean. The y-axis shows the airborne dicamba mass in nanograms (ng). The treatments are color-coded: red for approved corn, green for approved soybean, and blue for unapproved soybean. Error bars indicate the standard deviation (SD) of the mean values. In Missouri, the approved corn treatment shows the highest airborne dicamba mass, followed by the unapproved soybean treatment, and the approved soybean treatment shows the lowest mass. In Mississippi, the approved corn treatment again shows the highest airborne dicamba mass, followed by the approved soybean treatment, and the unapproved soybean treatment shows the lowest mass. Means followed by the same lowercase letters are not significantly different according to Tukey’s honest significant difference (HSD) test at a significance level of 0.05.
Volatile Emissions
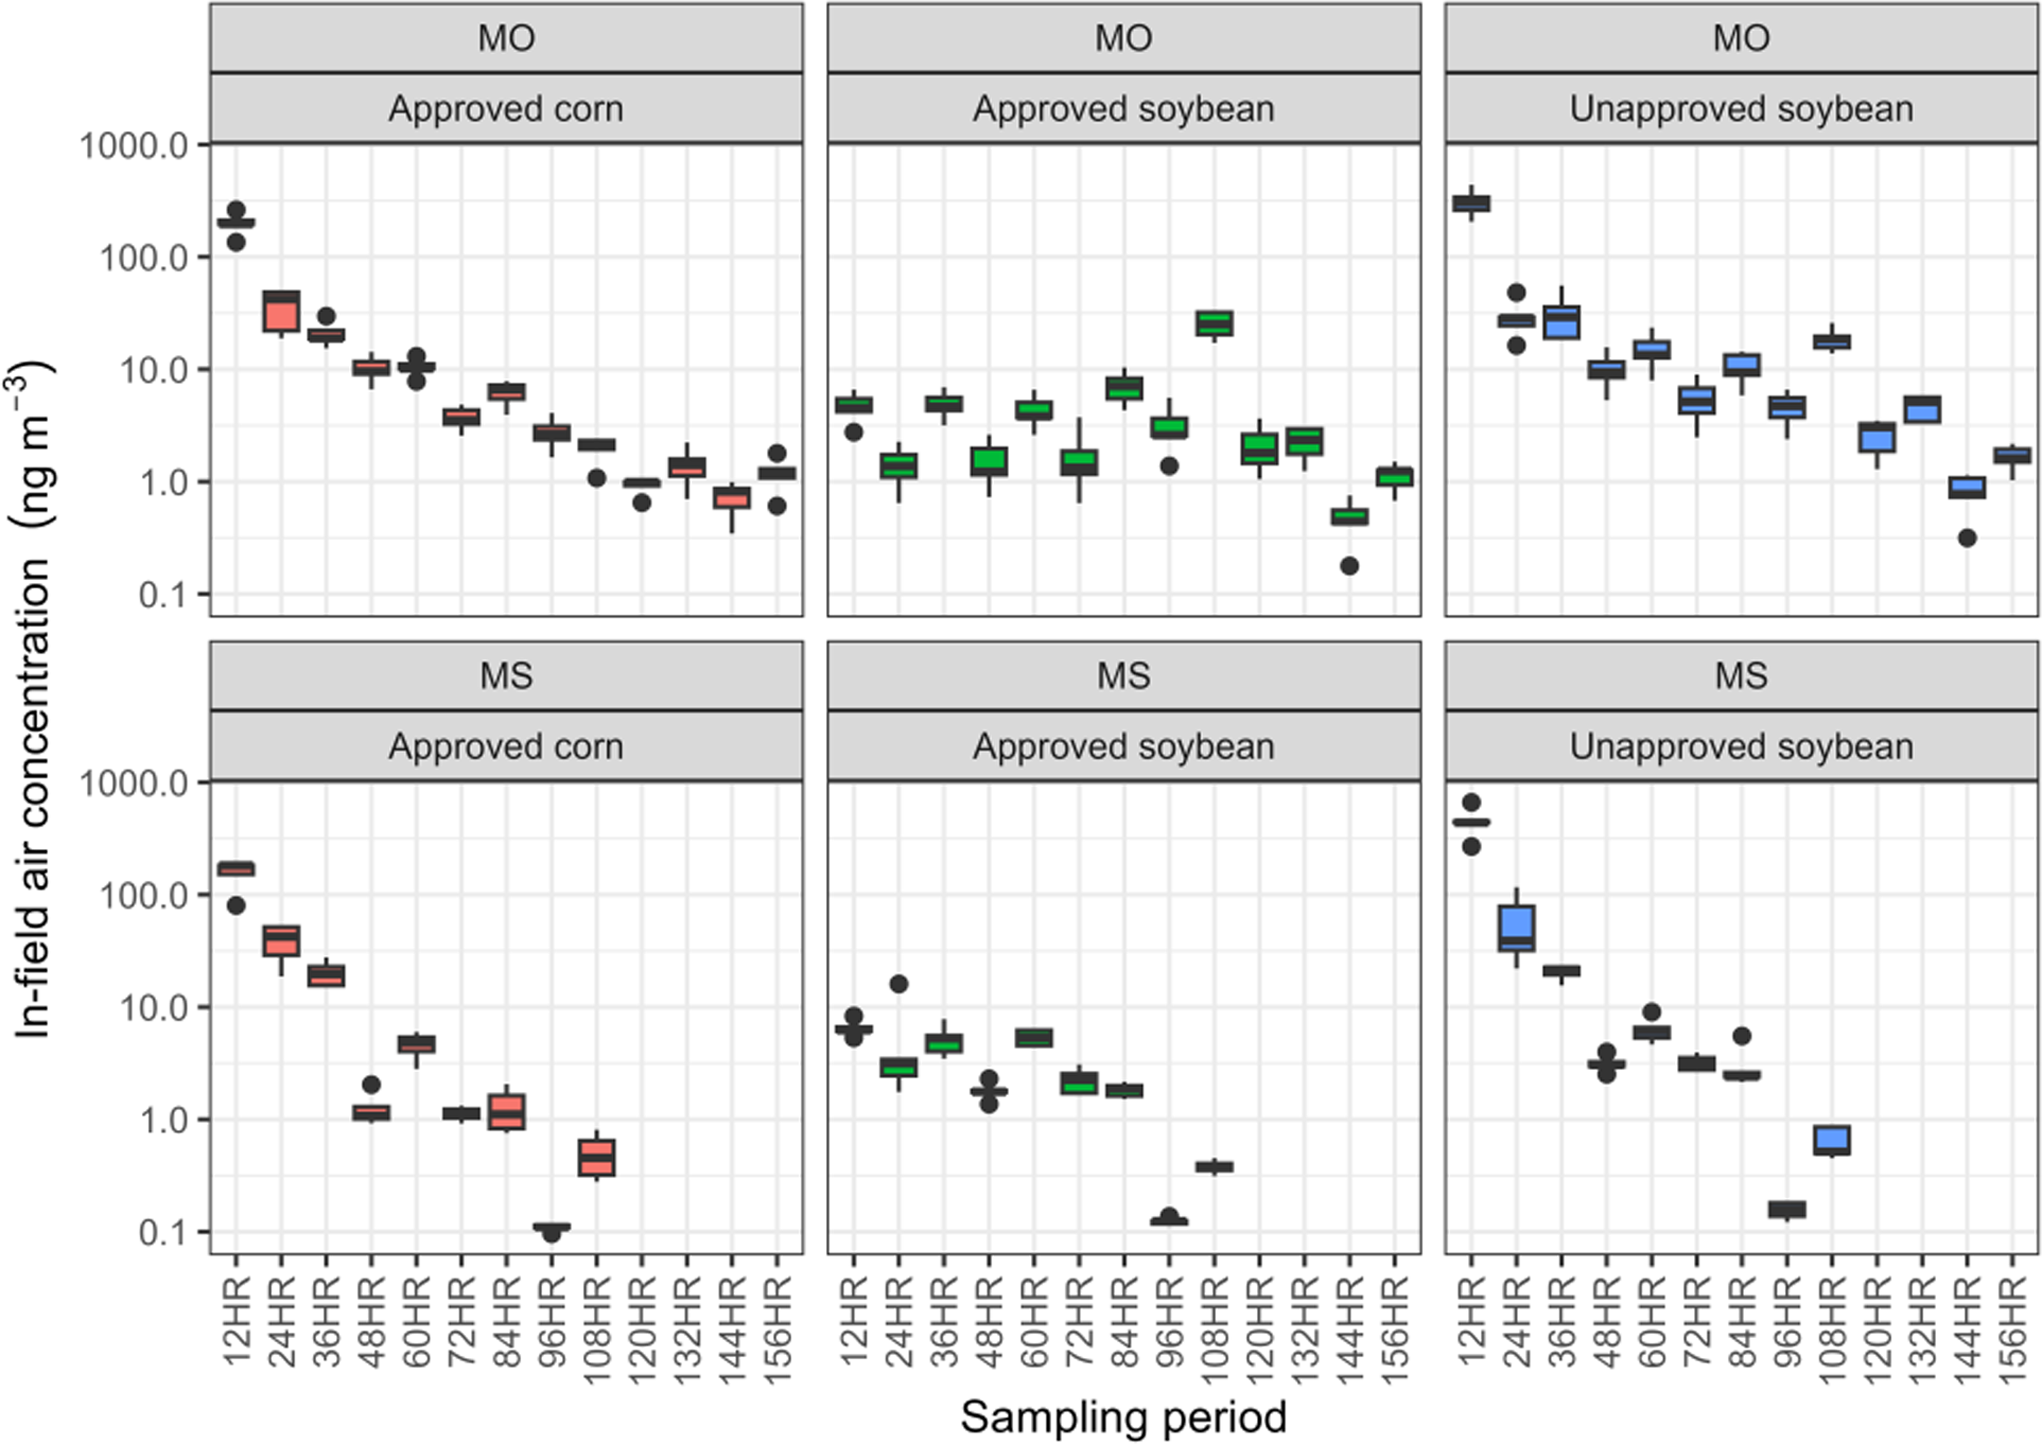
For the modeling analysis using the AD and IHF methods, there were 13 and 8 air samples deemed outliers and excluded from further analysis in the MO and MS locations, respectively. This represented 6.7% of the center-mast air samples (13 of 195) in MO and 5.9% of the center-mast air samples (8 of 135) in MS. In-field air concentrations of dicamba for the approved corn and unapproved soybean treatments were substantially higher in the first three sampling intervals compared with the approved soybean treatment (Figure 5; Supplementary Table S3). For instance, at the MO location, during the first sampling interval, which lasted for approximately 6 h after application, the approved corn and unapproved soybean treatments had 39 and 80 times higher in-field air concentration at 15 cm above the crop canopy, respectively, compared with the approved soybean treatment (212 ng m−3 and 438 ng m−3, respectively, compared with 5.45 ng m−3). As expected, a diurnal pattern was noticeable, with lower volatility in nighttime intervals and higher volatility during daytime intervals.
In-field dicamba air concentration (ng m−3) measured at multiple heights (0.15–1.5 m above crop canopy) within the treated field over time following application for approved corn (medium droplet size, higher boom height, DGA dicamba + K salt glyphosate + AMS), approved soybean (extremely coarse droplet size, lower boom height, DGA dicamba + K salt glyphosate with volatility and drift-reduction adjuvants), and unapproved soybean (medium droplet size, lower boom height, DGA dicamba + IPA salt glyphosate + AMS) use patterns at Missouri (MO) and Mississippi (MS) locations. Sampling periods correspond to sequential intervals following application. Box plots show distribution across vertical sampling heights, with median, interquartile range, and outliers indicated. The MS study was terminated after the 108-h period due to rainfall.

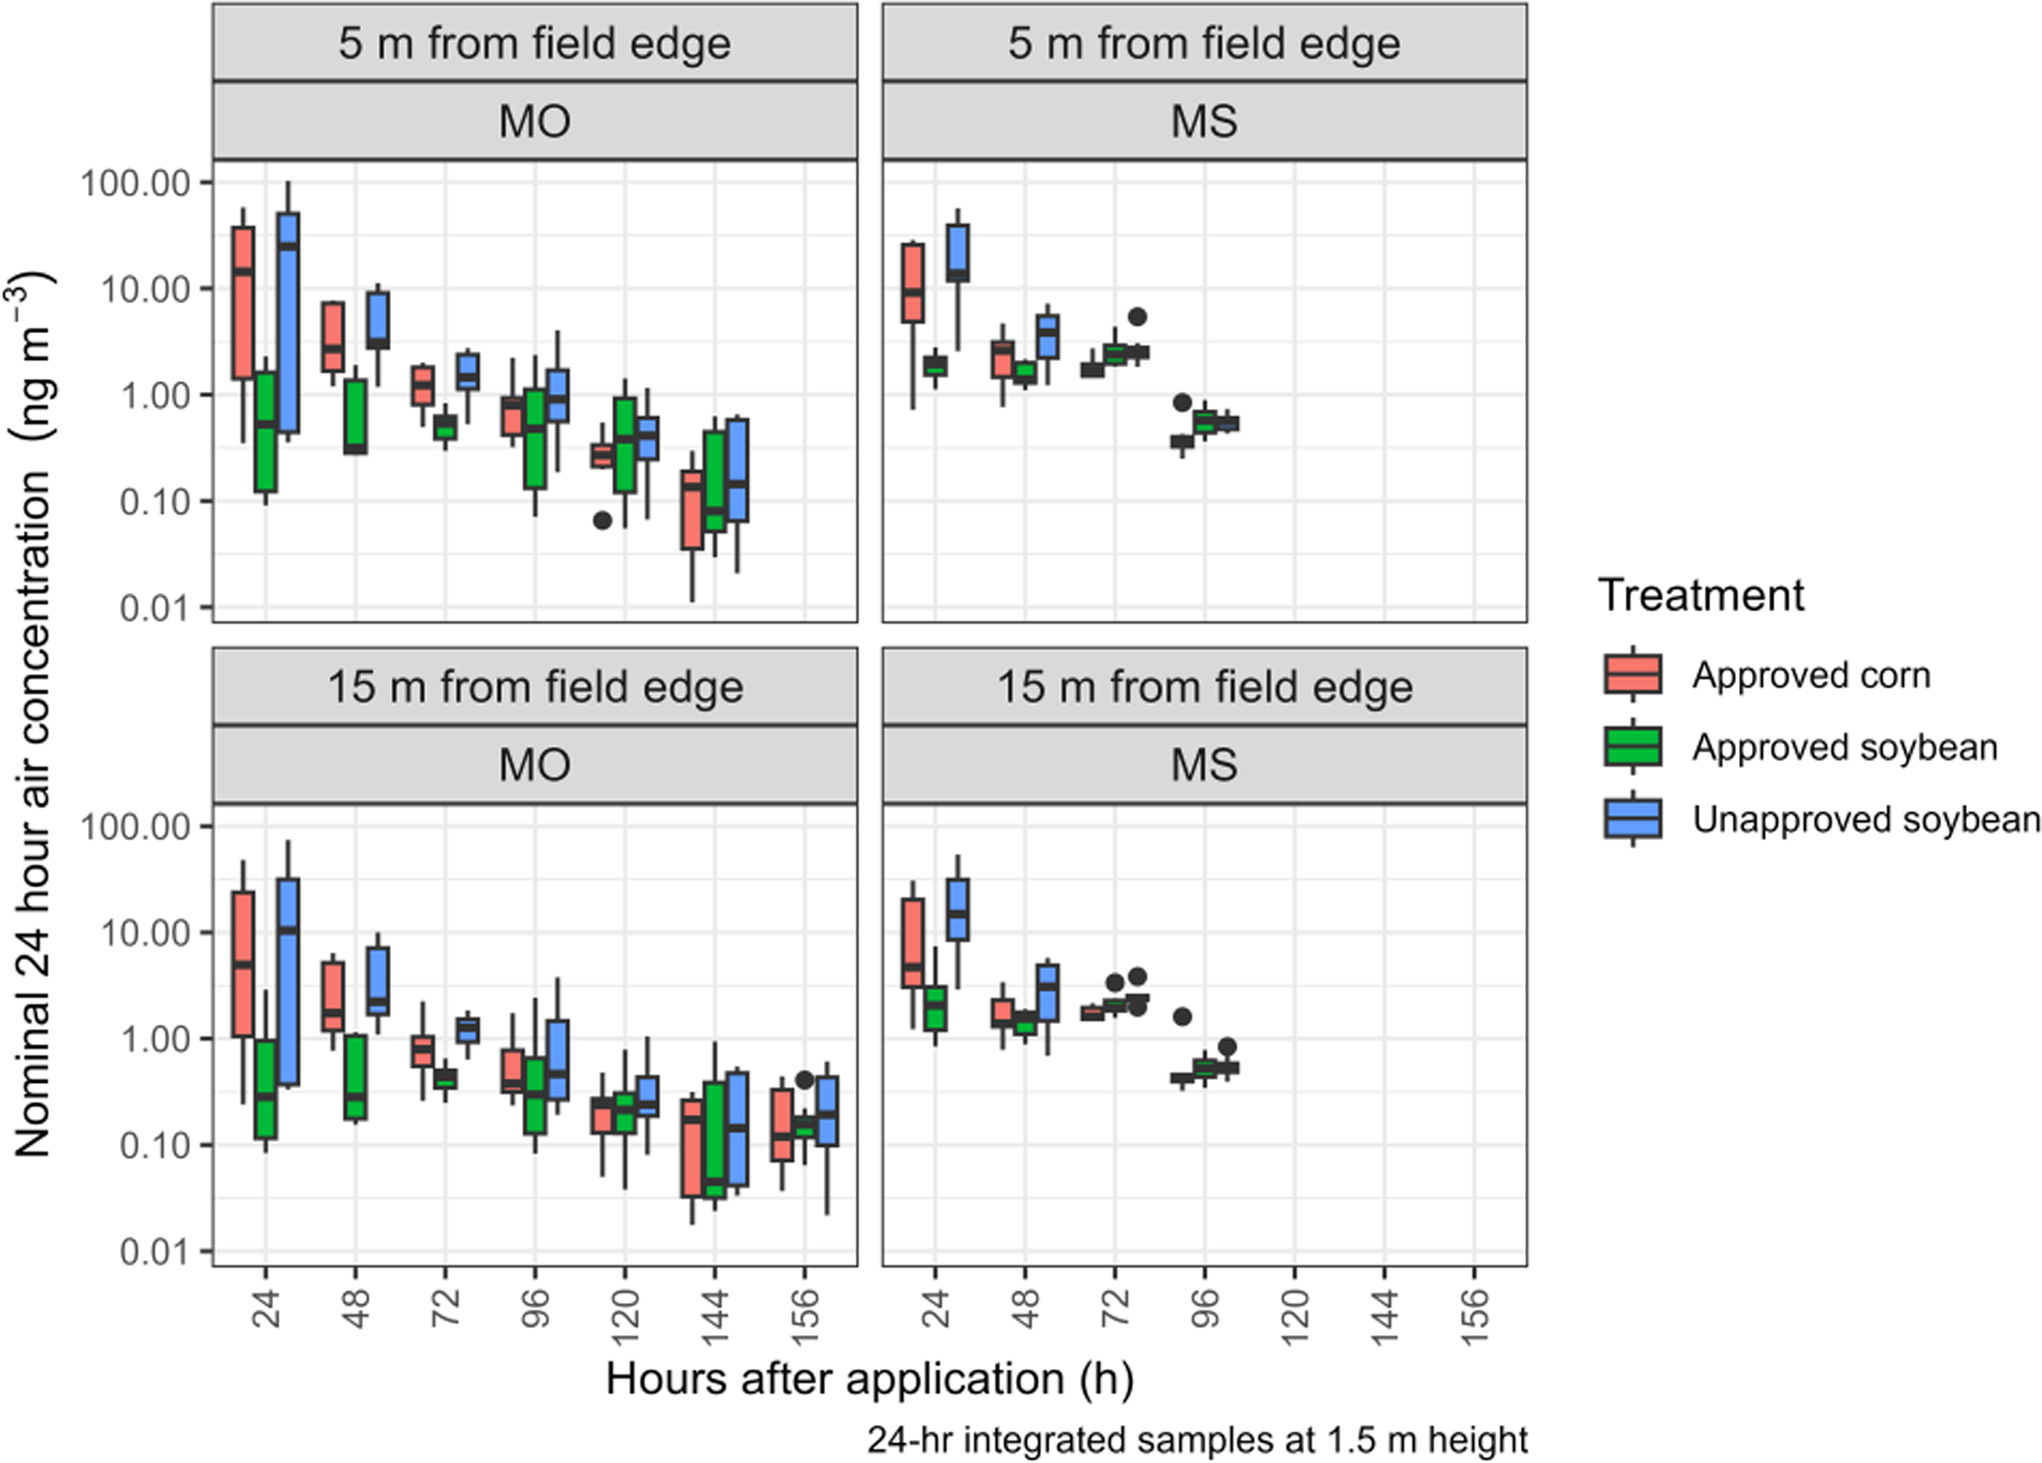
Similar to the in-field air concentrations, off-field 24-h dicamba air concentrations at 5 m and 15 m from the sprayed area showed a declining trend throughout the duration of the study at both locations (Figure 6; Supplementary Table S4). In period 1, which had the highest observed air concentrations, there were considerable differences between the approved corn, approved soybean, and unapproved soybean treatments. For example, at the MO location during period 1, air concentrations ranged from 0.1 to 164 ng m−3 (approved corn), 0.05 to 4.62 ng m−3 (approved soybean), and 0.07 to 247 ng m−3 (unapproved soybean). Regardless of treatment, however, air concentrations at off-field distances were lower than in-field air concentrations, likely due to atmospheric dispersion and diffusion processes.
Off-field nominal 24-h dicamba air concentration (ng m−3) measured at two distances from the field edge (5 m and 15 m) for three dicamba use patterns: approved corn (medium droplet size, higher boom height, DGA dicamba + K salt glyphosate + AMS), approved soybean (extremely coarse droplet size, lower boom height, DGA dicamba + K salt glyphosate with volatility and drift-reduction adjuvants), and unapproved soybean (medium droplet size, lower boom height, DGA dicamba + IPA salt glyphosate + AMS). Results are shown for dicamba applications at Missouri (MO) and Mississippi (MS) locations. Concentrations represent integrated 24-h sampling intervals at 1.5 m above crop canopy height. Box plots show distribution across eight cardinal sampling locations. The MS study was terminated after 108 h due to rainfall.

Figure 6. Long description
Panel A: A box-and-whisker plot showing nominal 24-hour air concentration of dicamba at 5 meters from the field edge in Missouri. The horizontal axis represents hours after application, ranging from 24 to 156 hours. The vertical axis represents the air concentration in ng m^-3, ranging from 0.01 to 100. The plot includes data for three treatments: approved corn, approved soybean, and unapproved soybean. Each box plot shows the distribution across eight cardinal sampling locations. Panel B: A box-and-whisker plot showing nominal 24-hour air concentration of dicamba at 5 meters from the field edge in Mississippi. The horizontal axis represents hours after application, ranging from 24 to 156 hours. The vertical axis represents the air concentration in ng m^-3, ranging from 0.01 to 100. The plot includes data for three treatments: approved corn, approved soybean, and unapproved soybean. Each box plot shows the distribution across eight cardinal sampling locations. Panel C: A box-and-whisker plot showing nominal 24-hour air concentration of dicamba at 15 meters from the field edge in Missouri. The horizontal axis represents hours after application, ranging from 24 to 156 hours. The vertical axis represents the air concentration in ng m^-3, ranging from 0.01 to 100. The plot includes data for three treatments: approved corn, approved soybean, and unapproved soybean. Each box plot shows the distribution across eight cardinal sampling locations. Panel D: A box-and-whisker plot showing nominal 24-hour air concentration of dicamba at 15 meters from the field edge in Mississippi. The horizontal axis represents hours after application, ranging from 24 to 156 hours. The vertical axis represents the air concentration in ng m^-3, ranging from 0.01 to 100. The plot includes data for three treatments: approved corn, approved soybean, and unapproved soybean. Each box plot shows the distribution across eight cardinal sampling locations.
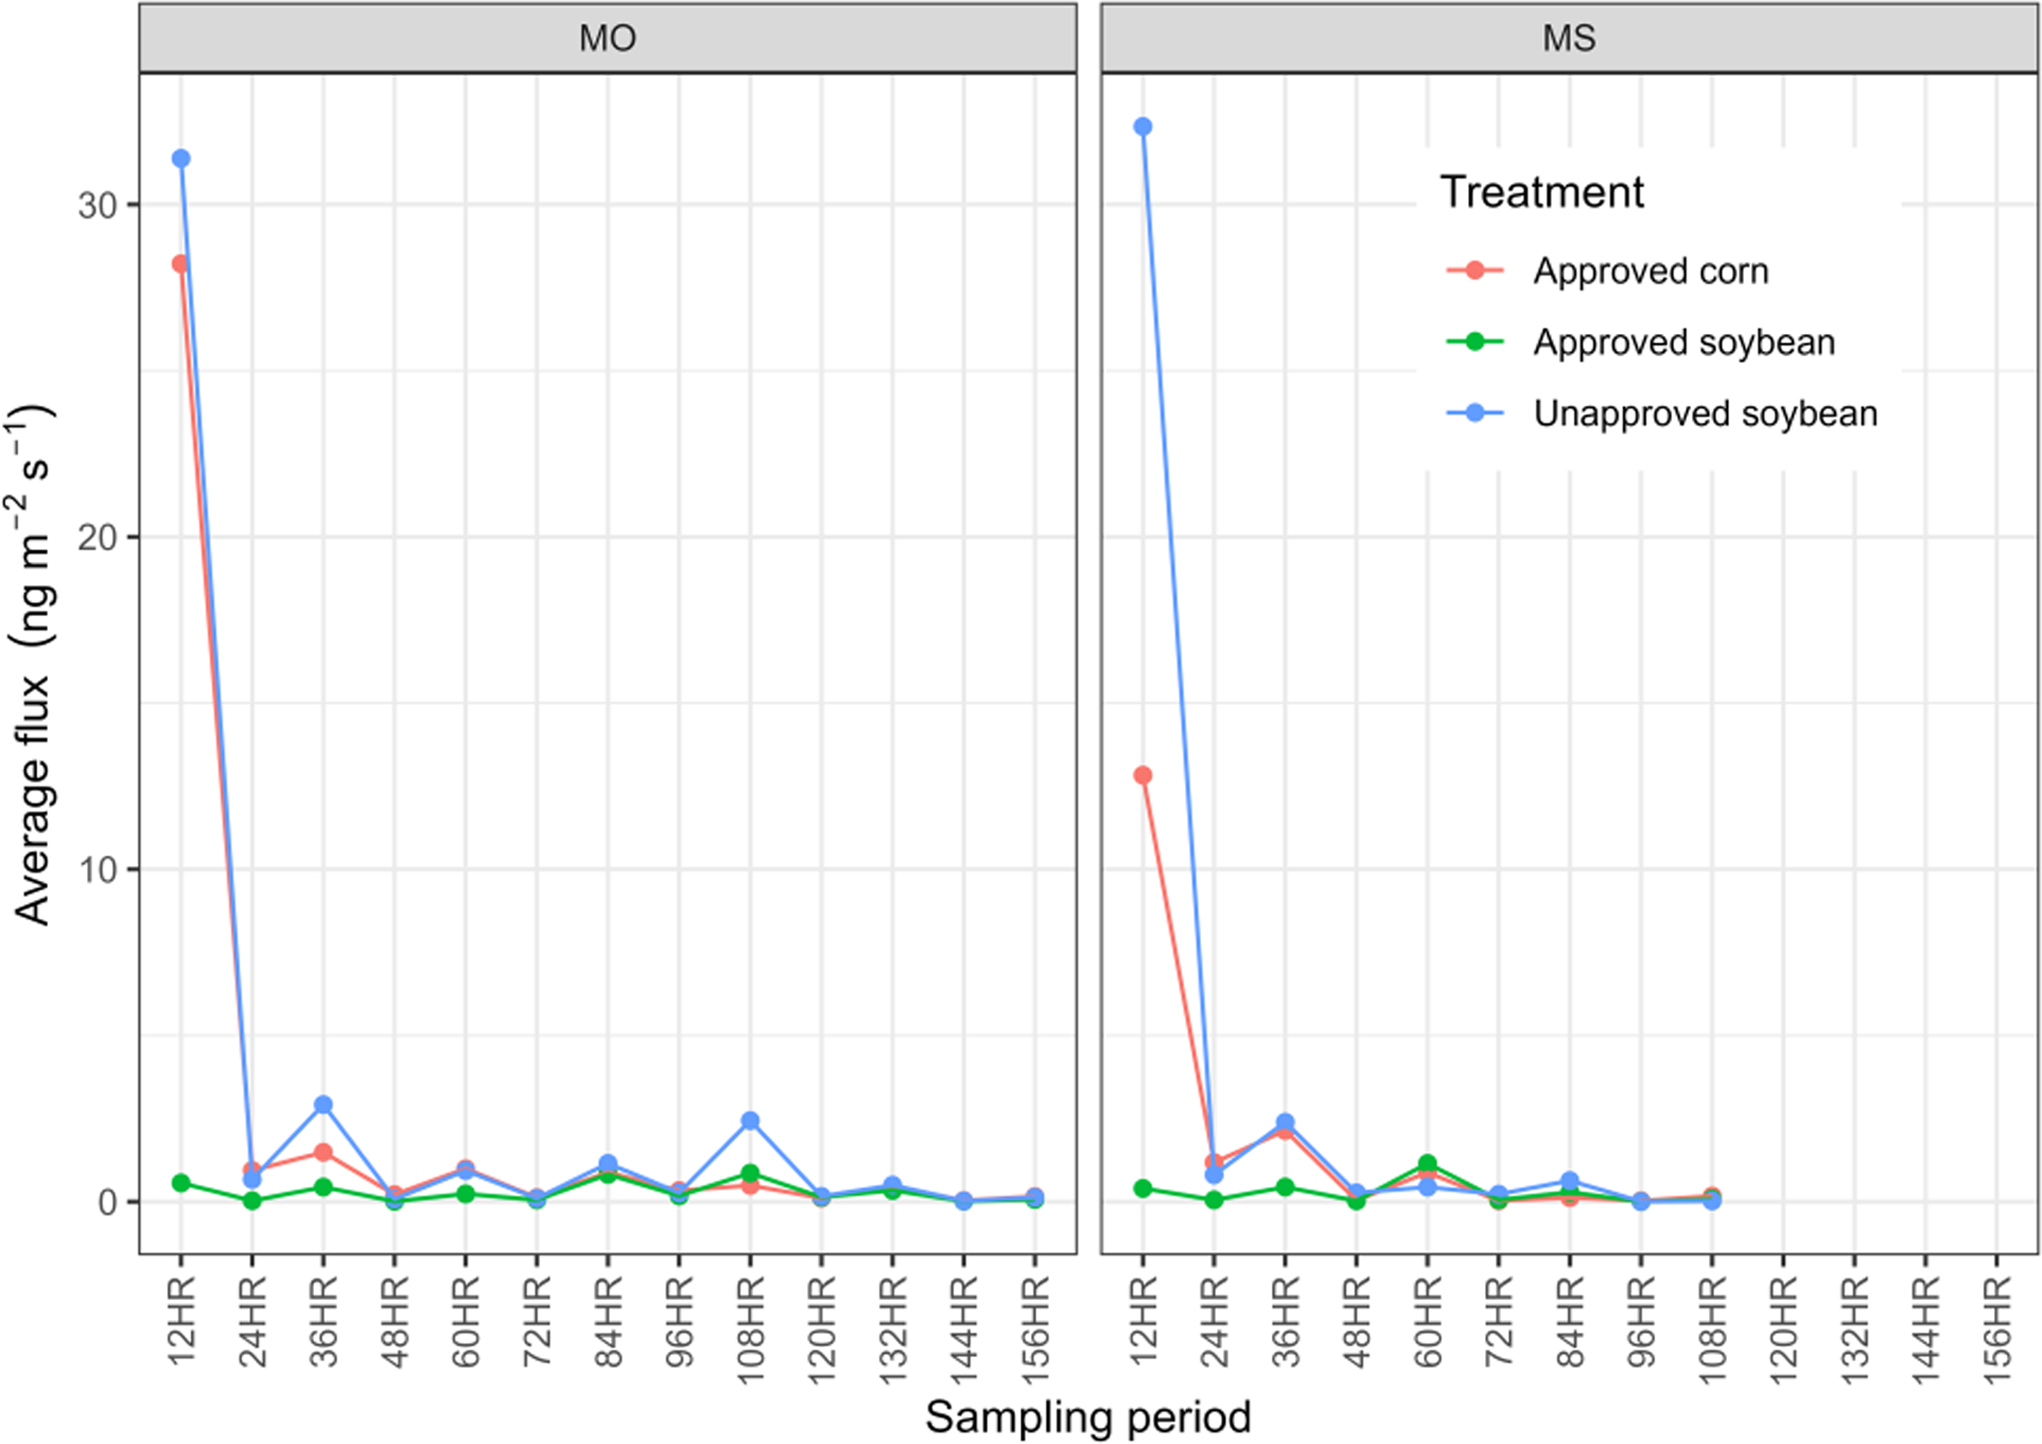
Due to the lower application rate in approved corn treatment compared with other treatments, flux rather than air concentrations provided a better measure for comparison. Flux was highest for the approved corn and unapproved soybean treatments in the first sampling period at both locations (Figure 7; Supplementary Table S5). The maximum average emission rates in MO for the approved corn and unapproved soybean treatments were 28.2 ng m−2 s−1 and 31.4 ng m−2 s−1, respectively. In contrast, the maximum average emission rate for the approved soybean treatment in MO was 0.86 ng m−2 s−1. Additionally, the maximum average emission rates in MS for the approved corn and unapproved soybean treatments were 12.8 ng m−2 s−1 and 32.3 ng m−2 s−1, respectively. In contrast, the maximum average emission rate for the approved soybean treatment in MS was 1.15 ng m−2 s−1. The higher emission rate from the approved corn treatment under these conditions is notable considering the application rate was half that of the soybean treatments. Following the first sampling interval, emission rates decreased and remained similar to the approved soybean treatment.
Volatile dicamba emission flux (ng m−2 s−1) over time following application for three dicamba use patterns: approved corn (medium droplet size, higher boom height, DGA dicamba + K salt glyphosate + AMS), approved soybean (extremely coarse droplet size, lower boom height, DGA dicamba + K salt glyphosate with volatility and drift-reduction adjuvants), and unapproved soybean (medium droplet size, lower boom height, DGA dicamba + IPA salt glyphosate + AMS). Results are shown for dicamba applications at Missouri (MO) and Mississippi (MS) locations. Emission flux represents the average of three independent estimation approaches (aerodynamic, integrated horizontal flux, and indirect modeling methods) derived from measured air concentrations and meteorological data. Sampling periods represent discrete intervals following application (hours after application), with initial intervals capturing peak volatilization. The MS study was terminated after 108 h due to rainfall.

The volatile flux from each sampling interval was then converted to mass of dicamba using the spray area and sampling duration. This volatile mass lost was expressed as proportion of the target application rate. The average maximum cumulative mass lost over the entire study duration was highest for the approved corn treatment (1.61% in MS and 3.08% in MO), followed by the unapproved soybean treatment (1.13% in MS and 2.23% in MO), and lowest for the approved soybean treatment (0.16% in MS and 0.22% in MO) (see Supplementary Table S5 for more information). The highest reported emission flux and cumulative mass lost in Sall et al. (Reference Sall, Huang, Pai, Schapaugh, Honegger, Orr and Riter2020), which evaluated 23 different dicamba volatility trials, were approximately 4 ng m−2 s−1 and 0.3% of applied, respectively. The values observed in the current study for the approved soybean treatments are below or within range of the 23 studies in Sall et al. (Reference Sall, Huang, Pai, Schapaugh, Honegger, Orr and Riter2020), but the approved corn and unapproved soybean treatments in these conditions are almost 10 times higher.
The exposure measured in these studies can be evaluated in the light of regulatory ecotoxicological endpoints. In the 2022 draft ecological risk assessment for all dicamba uses, the USEPA reported that a spray drift exposure of 0.57 g ha−1 (or approximately 0.1% of application rate of 560 g ha−1) could cause up to 25% reduction in the plant height (USEPA 2022). These types of endpoints inform the types of mitigations (e.g., downwind buffer) that might be needed as part of a registration review decision. If this endpoint is applied to the spray drift dataset, the results would indicate that the approved soybean treatment would require between 2.9 to 10.7 m downwind buffer, the approved corn treatment between 21.7 and 65.5 m, and the unapproved soybean treatment between 4.8 m and 52.8 m. Current dicamba product labels for postemergence soybean or cotton use in the United States require 73 m downwind buffer, while the other dicamba labels with permitted corn use do not require any buffer setbacks.
From a volatility perspective, USEPA indicated in its 2025 proposed decision for postemergence soybean and cotton approvals that a 24-h air concentration of 8.5 ng m−3 could cause up to 25% reduction in plant height (USEPA 2025). Comparing this endpoint with the off-field air concentration in the 24 h postapplication at 15 m from sprayed area shows several exceedances for the approved corn and unapproved soybean treatments, while the approved soybean treatments remain within this threshold. Overall, the results from this study suggest that the benefit of label measures in approved soybean uses for keeping dicamba off-target movement potential relatively low and emphasize the need to consider implementing these measures more universally across dicamba uses to ensure that this technology is utilized in a sustainable manner.
The tank mixes selected for this comparative experiment represent just one example of many possible dicamba combinations. The mix chosen for approved soybean reflects a standard formulation commonly used by the USEPA in risk assessments. In contrast, the mixes for the approved corn and unapproved soybean treatments are examples of potential options among numerous possibilities and represent worst-case scenarios for volatility potential. The use of AMS and IPA glyphosate in combination with XtendiMax® was prohibited on the XtendiMax® label due to known higher volatility of dicamba when combined in the tank mix (Sall et al. Reference Sall, Huang, Pai, Schapaugh, Honegger, Orr and Riter2020; Singh et al., Reference Singh, Barnes, Dintelmann, Bradley, Hager and Jhala2024); however, the combination of AMS and an IPA glyphosate product with dicamba is not specifically off-label on other dicamba product labels that are typically used on corn applications. In fact, according to USDA-NASS data from 2021, 44% of the total amount of glyphosate applied on corn that year was an IPA salt (USDA-NASS 2025). Conducting field volatility experiments for every possible mix is not practical. Future research could involve surveys to identify other commonly used tank-mix partners and employ laboratory-based screening methods to determine which combinations may exacerbate dicamba volatility.
Supplementary material
To view supplementary material for this article, please visit https://doi.org/10.1017/wsc.2026.10135
Acknowledgments
The authors would like to thank Brent Toth, Jacob Mitchell, and the team at Stone Environmental Inc. for their contributions to the field phase and Emily Vogl at Eurofins EAG Agroscience LLC for her contributions to the laboratory phase. We thank Dan Dyer, formerly with Bayer CropScience, for his contributions to the study design, conceptualization, and conduct of this research.
Funding statement
Bayer CropScience LLC funded this project.
Competing interests
All authors are affiliated with Bayer CropScience LLC.


 Open access

