I. INTRODUCTION
Tin oxide (SnO2) is one of good appropriate materials for electrical applications such as solar cells, Reference Snaith and Ducati1 gas sensors, Reference Rani, Roy and Bhatnagar2 optoelectronic devices, Reference Feng, Wang, Lu, Qi, Zhou, Xu and Yuan3 photocatalysis, Reference Wang, Sun, Zhang, Li, Chen, Wu and Yu4 etc.
SnO2 has recently acquired increasing attention in optical properties Reference Gu, Wang, Lü, Zhou, Xu and Yuan5,Reference Wang, Ma, Ji, Yu and Ma6 for the reason that the high transparency in the range of visible light and high conductivity. Reference Elangovan, Shivashankar and Ramamurthi7 Especially, compared to ZnO, SnO2 has wider band gap of 3.6 eV and upper exciton binding energy of 130 meV. Reference Wang, Sun, Zhang, Li, Chen, Wu and Yu4 Therefore, the SnO2 thin films have various applications in blue emission devices. The introduction of transition metals into the lattice of SnO2 makes it a good candidate for the applications mentioned above.
A number of studies on the influence of the Fe substitution in the SnO2 are reported. Fe3+ doped SnO2 has the advantage of a lower surface potential barrier than that of metals, which can be well exploited in the area of electron emission. Reference Cabrera, Navarro, Torres and Sánchez8 Adhikari et al. Reference Adhikari, Das, Karmakar, Rao and Ghatak9 observed antiferromagnetic behavior of 5% Fe-doped SnO2 nanoparticles prepared by chemical co-precipitation method. Chikhale L.P. et al. Reference Chikhale, Patil, Rajgure, Shaikh, Mulla and Suryavanshi10 synthesized thick films of undoped and Fe doped SnO2 by co-precipitation method. The resultant films showed nanocrystalline nature of undoped and Fe-doped SnO2 material, confirmed by XRD and TEM analysis. The structural and morphological studies indicate grain growth inhibitor role of Fe. Bhise A.B. et al. Reference Bhise, Late, Sathe and More11 prepared Fe:SnO2 wires by simple thermal evaporation. Their morphological and structural characterizations revealed wires with sub micron size and crystalline in nature.
Many reports have been published on doping SnO2 with various transition metal such as Sb, Cr, Co, Mn, and In doped SnO2 Reference Seo, Akutsu and Kagemoto12–Reference Caglar and Cemil Atar16 but only a few reports on Ni doped SnO2. Fe and Ni doped SnO2 nanofilms have been prepared by A. Sharma et al., Reference Aditya, Mayora, Shalendra, Verma and Ravi17 they observed room temperature ferromagnetism in formed films, and found the optical band gap energy decreases with increasing dopant content.
Several methods have been used to deposit SnO2 such as sputtering, Reference Vasiliev, Rumyantseva, Yakovlev and Gaskov18 hydrothermal method, Reference Shi, Bao, Cao and Qian19 chemical vapor deposition, Reference Tong, Dai and Gao20 sol–gel process, Reference Ang, Toh, Abu Bakar, Abdullah and Othman21 and spray pyrolysis. Reference Brinzari, Korotcenkov, Golovanov, Schwank, Lantto and Saukko22 Among these methods, sol–gel process has appeared as a promising technique for preparation of SnO2 thin films. The advantages of sol–gel process are low reaction temperature, uniformity of doping, easy deposition of thin films, and low cost.
In this study, we try to do a comparative study and determine the effect of Fe and Ni dopant on structural, morphological, and optical properties of SnO2. To exploit this study in the near future to prepare ethanol and acetone sensor based on (Fe, Ni) doped SnO2 and determine their impact on the sensing properties.
SnO2:Fe:Ni thin films were deposited on glass by sol–gel dip-coating method using metal salts SnCl2·2H2O, FeCl3, and NiCl2·H2O as precursors. The structural, morphological, and optical properties of SnO2:Fe:Ni thin films were examined in relationship with the variation in iron and nickel doping concentrations and variation in experimental parameters of sol–gel technique.
II. EXPERIMENTAL
Undoped and (Fe, Ni)-doped SnO2 films were deposited on glass substrate by sol–gel method using dip-coating technique. Glass substrates were cleaned as ultrasonic using acetone, ethanol, and deionized water before the deposition of the films. To obtain the sol, 8.37 g of the precursor tin (II) chloride dihydrate (SnCl2·2H2O) was first dissolved into 100 mL of absolute ethanol followed by a thorough stirring for 2 h.
Fe doped SnO2 films have been prepared by adding FeCl3·6H2O to SnCl2·2H2O and dissolved by ethanol. The amount of FeCl3·6H2O solution was suitably determined to obtain films with molar ratio SnO2/Fe equal to 1/0.01, 1/0.03, 1/0.05, 1/0.10, and 1/0.15 labeled 1, 2, 3, 5, 10, and 15%. The obtained solution was continuously stirred for 2 h. Ni doped SnO2 nanoparticles are obtained by repeating the same previous solution with addition of various amounts of NiCl2·2H2O to SnCl2·2H2O. The Ni content was 0; 1; 3; 5, and 10%.
Then the three solutions were stirred and heated at 60 °C for 2 h again. Finally, all mixtures were separately aged for 24 h at room temperature, a clear and homogeneous solutions was obtained. The cleaned glass substrates were plunged in these solutions, with rate of 4 cm/min. The deposited films was then dried at 200 °C and finally annealed at temperature of 500 °C for 60 min. The procedures from coating to drying were repeated 20, 10, 4, and 2 times. The conditions for undoped and (Fe, Ni) doped Sn films preparation used in the present study are summarized in Table I.
Preparation conditions of undoped and (Fe, Ni) doped SnO2 films.

The X-ray-diffraction patterns of samples were recorded by an X-ray diffractometer D8 Advance Bruker system (Seimens, New York, New York) using Cu Kα radiation (Cu Kα = 0.15406). The optical properties of the films were studied using A Jasko V-630 visible spectrophotometer (JASCO International Co. Ltd., Tokyo, Japan). The direct band gap (E g) of prepared films was obtained from the extrapolation of the linear part of the (αhν)2 curve versus hν and using the following equation Reference Bagheri-Mohagheghi, Shahtahmasebi, Alinejad, Youssefi and Youssefi23 :
 $${(\alpha h\nu )^2} = A\left( {h\nu - {E_{\rm{g}}}} \right)\quad ,$$
where α, E g, and hν are: the absorption coefficient, the energy gap and the optical beam energy, respectively and A is a constant.
Atomic force microscope (AFM) measurements were carried out using A100-AFM microscopy (Crisel Instruments, Rome, Italy).
III. RESULTS AND DISCUSSION
A. X-ray diffraction studies
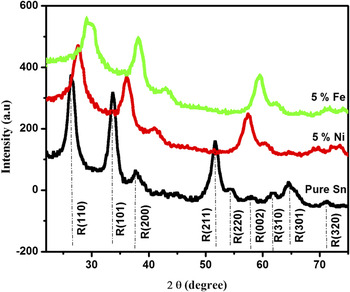
Figure 1 shows the XRD patterns of undoped and (Fe, Ni) doped SnO2 thin films. These spectra indicate that the samples have (110), (101), (211), (220), and (301) planes corresponding to SnO2 tetragonal rutile phase (JPDS 41–1445). Where all the peaks are assigned to rutile phase of tin oxide, which suggests that Fe and Ni atoms must be incorporated in SnO2 network. Reference Aditya, Mayora, Shalendra, Verma and Ravi17,Reference Vadivel, Arivazhagan and Rajesh24
XRD pattern of undoped and 5% (Fe, Ni) doped SnO2 thin films.

According to Scherrer equation:
 $$D = {{0.9\lambda } \over {\beta \cos \theta }}\quad .$$
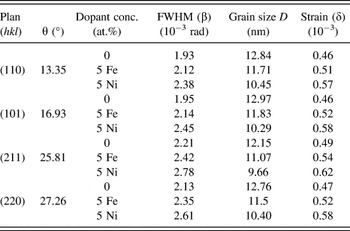
Where λ = 0.15406 nm is X-ray wave length, β is the full width at half-maximum (FWHM), θ is Bragg’s angle in degrees, Reference Patterson25 the grain size is calculated. XRD parameters and grain size for different crystallographic orientations are reported in Table II.
XRD parameters, grain size and strain for different phases of undoped and Fe-Ni doped SnO2 film.

A shift of the peaks toward superior angles for the samples with Fe–Ni dopants is observed in Fig. 1. Introduction of Fe–Ni dopants and the presence of oxygen vacancies in the crystal lattice of the material prepared, products strain in the films causing a shift in diffraction angle. Reference Nomura, Okabayashi, Okamura and Yamada26
At low level of doping, the dopant ions occupy substitutional sites in the SnO2 network. By against, increasing constraints from certain percentage (5% as in our case in Fig. 1) is interpreted by the saturation of the substitutional sites, which requires dopant ions (Fe and Ni) to occupy interstitial sites. This caused in changing in network parameters, which lead to a shift observed in Fig. 1.
Strain or stress (δ) of the thin films is estimated using the equation Reference Khan, Khan, Zulfequar and Khan27 :
 $$\delta = {{\beta \cos \theta } \over 4}\quad .$$
The effect of strain in the SnO2 films introduced by Fe and Ni dopants can be more explain from grain size (D) and strain (δ) given in Table II. For the samples with Fe–Ni doping concentration of 5 at.%, grains size decreases because of the increase of strain in the films that affects the normal growth of SnO2.
The solubility of dopants is mainly depended to valence state and ionic radii value. When this later is lower or equal to that of Sn [Sn (0.69 Å), Fe (0.64 Å), and Ni (0.69 Å)], the dopants replace lattice sites in place of Sn, lead to defects and lattice distortions in the crystal, and results different types and order of magnitudes of stress. A change in strain is also developed by the difference between the thermal dilatation coefficients of the thin film and the substrate (thermal strain). Reference Pan, Zhang, Tian, Cheng, Xie, Zhang, Zeng, Xiao, Hu and Wei28 Studies carried out by Refs. Reference Xu and Li29 and Reference Lee and Park30 indicated that dopant ions which have a larger radii than Sn lead to compression strain in the film and shifting of the peak toward smaller angle, in contrary, which have a smaller radii, result in tensile strain and shifting of the peak toward superior angle, which is similar to our result.
Non uniform strain distribution during the grain growth results a difference in shifting of the peaks. As seen from Fig. 1 the shifting of (211) peak is bigger than others peaks, this could be attributed to larger change of intrinsic strain in this plan as shown in Table II.
Our studies show that strains developed in the films are related to the deposit technique used, the nature of the substrate and the temperature of its heating during deposition, the nature and content of the dopant.
B. Surface morphology studies
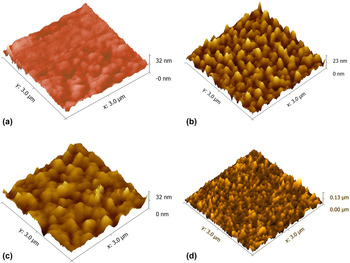
Figures 2(a)–2(c) show the AFM images adopted for undoped and Fe doped SnO2 films (1 and 5%) (10 cycles, 15 s). It can be observed that the surfaces of all the films seem to be dense, uniform, and without slots. Also note the distribution of the granules of different levels and measurements are equal in some ranges.
AFM images SnO2:Fe:Ni thin films (10 cycles, 15 s) heat treated at 500 °C of (a) Sn pur, (b) 1% Fe doped Sn, (c) 5% Fe doped Sn, and (d) 1% Ni doped Sn.

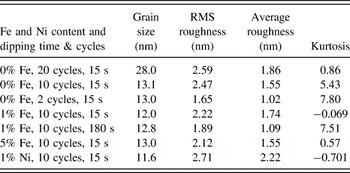
The average grain size and RMS roughness of Fe-doped films (0; 1, and 5% Fe content) are: (13.1 and 2.47 nm), (12 and 2.22 nm), and (13 and 2.12 nm) respectively.
The RMS roughness (Root Mean Squared) is found to decrease with increasing the Fe content, the similar behavior obtained by Ref. Reference Tariq and Karrar31.
It can explain the decrease in roughness by the different kinetics of Fe dopant atoms and Sn atoms on the film surface at a given temperature. Reference Lekshmy, Daniel and Joy32
The characterizations of the film surface were also estimated by average roughness parameter (R a), and kurtosis as given in Table III.
RMS roughness, average roughness, and kurtosis of SnO2:Fe:Ni films for various Fe and Ni doping concentrations and different dipping cycles and time.

From the data obtained, the values of these parameters are in agreement with the literature and often lower than that reported by Refs. Reference Moure-Flores, Guillén-Cervantes and Nieto-Zepeda33 and Reference Demet and Bahattin34. It may be due to the different processing technique, which has a great effect on the surface roughness. For Kurtosis parameter by definition is a dimensionless factor, very related to the shape of the distribution. When the Kurtosis parameter is greater than three, the distribution will have relatively higher numbers of high peaks and low slots. Reference Lekshmy, Daniel and Joy32 As shown in Fig. 2(a), Kurtosis variations are larger than 3 for pure Sn, which imply that the surface height distribution does not follow a Gaussian distribution and there are relatively abrupt surfaces, but samples with 1 and 5% Fe doped Sn [Figs. 2(b) and 2(c)] theirs Kurtosis parameter is lower than three.
Figures 2(a), 2(b), and 2(d) exhibits the AFM images for undoped and doped SnO2 films with 1% Fe and 1% Ni (10 cycles, 15 s).
It can be seen that RMS roughness decreased from 2.47 nm for pure Sn to 2.22 nm for Fe doping by against, it increases to 2.71 nm for Ni. The variation of the roughness can be caused by different kinetics of Fe and Ni required for the growth of these particles.
Obtained data AFM reveals that the roughness of the film is dependent on the type of dopant and their content.
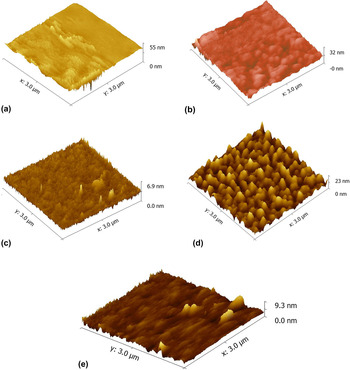
To study the effect of film thickness product by changing the number and time of dipping; is presented by AFM images for undoped and Fe doped SnO2 films shown in Figs. 3(a)–3(e).
AFM images of pure & Fe doped SnO2: (a) pure Sn, 20 cycles, 15 s, (b) pure Sn, 10 cycles, 15 s, (c) pure Sn, 2 cycles, 15 s, (d) 1% Fe doped Sn, 10 cycles, 15 s, and (e) 1% Fe doped Sn, 10 cycles, 180 s.

It can be noted that the grains in the undoped film seem less dense. With iron, they appear to be more intense. The deposited films show different surface roughness, which seems to be strongly dependent on dipping conditions (cycles and time). The grain size, RMS values, average roughness, and kurtosis are summarized in Table III. When the dipping time is fixed, the grain size increases slightly with the decrease in the number of dipping cycles for pure Sn. On the other hand, if the number of cycles is fixed, the grain size increases with dipping time as shown in Table III.
The obtained values of grain size from AFM data are in agreement with that of XRD data.
C. Optical properties
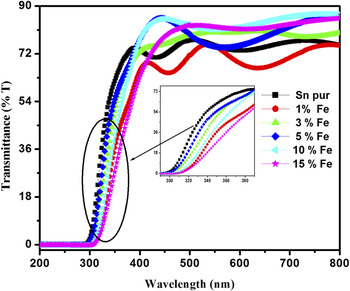
Figure 4 shows the transmittance spectra of the undoped and Fe doped SnO2 films. The tin oxide has a strong absorption in the ultraviolet range. However, in all visible regions, the SnO2 thin films have a high transmission, which is characteristic of the intrinsic SnO2.
Transmittance spectra of 0, 1, 3, 5, 10, and 15 mol% Fe, in SnO2:Fe thin films.

The undoped film shows transmittance more than 75% at wave length of about 380 nm. The transmittance falls to about 70% for 1% Fe doped SnO2, then it increases with Fe-dopant concentration to reach 88% for 10%.
Figure 4 also shows that the pure Sn and films doped with 0, 1, and 5% have more interference oscillations compared to the other ones, indicating an increase in the film thickness. Reference Khodja, Touam, Chelouche and Boudjouan35,Reference Martinez, Perez, Delgado and Angel36
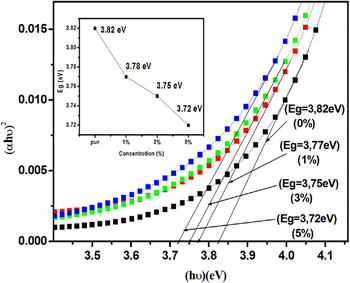
Figure 5 presents the variation of (αhν2) versus hν for undoped and Fe doped SnO2 and inset presents the variation of energy gap (E g) with Fe content. It is seen that by increasing the Fe doping content, energy gap decreases from 3.82 to 3.72 eV. This reduction may be due to Fe impurities which led to the formation of donor levels inside gap energy near the conduction band; these levels will absorb low energy photons, and thus introducing a red shift in the absorption edge. Reference Adawiya, Khalid and Khaled37,Reference Shajira, Junaid Bushiri, Nair and Ganesh Chandra38
Plot of (αhν)2 versus photon energy of undoped and Fe-doped SnO2 films; inset: The variation of the Gap energy with Fe content.

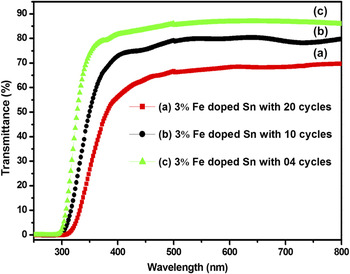
Figure 6 shows the transmittance spectra of 3% Fe doped SnO2 films prepared at different number and time of dipping. The film with 4 cycles and t = 240 s shows higher transmittance reaches 85% at 380 nm wave length. From these spectra, it is obvious that the transparency varies with the thickness of thin layers which is controlled by the number and time of dipping.
Transmittance spectra of 3 mol% Fe with 20, 10, and 4 cycles.

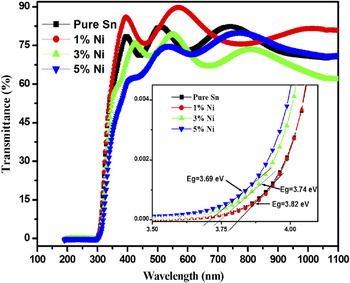
The transmittance of undoped and Ni doped SnO2 is shown in Fig. 7. The average transmittance is about 77–88% in visible region. The graph shows that 1% Ni doped Sn has high transparency than other samples.
Transmittance spectra of 0, 1, 3, 5, and 10 mol% Ni, in SnO2:Ni thin films.

According to Reference Lee and Park39–Reference Salaken, Farzana and Podder41 the lower transmittance in Sn-doped films may be due to the increase in optical scattering caused by rough surface morphology. In other words the integration of Ni ions creates stresses in the films which cause the structural defects in the films. This leads to increase in the photon scattering from the defects produced by doping. Note the high value for the roughness of Ni in Table III.
With 3 and 5 at.%, crystalline quality is degraded resulting in decrease of transmittance. This has a beneficial effect for optoelectronic applications. Reference Muiva, Sathiaraj and Maabong42
The band gap E g is given in inset, as seen in this figure, the E g values of SnO2 thin films decreased with Ni doping from 3.82 to 3.69 eV.
E g value of 10% Ni doped SnO2 is always lower than that of pure SnO2 but higher than other concentrations (3.78 eV). This decrease in the gap with the doping level is mainly due to distortion produced in the lattice due to the introduction of impurity. For more details this decrease can be explained by the creation of deep levels in the gap, which modify the crystal potential and leads to a reduction in the band gap energy, because of the increasing number of free carriers.
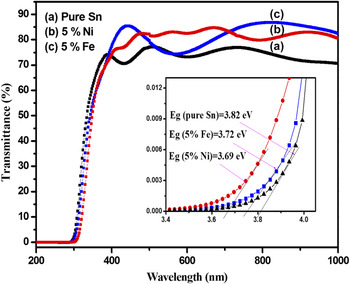
Fig. 8 shows transmittance spectra of pure SnO2, 5% Fe doped SnO2, and 5% Ni doped SnO2. Transmittance of doped SnO2 is higher than that of pure film, and reached a maximum value of 87% for Fe dopant.
Transmittance spectra of undoped and 5% (Fe, Ni) doped SnO2 thin films.

The decrease in the band gap of Fe, Ni doped SnO2 films may be due to substitution of Sn4+ by Fe3+ and Ni2+, resulting in the creation of holes, the dopants atoms located in interstitial sites in the lattice.
IV. CONCLUSION
Highly transparent undoped and Fe doped SnO2 thin films have been deposited on glass substrates by sol–gel dip-coating, using ethanol, stannous chloride dihydrate, iron trichloride, and nickel dichloride based on precursor solution. Effects of the experimental conditions and (Fe, Ni) content on the structural, morphological, and optical properties of the SnO2 films were investigated. XRD studies indicate that the undoped and (Fe, Ni) doped SnO2 have grown at cubic and rutile phases. The crystallite size calculated from the Scherer formula suggested the formation of nanoparticles. The surface morphology of the deposit materials have been studied by using AFM. The size values of the particles obtained from AFM analysis and XRD data are close. RMS roughness found to be strongly dependent on dipping conditions (cycles and time), and their values decreased with increasing Fe doping concentration and increased with Ni content. UV–Vis transmittance measurements have shown that our films are highly transparent in the visible wave length region, with an average transmittance of ∼88% which makes them suitable for sensor applications and optoelectronic devices. The optical band gap decreases from 3.82 to 3.72 eV with increase in Fe3+ and from 3.82 to 3.69 eV with Ni content.
ACKNOWLEDGMENTS
This work was supported by Active Components and Materials Laboratory, University of Oum El Bouaghi, Algeria. The authors are grateful to G. Brahim of Biskra University, Algeria, and G. Nadia of OEB University, Algeria for their help in using the X-ray diffraction and Atomic Force Microscopy.