


Why study the British hereditary aristocracy? Although retaining some noble privileges ranging from trivial titular rights to the more significant constitutional entitlement of membership of ninety-two peers in the House of Lords, the hereditary aristocracy is popularly perceived as historic relics shorn of wealth, power, and status, lacking even a coherent group identity.Footnote 1 Academic writing on this group flourished during the 1960s to the 1990s, with major works by F. M. L. Thompson, W. D. Rubinstein, M. L. Bush, J. V. Beckett, Peter Mandler, and, most prominently, David Cannadine.Footnote 2 Yet the past three decades have seen few published articles on the British aristocracy and, with the exception of that by Ellis Wasson, no major monographs.Footnote 3 This sudden quiet after Cannadine leaves the impression that the theses embodied by these scholars is the settled last word on the matter. Consequently, there seems little point in devoting scholarly attention to a group whose decline has been well charted by eminent historians and which is of minor contemporary relevance.
We suggest, however, that there are three reasons to continue studying the power, status, and wealth of the British aristocracy since the nineteenth century. First, serious students of the aristocratic decline literature are faced by as yet unresolved views on the trajectory of aristocratic wealth, the focus of our article. For example, should they follow the tone of Cannadine in seeing a relentless drop in aristocratic fortunes, which chimes with the strong note on which Beckett finishes? Or should they follow the broad position of Thompson and Bush, who place some emphasis on aspects of persistence and resilience?
Certainly all sides accept that aristocratic decline began in earnest in the 1880s with the combination of a collapse in agricultural prices beginning in the 1870s,Footnote 4 along with the Reform Acts,Footnote 5 followed by the dispersal of aristocratic landed holdings on which the aristocracy's character, status, and power rested,Footnote 6 exacerbating anti-aristocratic changes in the wider culture and media.Footnote 7 The two world wars are seen ambivalently as a cultural opportunity for aristocratic leadership and sacrifice, and as specifically problematic for the aristocracy in the amount of human sacrifice they endured.Footnote 8 Whereas sometimes the loss of landed wealth is viewed as cause of the decline, at other times it is the commitment to maintain landed holdings that is treated as a problem, since those holdings yield little wealth, are easy to tax, and are part of an anachronistic status culture incompatible with late modern capitalism. Finally, taxation is often treated not as a primary cause but as the final nail in the coffin—the ever-increasing taxation of estates, especially through death duties from the 1890s onward, undermining the already weakened and demoralized aristocracy. Thompson, however, suggests that from 1880 to the First World War, the aristocracy made a series of canny adjustments to the pressures of industrial capitalism but thereafter has struggled,Footnote 9 while Bush argues that the beneficial effects of policy-driven “escape hatches,” including the National Trust, funds for the maintaining of estates, and tax reliefs offered by all governments, as well as an “inclination to honour the affluent” along with the rise in the value of land, see this group persist as part of the plutocracy well beyond the middle of the twentieth century.Footnote 10
It is difficult to arbitrate between these positions because of the second difficulty and reason to revisit the debate: inconsistency of the data, which generates imprecision of explanation on the one hand, and on the other, the capacity to see evidence supporting both a decline thesis and a persistence thesis at the same time. This ambiguity comes about because the proportions of those who prosper relative to those who do not are unclear; so too is who does the prospering versus who does not, by how much, and when this decline or prospering occurs. The student of decline is left struggling to integrate minority counterexamples into the broad tone of decline or persistence.
Consider, for example, those who argue more strenuously for decline, such as Cannadine. More than four hundred pages into his book Decline and Fall of the British Aristocracy, detailing this economic deterioration, Cannadine introduces the claim that an unstated proportion of the super-rich sustained themselves through the twentieth century via diversification, and he then states that these survivors could not be thought of as aristocrats and were losing their identity in an “irreversible fragmentation.”Footnote 11 Or again, toward the end of his book, he repeats that “a small number of grandees remain[ed] quite extraordinarily rich” in the 1970s, led by the top dukes who still owned considerable land.Footnote 12 But he does not indicate what this “small number” might refer to, let alone the number of aristocrats more generally. For those who do not prosper, Cannadine offers examples of some selling homes and estates while others tenaciously hold on to unclear proportions of those estates, of decay but not of extinction, of an unstated proportion of the aristocracy becoming “indistinguishable from many other upper-middle-class professionals.”Footnote 13 Finally, there is the uncertain group of nouveaux pauvres who have very little indeed.Footnote 14 Four years later, Cannadine settled on the notion of a fragmented aristocracy with the super-rich able to “survive unscathed from the nineteenth into the twentieth century,” in this case in relation to the question of debt, while the poorer sort do not.Footnote 15 Yet even here we do not know how far into the twentieth century this occurs, how rich one has to be to prosper, how many of the rich prosper, or even what “not surviving unscathed” entails. This miasma of uncertainty prevents the reader from getting to the facts of who declines, by how much, and when. Not only does Cannadine's vagueness undermine confidence in causal explanations of the aristocracy as a whole and its component parts but it also obscures his basic thesis. Undoubtedly, however, the language and the vast majority of examples throughout the book lean the reader toward an argument for significant consistent broad decline in wealth and power to a state of fallenness.
Equally, if we turn to Beckett's Aristocracy in England, we see him state that “a great many families could not make ends meet,”Footnote 16 only to quickly state that many borrowed to invest and this debt often caused further hardship, though few went bankrupt—all again without a clear sense of proportions or degree of economic impact.Footnote 17 Between 1917 and 1921, “one-quarter of the land of England must have changed hands”Footnote 18—but hard on the heels of this claim, Beckett states that in 1980, 50 percent of large landowners “still owned all or a substantial proportion of the core estate in the family's possession a century earlier.”Footnote 19 He then details the growth in sales based on financial difficulties sparked by the agricultural depression of the 1870s and exacerbated by everything from the People's Budget of 1909 to the capital transfer tax of the 1970s.Footnote 20 His general thrust is certainly one of decline, but amid the welter of causes and exemptions, it is difficult to fully grasp what is going on.
Turning to scholars who lean toward a greater persistence, consider Thompson, who states that “the universality of the [late nineteenth-century agricultural] depression and its severity have been much exaggerated in the past, and the period in fact emerges as a continuation.”Footnote 21 But this claim follows closely on the argument that “many landowners found that their agricultural incomes fell steeply in the fifteen or twenty years after 1878, sometimes by as much as half,” while the cost of living did not.Footnote 22 We also see Thompson argue that by the 1920s there was a deeply undermining loss of aristocratic income from the ownership of land that yielded only 3 percent as compared to securities at 7–8 percent, and upon which rents were taxed as income, and in which a quarter of private land had changed hands, largely in the direction of tenant farmers such that many aristocrats sold their land.Footnote 23 Here again, it is unclear to whom this is happening and by how much they are affected, for good or for ill. Indeed, Thompson says that of these landowers’ nonagricultural income we know very little, “but their dividends presumably fell away after 1929” and “mineral incomes also presumably suffered.”Footnote 24 Equally, Thompson's later articles on twentieth-century persistence offer alternating evidence,Footnote 25 and, again, the proportions, timings, and characteristics of the super-rich are left so unclear that we are held back from developing conceptual and factual precision regarding this group and how far the persistence of the aristocracy really extends in time, community, and degree.
Even Bush, the most willing to argue for the persistence of aristocratic wealth and perhaps most clear in his timings, suffers from this imprecision that clouds analysis. For example, following World War I, “the English aristocracy did not become impoverished as a group. Many of its members, especially peers and baronets, remained part of the rich. Several families even preserved the traditional aristocratic way of life until the second world war when heavy taxation and the absence of servants delivered the coup de grâce.”Footnote 26 But to whom Bush is referring is vague enough that once again we are unable to define how far this persistence really extends in time, community, and degree.
A great deal of the power of work on the British aristocracy and peerage is precisely in the great range of evidence and detail cited by each writer, which we can barely touch on here, but it is also what leads to confusion. If we focus on the question of timings, the literature leaves us with several central questions. Was the greatest decline at the end of the nineteenth century or between the wars? Did the drop continue after World War II, or even intensify? To what extent did the improvement in land values really affect the fortunes of the aristocracy, and for how long? How does aristocratic wealth today compare with its level between the wars or in the nineteenth century?Footnote 27 Equally, if we focus on the composition of the aristocracy, in the many asides that are made regarding the resilience of the wealthier sort, we have little sense of what characteristics the wealthier sort possess, how economically resilient they are, and how prevalent the group is over what time frame. Many unanswered factual questions remain that can only be addressed by further research. Our intention is to establish such facts, at least in terms of one comprehensive and consistent type of evidence—probate wealth—and then to evaluate and reconstruct existing accounts in light of this material.
Detailing the trends and timings of changes in aristocratic wealth more accurately through a consistent form of data can bring into more precise focus the character and structures of this decline and persistence; it might also lend support to some mechanisms of decline postulated by the historians under consideration and contradict others. It will become possible, we suggest, to arbitrate between the role of capitalist globalization, wealth taxation, the rise of plutocrats, and the effect of war more effectively, though this clarity will come at the cost of a loss of the historiographical richness upon which current scholarship largely stands. In simple terms, if the first reason to revisit the question of the British aristocracy is to establish some key facts and components of their decline more securely, the second is to ask which factors appear to correlate with and perhaps explain the observed decline, and which do not, as well as to bring into focus different features of the aristocracy.
The third reason to revisit the debate is that the capacity to answer some of these questions has improved as cognate disciplines have made significant progress in related topics such as the transition from oligarchic to democratic rule, the historical persistence of educational advantage, the evolution and concentration of capital, and the history of economic inequality.Footnote 28 Concepts, analytic techniques, and findings from these studies might be co-opted to improve historical understanding of aristocratic decline in Britain. In a nutshell, we can ask whether methods other than those used by most historians in their consideration of the aristocracy reveal new, more secure facts and explanations about its condition and character.
To address these issues, we constructed a consistent empirical framework for measuring one key feature of aristocratic decline: their reduction in wealth. We did this applying the most established means of identifying individual wealth—probate—to one key subgroup of the aristocracy, the hereditary peerage.Footnote 29 We argue that although there has indeed been a decline in the wealth of this group, some adjustments need to be made to existing views. First, the precise degree and rate of that decline has never been identified, nor has it been identified for different components of the peerage. We provide a clearer and more detailed account. Second, we show that the timings of the decline are significantly different from most previous accounts, and we indicate different primary reasons for it. Third, we suggest we may in fact be witnessing a resurgence in this wealth. Fourth, we find that older, more status-grounded titles fare no better or worse than recently created or business-grounded titles. Fifth, we find that younger, richer titles were no more resilient than less rich, older titles. As a preliminary conclusion to further work, we take all this to indicate that neither status nor sheer initial wealth is, at first glance, significantly related to the persistence of wealth; nor was the agricultural depression of the 1870s as significant a factor in this decline as historians have suggested. Rather, we suggest that members of the peerage were, and remain, rational economic actors, and external factors of concerted and committed taxation regimes and war are the primary factors influencing aristocratic wealth.
Existing Methods
Before outlining our empirical approach, we summarize the methods that can be extracted from the tapestry that Cannadine and others weave:
1. A complex and undoubtedly rich and extensive series of family-focused case studies, some superficial, some in detail and depth, largely outlining declining wealth as well as confidence, political influence, status, and glamour.Footnote 30
2. Some general data taken at second hand of, for example, the number of deaths during World War I, or the number of landless aristocrats, or broad data as to the character of the British economy. These facts are rarely presented in detail, used in a consistent way, or presented as having a specific effect, let alone a time-identified quantifiable effect.
3. Some rather impressionistic and idiosyncratic second-hand sources, such as newspaper articles, fiction, and commentary in letters by prominent figures. These sources are typically held to express the general attitude toward, or indeed facts about, the position of the aristocracy. Thus, we see such examples as hostile editorials, journalistic commentary on land sales from the Estate Gazette, novels, speeches in Parliament, and open and private letters of complaint by aristocrats of their financial burdens.
4. Various specific events or further case studies at a social or national level that are treated as part of the causal impact on the decline—for example, specific references to legislation or budgets.
This work's persuasive power comes from the sheer weight of examples acting as confirming instances of a broadly coherent narrative yielding a powerful story of the decline and ultimate fall of the aristocracy, notwithstanding the persistence of the ill-defined super-rich, due to the globalized industrialization of the economy, the growth of democracy, and the end of the culture of deference that began with a vengeance in the 1880s, a narrative that would have been very difficult to develop without these exploratory methods. But how sure can we be of the character and extent of this decline it if it is based on such a multitude of instances? And how sure can we be of the causes if there is no consistent and clear evidence of the timings of the putative causes and the decline? And how can we place the alternative evidence and associated thesis that some of the aristocracy were more resistant to this decline?
These problems are almost entirely questions of evidence. We note Thomas Piketty's significant incursion into the field of wealth analysis in his 2014 Capital in the Twenty-First Century, when he comments that the central weakness of much writing on this topic is that, in such a highly contentious and politically charged arena, “without precisely defined sources, methods, and concepts, it is possible to see everything and its opposite.”Footnote 31 The solution in his own work is to establish consistent and comparable sources of data over the long term. Equally, Rubinstein finds that when considering questions of wealth and elites, “it is regularly the case that an application of searching data to a commonly received opinion reveals it to be unsustainable, often based on quite confused thinking and incorrect tacit assumptions, as well as upon quite inadequate evidence . . . and it is the massing of far-reaching evidence in a cogent way which alone makes useful generalization possible.”Footnote 32 It is too easy to find evidence supporting any thesis one wishes in a field as data rich and ideologically charged as wealth and power.Footnote 33
Hence our interest in probate. Although probate has its limitations (discussed below), it allows for a more general and consistent measure of wealth than the necessarily varied and partial facts of exploratory historiography of the sort applied in this field, which, moreover, is susceptible to influence by outliers or the self-selecting samples of those very few families that have left detailed records, accounts, and diaries. Probate does not demand that we slowly build up a picture of wealth from a range of different sources, many of which make comparison and evaluation difficult. How secure can our evidence be if, for example, we use a newspaper report on the wealth of a specific peer, the letter of another peer complaining of financial pressures, the sale of the family estate by another, and the opening to the public of an estate by yet another? A picture might emerge, but it will tend to imprecision, and its generalizability will be suspect. Probate allows us to track shifts in the wealth of an entire cohort with consistency and precision allowing for comparison and generalizability. Probate is also more independent of the researcher who does not choose sources or interpret these to the same extent as, say, looking for letters preserved in the public realm, or gaining access to the self-curated archives of a specific estate, or citing occasional newspaper commentaries on an individual's wealth. Thus, probate makes it more possible to identify not only genuine trends in aristocratic wealth but also notable shifts in this wealth in order to take the first step to secure explanation—identifying correlations between those shifts in wealth and external events within identifiable time periods. Moreover, it allows us to drill down into the cohort to identify consistent differences within it: How do old versus new titles fare over time? What is the initial wealth of new titles at different periods? All of this will allow for the refinement of any thesis regarding the fortunes of a group and the increased security of the causal explanations or mechanisms of those fortunes.
Having suggested the initial value of using probate as a measure of wealth, before we look at debates as to its limitations, we lay out to what this analysis of probates can contribute: the arguments and evidence from the existing literature as regards the nature and causes of the decline in the wealth of the aristocracy.
Existing Theses and Evidence
The most famous and comprehensive analysis of the British aristocracy is no doubt Cannadine's, whose argument is that “the unmaking of the British upper classes . . . begins in the 1880s,” despite their being “in charge and on top in the 1870s,”Footnote 34 and that by the 1930s their loss of land, wealth, and prestige “must rank as one of the most profound economic and psychological changes of the period.”Footnote 35 Indeed, Cannadine states, “In strictly economic terms, there can be no doubt that the British patricians were a failing and fragmenting class in the years from the late 1870s to the late 1930s.”Footnote 36
Cannadine's tone is clear: despite some ups and downs, this period sees a massive collapse in the aristocracy's wealth, status, and political influence. What is the evidence, and with it, the proposed causal mechanisms or significant contributing factors to this decline and fall? Cannadine and others argue that the development of global industrial capitalism and the rise of democracy were the underlying causes of their fall; these factors in turn generated four or five more proximate causes for decline in aristocratic wealth, none of them given precedence, thereby indicating that they are part of five problems for the British aristocracy that combine to bring them down:
1. The vulnerability of land as a source of wealth and income. The development of modern capitalism threatened the aristocracy's wealth in two ways. First, agriculture became a less central part of the economy, with other assets offering increasingly greater returns than land. Second, economic globalization created greater competition from abroad, exerting downward pressure on agricultural prices, values, and rentals. The British aristocracy's dual role as a wealth elite and a landed elite became increasingly untenable. This vulnerability was most clearly manifested during the agricultural depression of the late nineteenth century and the fall in agricultural prices after World War I. Bush, Thompson, and Cannadine argue that these pressures only really eased after World War II and to some extent were reversed. But overall, the association with land ultimately had an impoverishing effect on the aristocracy.Footnote 37
2. The emergence of a non-aristocratic plutocracy. Throughout its history, the aristocracy, especially the peerage, has included many of the wealthiest individuals of their time. Cannadine argues that from the 1880s onward, new untitled, plutocratic wealth (often foreign) overshadowed the wealth of the aristocracy.Footnote 38 The rise of new wealth dented the aristocracy's relative position, leading to a loss of status. Note that unlike the vulnerability of land or confiscatory taxation, this phenomenon does not necessarily imply impoverishment, as the aristocracy could in fact be getting richer but others were getting richer even faster.
3. Loss of influence and confidence. Most writers on the aristocracy point out at times that plenty of aristocrats have continued to do very well economically, but that even so, with less land, less political influence (following the Reform Acts, the growth of the political working class, and concurrent hostile media), and less cultural cache, they lose their confidence and fray as a cohesive and active group. As Cannadine says, on the heels of his description of the deterioration of the aristocracy's economic position and the necessity to sell land, “the evidence is invariably impressionistic, but the message it conveys and the mood it expresses are both clear and unequivocal: confidence to anxiety, buoyancy to pessimism, expansiveness to retrenchment, and acquisitiveness to dispersal.”Footnote 39
4. Taxation on land and wealth. Starting in 1894 with the introduction of death duties by Sir William Harcourt, the wealth of the aristocracy was adversely affected by increasing levels of taxation. Death duties rose to 15 percent in 1909 and to 60 percent in 1939, peaking at 85 percent for estates valued over £750,000 before being replaced by the Capital Transfer Tax in 1975 and the Inheritance Tax in 1986, which both saw a reduction in the amount of tax paid on estates. Other taxes affecting the aristocracy included the Incremental Land Duty and the Undeveloped Land Duty. These taxes’ relevance is not just that they affected the aristocracy: the non-aristocratic rich were hit as well. But they struck particularly hard at land and dynasty, which were so important to the institution of hereditary aristocracy.Footnote 40
5. War. In addition to these systematic, long-term threats to aristocratic wealth, the authors also note the effects of a fifth shock to aristocratic fortunes: war. Most accounts of aristocratic decline note the effects of the two world wars. Authors highlight the disproportionate human losses incurred by the aristocracy in World War I and also the privations incurred during World War II, such as the billeting of troops in stately homes. It is unclear the exact effects that war had on aristocratic wealth.Footnote 41 Historical accounts note the loss of human capital, but war is also seen as eroding deference and prompting states to tax the wealthy in search of additional revenues. Economic discussions of the history of capital and inequality also stress the destructive effects of war on capital.Footnote 42 This source of decline is not exclusive to the aristocracy and reminds us that historians may have been misguided in seeking explanations focused on factors particular to noble families rather than seeing them treading the same path as the rest of the rich in the twentieth century. In any case, we would expect war to have an impoverishing effect on this group and for wealth to decline more rapidly during and after war.
We did not directly test the effect of these mechanisms in our research, but we were able to assess their credibility in a way that previous discussions of decline could not. By using probate records to provide a framework to examine trends and changes in the wealth of the hereditary peerage in a coherent and comprehensive manner, we can determine if the timings and trends are consistent with the mechanisms postulated above.
Probate and Its Limitations
We begin our study in 1858 when comprehensive probate records across all dioceses and courts were first collated centrally, which also predates the onset of decline identified by most historians.Footnote 43
Probate records, which show identifiable individuals’ wealth at death, have been used by a range of historians and social scientists, including Rubinstein, Tom Nicholas, Mark Rothery, Gregory Clark and Neil Cummins, Alastair Owens et al., David Green et al., and, in the Swedish context, Erik Bengtsson et al., covering investigations in wealth from the early nineteenth century onward.Footnote 44 While probates are, we suggest, the best generalizable measure of identifiable individuals’ wealth available, they have limitations. First, they measure only wealth at death and may not reflect the wealth that individuals owned in their lifetime. For example, individuals who die at an old age may have run down their wealth in retirement or withdrawn wealth to move it into more obscure personal avenues. Second, probates do not include wealth held in trusts, which is subject to different taxation regimes. Third, especially when death taxes are high, individuals can try to reduce the taxes on their estates through inter-vivos gifts. Fourth, there have been changes in the way that probate grants have been calculated over time. According to Barbara English, they included only gross valuations not inclusive of debt until 1881. Until 1898, they only included unsettled personal wealth, excluding realty of any sort; that is, they only included the personal wealth of the deceased over which there was no legal claim of control, and they did not include property and land of any sort.Footnote 45 From 1898 onward, unsettled property was included: that is, property in the total control of the deceased. In 1926, settled wealth and land—that on which there were legal constraints such as endowments—were included; in the probate grant, this is shown separately from unsettled wealth and land. In our analysis, following Rothery,Footnote 46 we excluded settled wealth and included only unsettled wealth: that is, only personal wealth including property in the absolute control of the deceased. We made this choice because we are interested in the wealth under the control of the individual heir as opposed to settled wealth, which is tied up in legal constraints and is often used to provide income for family members. This exclusion does away with the problem of the later inclusion of settled wealth, which we also excluded.Footnote 47
However, some historians, such as Martin Daunton, as well as English, David Nicholls, and Green et al., have insisted that probates do not reveal the composition of wealth and are unreliable if not supplemented by alternative sources such as death duty registers that exist up until 1903, and case studies.Footnote 48 We certainly agree that probate is in some ways a blunt tool that does not reveal the composition of wealth, the character of any bequests, the specifics of any recipients, and the expenditure of wealth over a lifetime, and that any sample skews to older age.
These limitations do not, we argue, present insuperable barriers to our aim of tracing the trajectories of aristocratic wealth over the past 160 years. Because we are not seeking to unpick in detail the wealth of individual families, the internal financial mechanics of those families, or the destination of wealth beyond the primogeniture heir, we can accept most of the limitations detailed above. Moreover, if there is consistent underreporting in probates, this does not affect the analysis of trends to the extent to which pressures for underreporting are consistent across the period of our study. But what of limitations that are not consistent? Two sources of inconsistencies would seem to flatter the decline thesis: the inflated size of pre-1881 probates using gross as opposed to net values,Footnote 49 and the increasing reliance on trusts and inter-vivos gifts that accelerate in the twentieth century, especially from the 1920s.Footnote 50 Thus any countertrends would more strongly undermine the decline thesis. The third inconsistency, the inclusion of unsettled realty from 1898, would flatter the anti-decline thesis of this period, but observation of the data does not show an upward break at this point; rather, our data show a consistent trend upward without obvious change. Taking into account these biases, we consider the use of probates in measuring unsettled, entirely personal wealth across generations in a primogeniture system to be an effective tool in identifying generalities and trends.
Between 1858 and 2018, 3,219 hereditary peers died. We were able to locate grants for 2,492 (77.4 percent). Grants were missing for several possible reasons. First, peers might have died destitute or without enough wealth to require probate. Second, peers might have emigrated, and their taxable property might be in a different jurisdiction. Third, some peers might have their wealth tied up in trusts, which would not appear in their probates. The different sources of missing probates will have contrasting implications for our estimates of wealth. The extent to which peers are destitute or too poor to have a probate record will inflate recorded mean wealth, while the extent to which they are hiding their wealth in trusts (and other means) will deflate recorded mean wealth.Footnote 51 It is impossible to know the balance of these two factors, although it is more likely that hidden wealth will outweigh impoverishment because it will only take a few large, hidden fortunes to offset many destitute peers.
Inflation and Its Implications
One of the great difficulties with the historical literature is a focus on sheer monetary values without considering the effects of inflation and the growth of Britain's wealth. For example, Rubinstein's focus on the number of half or full millionaires or multimillionaires over time suffers from this problem. Because of inflation, someone who is a half millionaire in the mid-nineteenth century is probably much wealthier than someone who is a full millionaire in the mid-twentieth century. Even if there were no inflation, in a growing economy, millionaires from the mid-nineteenth century would have greater relative economic status than would their counterparts in the mid-twentieth century.Footnote 52
To capture these changes in the value of monetary wealth, we make two different adjustments to convert historical values into 2018 pounds using the MeasuringWorth website.Footnote 53 The first adjustment for inflation is to multiply the probate grant by the percentage increase in the Retail Price Index (RPI) between the year of death and 2018. The second adjustment shows what the probate grant would be in 2018 if its size relative to GDP per capita were the same at time of death. Each serves a different purpose when describing decline. If the Retail Price Index adjustment goes down, it indicates impoverishment; if the GDP per capita adjustment goes down, it indicates only relative decline—that is, it could easily be the case that the purchasing power of hereditary peers’ wealth remained unchanged from that of their predecessors, while the wealth of the average person increased, thereby generating relative decline.
This distinction will, as we show below, allow for some conceptual refinement in thinking through the connection between status and wealth for the aristocracy. It also establishes, in the most general sense, a comparative context for aristocratic wealth, since it evaluates the wealth of this group against the fluctuating wealth of the average individual. Thus, when we see the relative adjusted wealth of the aristocracy rising in the late nineteenth century, it means it is rising against the average growing wealth of the British citizen. Equally, when we see it holding its own in the first part of the twentieth and twenty-first centuries, it means that the wealth is growing at the same rate as the averaged rest of the country. While still a broad-brush finding, this would nevertheless be an extraordinary and challenging result. To increase one's intergenerational wealth at the same rate or faster than average per capita wealth in the era of growing democracy, industrialization, and declining land values sits starkly against the evidence and broad interpretations adduced by the historians we reference. Equally, for this apparently feudal-status group to maintain its relative wealth against the rising wealth of the country in the era of meritocratic late capitalism would merit further reflection and investigation.Footnote 54
Trends and Changes in the Hereditary Peerage's Wealth
Real Wealth over Time
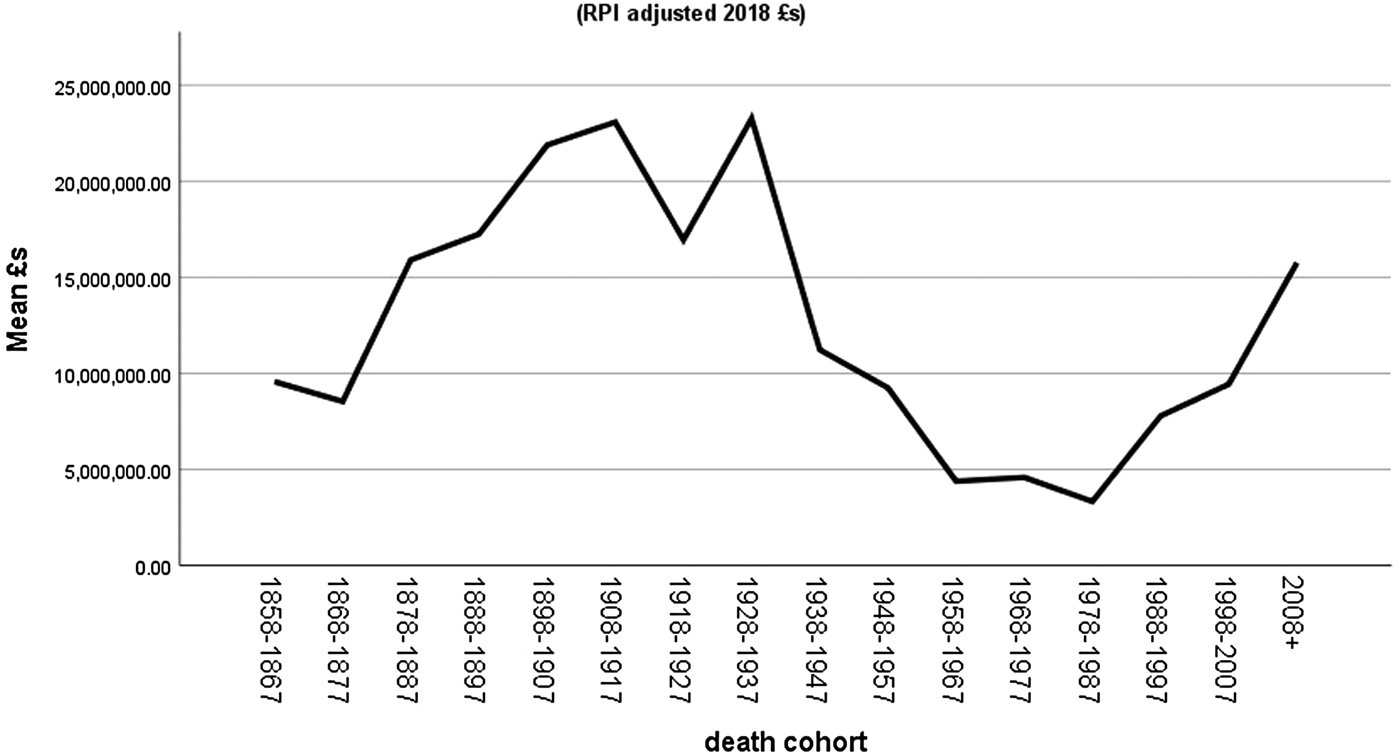
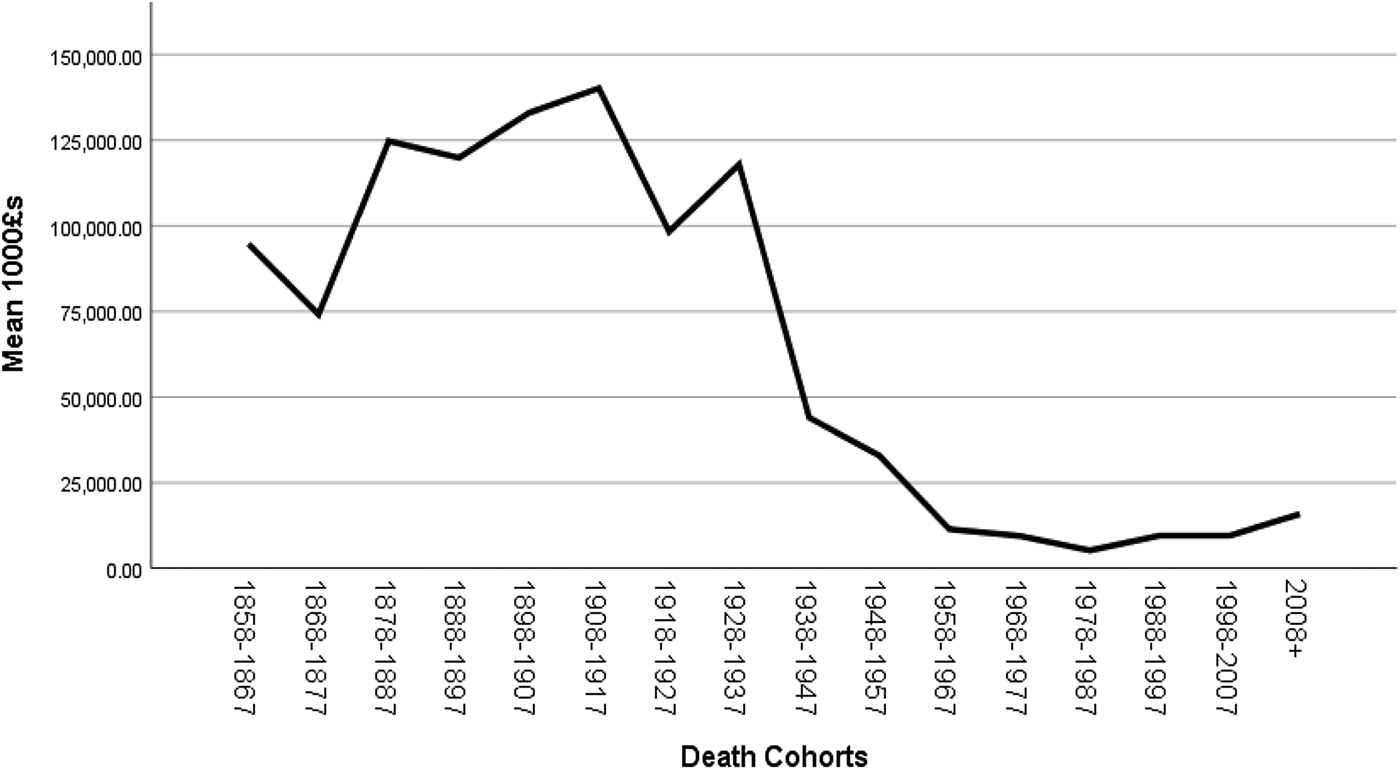
We start by looking at real wealth (Retail Price Index adjusted) over time. Figure 1 below displays the change in probate grant values. The data points are ten-year averages beginning in 1858–1867 and ending in 2008–2018.
Mean probate values by death cohort, RPI-adjusted 2018 £s.

Perhaps the most surprising finding is the growth in average probate grants prior to the First World War. Barring a dip from 1868 to 1877, there is an unbroken rise. The peerage's wealth appears untouched by the agricultural depression, and our evidence indicates that, far from suffering impoverishment, they are getting wealthier. Contrary to the claims of Cannadine,Footnote 55 exposure to the forces of international capitalism did not economically damage the peerage, let alone immiserate it, which is consistent with Rothery's finding for the landed gentry. What the causes might be for this increase are uncertain. If one accepts the impact of crashing land prices and rental returns presented by many of the scholars treated here, then these findings support the notion that the peerage were successfully diversifying by selling off land and precious objects and investing the proceeds in nonagricultural sectors of the economy, or were utilizing their land through mining, transport, urbanization, and the like to generate new wealth. Either way, the strategies of the late nineteenth-century aristocracy appear to be much more successful than has previously been suggested.Footnote 56
It is only in the interwar years that signs of decline become visible. This is the period of the great land sell-off described as the biggest reorganization of landownership since the Norman Invasion. Typically, historians have viewed the sell-off as a response to the pressures of a depressed agricultural economy and the burden of taxation.Footnote 57 While there is evidence of decline, as shown in the drop of average probate values from 1908–1917 to 1918–1927, there was a rebound in the 1928–1937 cohort. Rather than a period of decline, then, it is best considered one of constancy. While the upward march of peerage wealth witnessed in the late nineteenth century was halted, the resiliency of that wealth is a surprise given the triple shock of agricultural adversity, the aftermath of war, and increasingly confiscatory levels of taxation. The “Indian summer” that Thompson describesFootnote 58 extends further, and the survival that Bush talks of somewhat loosely, in which “several families” could live like aristocrats until World War II, needs to be significantly expanded.Footnote 59 Again, it may well be that the sell-off and reinvestment or new utilization of assets such as land had a bigger and wider impact than has previously been proposed.
It is during World War II and its aftermath that clear signs of decline become apparent. The 1938–1947 cohort showed a large decline in its average probate, but unlike with previous drops, there is no rebound, and the mean plummeted until a minor increase in 1968–1977, followed by a drop to the lowest value in our study in 1978–1987. Scholars of the postwar aristocracy such as Cannadine and Mandler have talked about a revival in aristocratic wealth in the 1950s to the 1970s as a result of increasing land values and the aristocracy's new role as guardians of the national heritage through their proprietorship of stately homes; but the magnitude of these positive effects was outweighed by downward pressures resulting in a sustained and steep decline in the hereditary peerage and, likely, wider aristocratic wealth.Footnote 60 What sort of downward pressures could these be?
First, there were the sustained assaults on wealth manifested in higher death duties for larger estates that began in 1914 at 20 percent before jumping in 1919 to 40 percent, in 1930 to 50 percent, in 1940 to 69 percent, and in 1950 to 80 percent. With a lag of thirty years to see the effect of death duties extracted from one generation to the next, this pattern fits the graph rather well. If we add increasing top income tax to 60 percent in the 1930s and 80–90 percent in the 1940s onward, we would expect a short lag on the accrual of wealth, and this too fits the graph rather well. Second, there was the destruction of capital associated with World War II, which has been identified by Piketty as a factor reducing concentrated wealth in the second half of the twentieth century, although as stated, the effects of World War I were short-lived. Whatever the explanation, it is only as late as the Second World War and its aftermath that the levels of decline postulated by some scholars to have occurred in earlier periods began. But it is worth noting that even at their lowest economic moment (1978–1987), the average price-adjusted amount the hereditary peerage left was the very considerable mean amount of over four million pounds.
The mean value of the peerage's probate grants rose or maintained itself during the period that it was supposed to be in decline; it was in decline when it was supposed to be having a brief resurgence, and it was still in the upper reaches of the 1 percent at its lowest point. This indicates, in the first instance, that it is the combination of war and sustained high levels of taxation on inheritance and marginal incomes, along with an absence of alternative government economic supports for the group, contra Bush's idea of “escape hatches,” that generates significant changes in wealth. In other words, it is government fiscal policy, not economic structural forces or the vicissitudes of prices, that governs the wealth of the peerage, and by extension the hereditary aristocracy as a whole.
With the 1988–1997 cohort, we see a rise in the mean value of probates that continued until the most recent cohort, returning probate values to Victorian levels although falling short of Edwardian and interwar levels, and the 2008–2018 cohort mean in figure 1 is significantly flattered by the inclusion of the sixth Duke of Westminster's vast fortune. Nevertheless, even without Westminster, the mean value of peerage probate would be more than double that of its low point. The resurgence in wealth began during the Conservative governments led by Margaret Thatcher and John Major. Of course, these governments are well known for favoring lower taxes, a reputation that owes perhaps a little more to their rhetoric than their actions, but there is no doubt that their tax changes made the intergenerational transfer of wealth easier. In 1986, Thatcher's second government replaced the capital transfer tax with the inheritance tax, which made inter-vivos gifting of wealth much easier as well as reducing rates of tax on inherited fortunes. Again, the tax reform is something that benefited all wealthy families but is especially important to the institution of a hereditary aristocracy and could be contributing to a longer-term resurgence in aristocratic wealth.
To validate these findings and ensure they are not artifacts of the grouping of peers into death cohorts, figure 2 displays loggedFootnote 61 probates over time for four different periods covered by our study that showed distinct patterns in the cohort analyses: 1858–1918, 1919–1938, 1939–1978, and 1979 to the present. The first period begins before the agricultural depression and continues through it to the end of the First World War; the second is the interwar period; the third includes World War II through the postwar consensus; the fourth starts with the first Thatcher government and runs to 2018.
Logged probate values over time, RPI-adjusted 2018 £s.
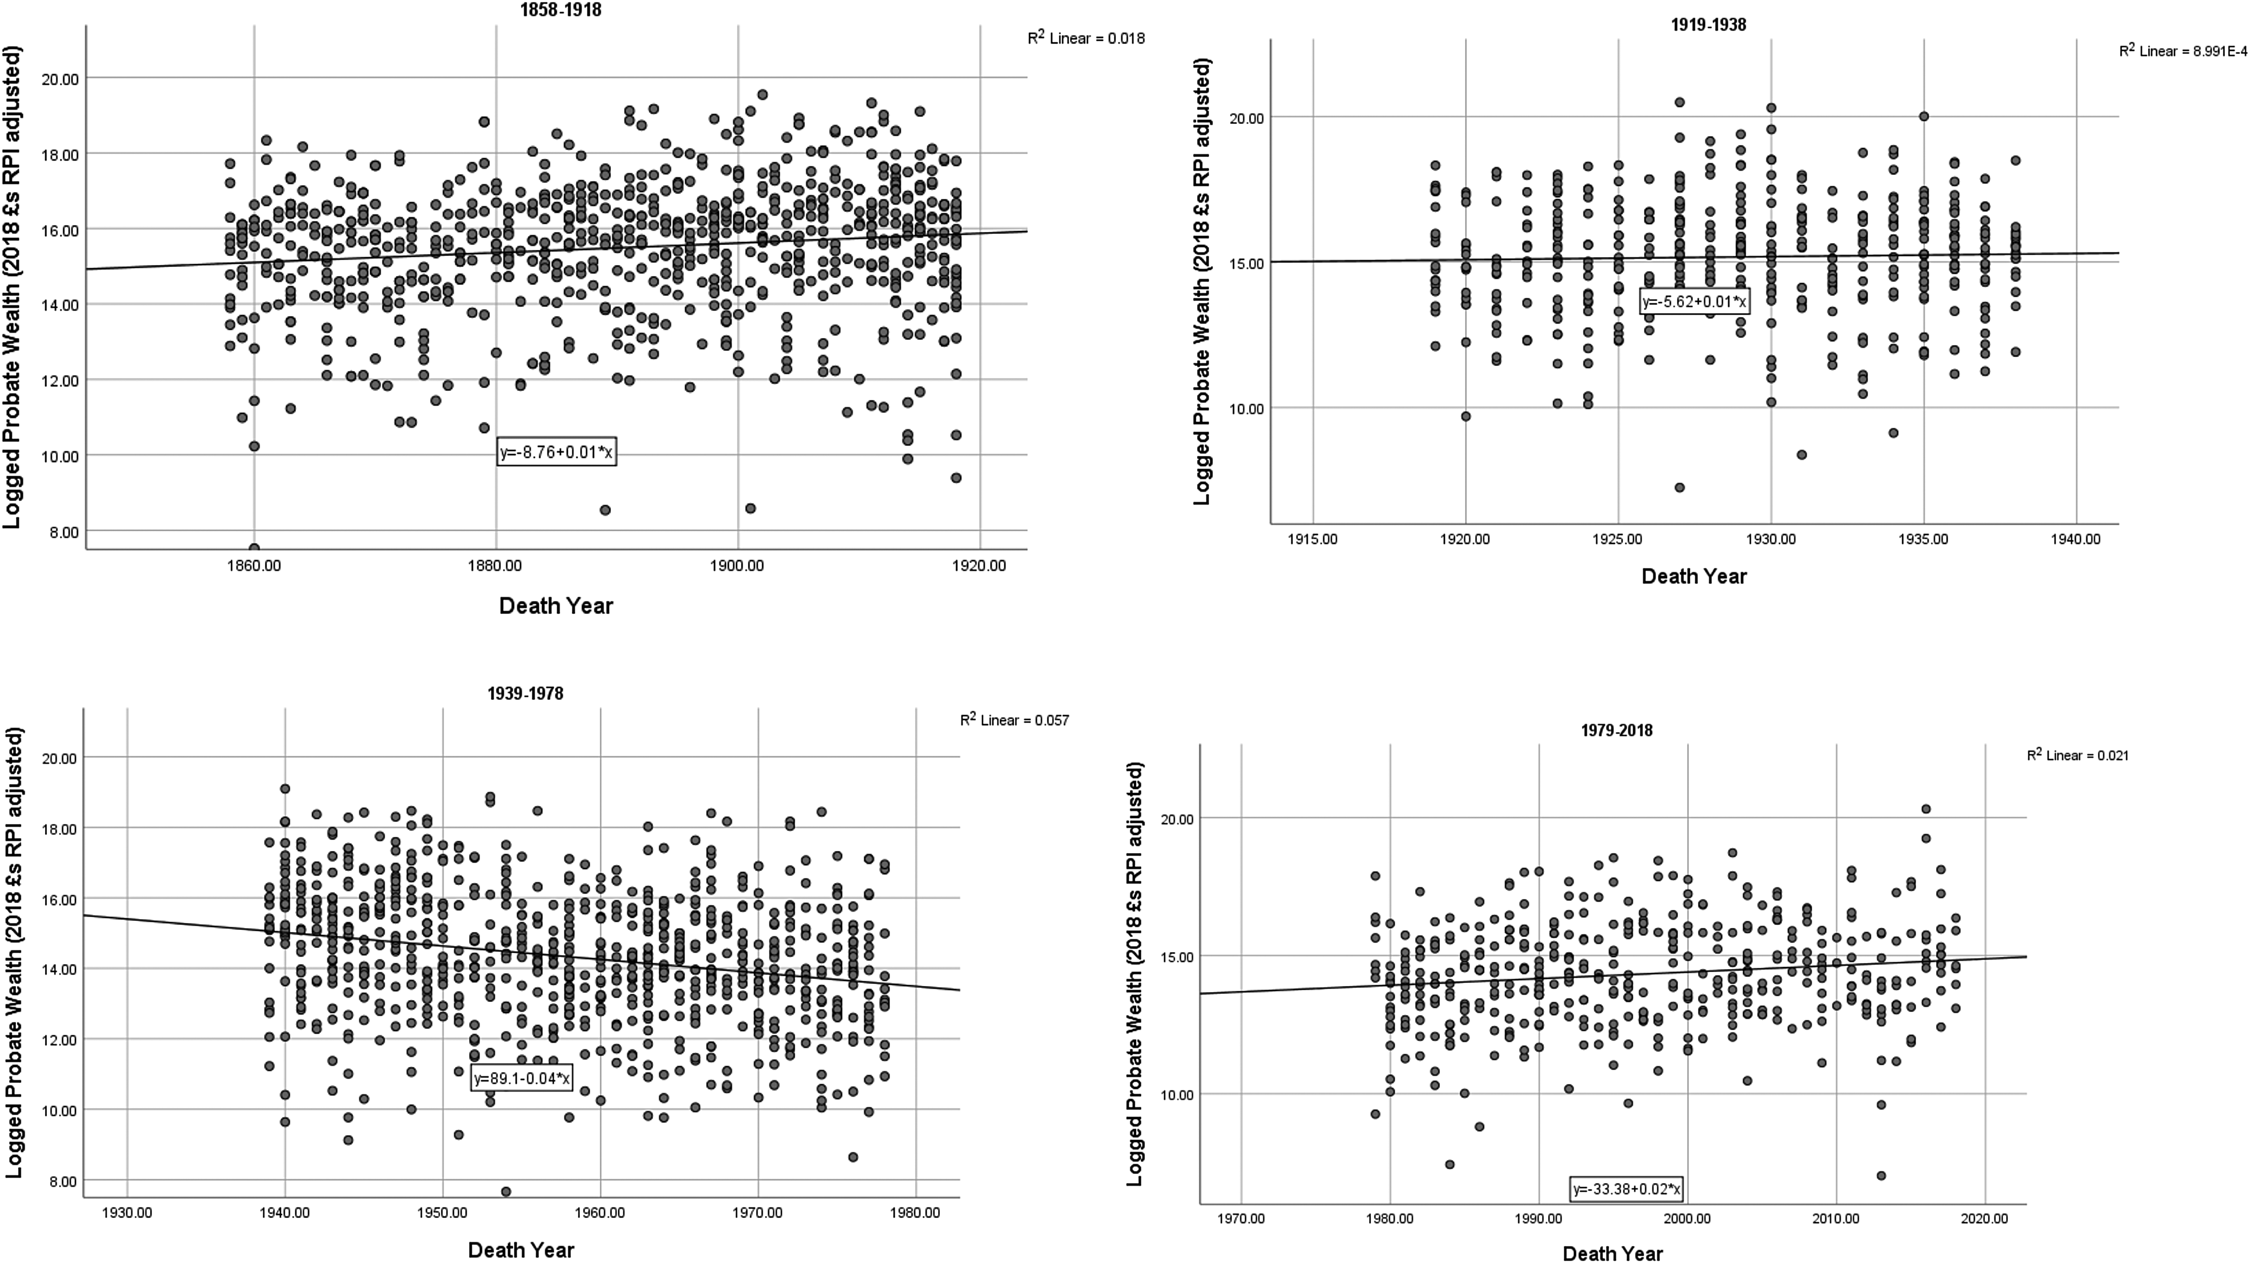
The fitted regression lines in the four graphs largely confirm the earlier discussion. The 1858–1918 and 1979–2018 gradients are positively signed and significantly different from 0 at the 0.05 level. The 1919–1938 gradient is positively signed but not significantly different from 0 at the 0.05 level, while 1939–1978 is the only period with a negative sign and is significantly different from 0 at the 0.01 level. Decline is only evident post–World War II, but it is a major decline outweighing early periods of growth and later signs of resurgence.
To summarize, since Cannadine's 1990 The Decline and Fall of the British Aristocracy, which we take as the last major evaluation of the condition of the aristocracy in the modern era, we see significant improvement in the fortunes of the hereditary peerage over the past thirty years, something that is entirely at odds with the trajectory outlined by him and indeed by the majority of writers. Even those who argue for a degree of persistence limit it to the “super-rich” aristocracy and certainly do not speak of a general improvement in fortunes. What this result indicates, at first glance, is that as government policy becomes more conducive to wealth accumulation and inheritance, so wealthy aristocratic families do better.
Relative Wealth over Time
This collation and averaging of the changes in peers’ real wealth over time tells a story different from many accounts of aristocratic decline. There were no consistent signs of impoverishment until World War II, followed by a sharp fall before some signs of resurgence. This is, however, a partial account, and one of the key planks of historians’ description of aristocratic decline is the loss of their prestige, power, and wealth relative to other actors in society, such as businessmen and professionals. The previous findings controlled for the effects of inflation but took no regard of the greatly increased overall wealth of British society. Suppose we adjust someone's grant in 1875 and find that it is worth ten million in 2018 pounds. We can legitimately say that this grant gives that person the same purchasing power as someone who left an estate worth ten million pounds in 2018. The difference is many fewer individuals left estates equivalent to ten million 2018 pounds in 1875 than in 2018. While maintaining the ability to sustain a lifestyle over time would be a significant achievement in a premodern society, in a growing modern society, standing still means falling behind.
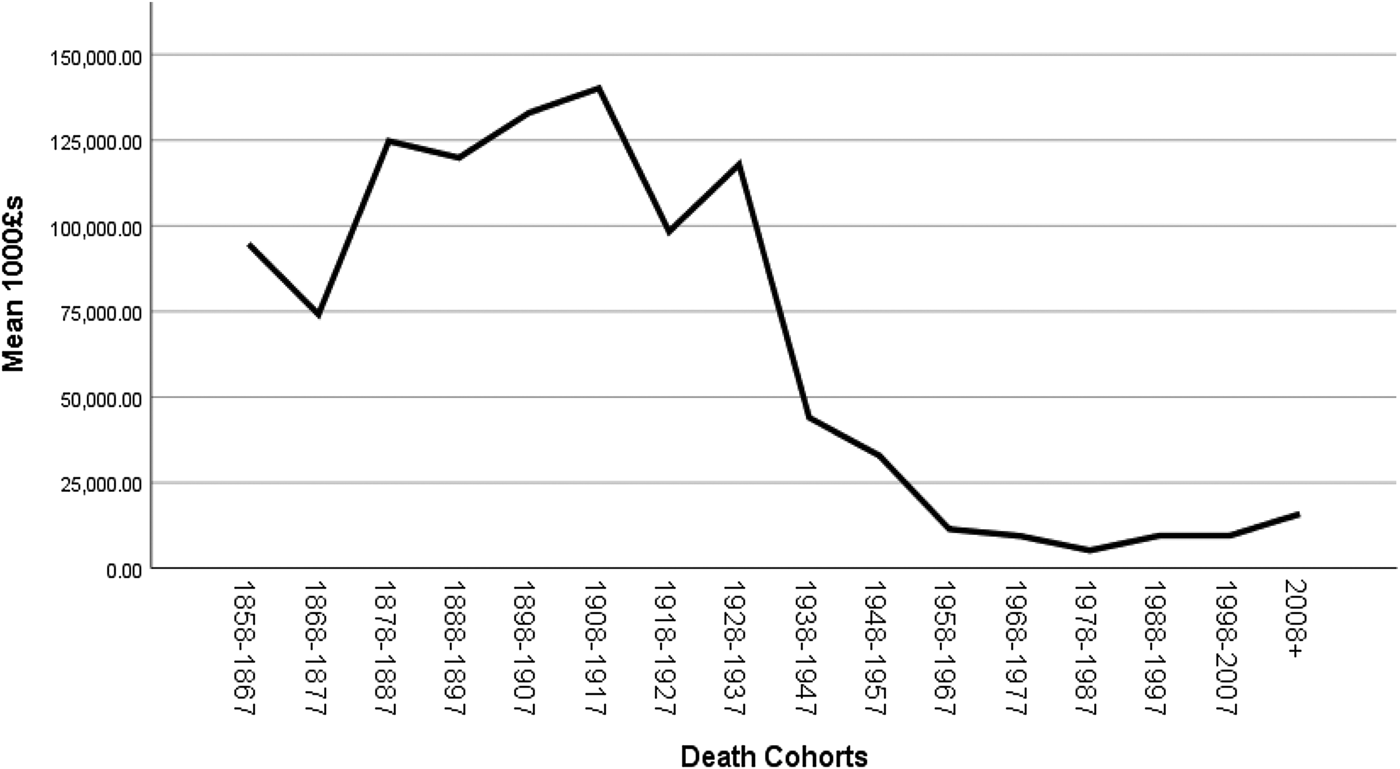
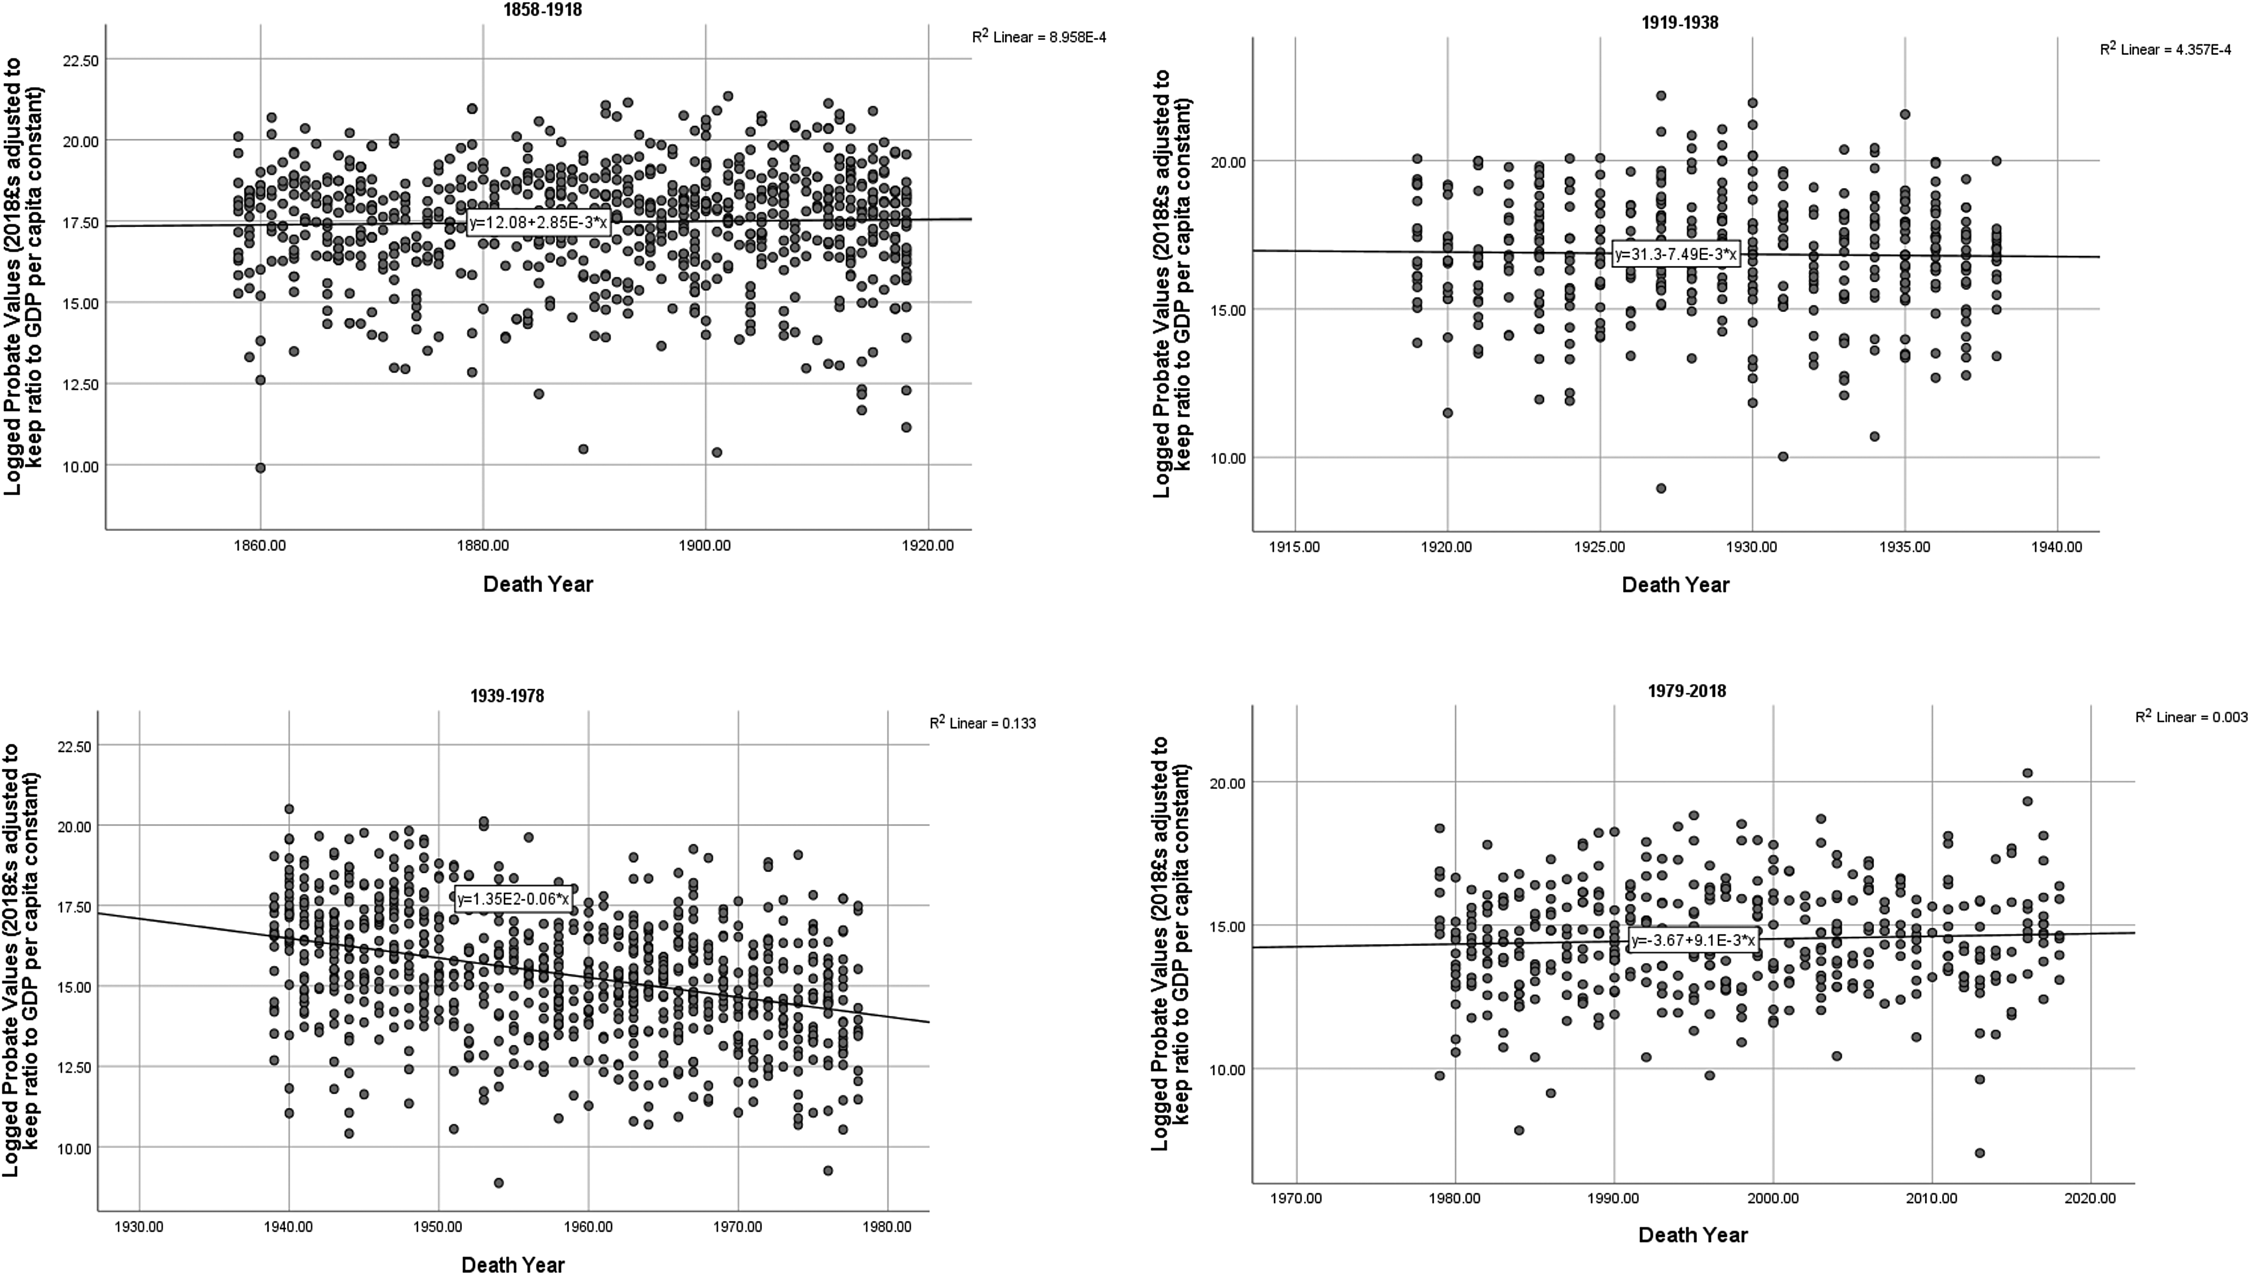
Figure 3 is a graph much like figure 1, but the mean is for the relative measure of value that accounts for growth in GDP per capita. When interpreting this figure, it is worth keeping in mind that a positive gradient indicates not only that the hereditary peerage's wealth is growing but also that is growing faster than the wealth of the rest of society, so its relative position improves; the opposite occurs when the gradient is negative. Any identifiable flatness, say, between the 1870s and 1920s, indicates that the wealth of the peerage is growing at the same rate as that of the rest of society for that period. At first glance, the graph shares similarities with figure 1: most notably, the peerage's wealth increased rapidly through the agricultural depression to the First World War. Even during the Edwardian rise of plutocrats, the peerage not only kept up but moved ahead—a remarkable state of affairs considering existing accounts. During the interwar years, there are stronger signs of decline as the rebound in 1928–1937 did not compensate for the sharp drop in 1918–1927 as it did with Retail Price Index–adjusted purchasing power. Nevertheless, as stated, between 1878–1887 and 1928–1937 the relative wealth of the peerage is keeping up with the rest of society. The post–World War II fall is much more dramatic, indicating a sharp loss in the hereditary peerage's relative position. We discuss this matter in greater depth shortly, but there are also signs of resurgence in the peerage's wealth after the 1978–1987 cohort, which is particularly striking as these signs express the notion that this feudal status group is prospering more effectively than is the average person in the era of late modern global capitalism.
Mean relative probate values by death cohort, adjusted to keep ratio to GDP per capita constant in 2018 £s.
As we did with real wealth, we include in figure 2 graphs of individual probates by year with best fitting regression lines. The graphs tell a similar story to that shown in figure 2. The graphs for 1858–1918 and 1979–2018 have positive gradients, although neither are statistically significantly different from 0. The 1919–1938 gradient is slightly negative but not statistically different from 0. The overall stability from 1858 to 1938 in peerage wealth relative to per capita wealth is remarkable and indicates an economic preeminence continued right up to the Second World War. Even if not as wealthy as the richest Edwardian plutocrats, as a group the peerage had not lost any ground against the average citizen. The 1939–1978 gradient is sharply downward and significant at the 0.01 level. The difference from real wealth is that the decline is much sharper for the post–World War II period, and improvements in other periods are relatively minor; but to repeat: the stability noted is striking since it means this supposedly feudal status group is holding its own against growing average wealth until World War II.
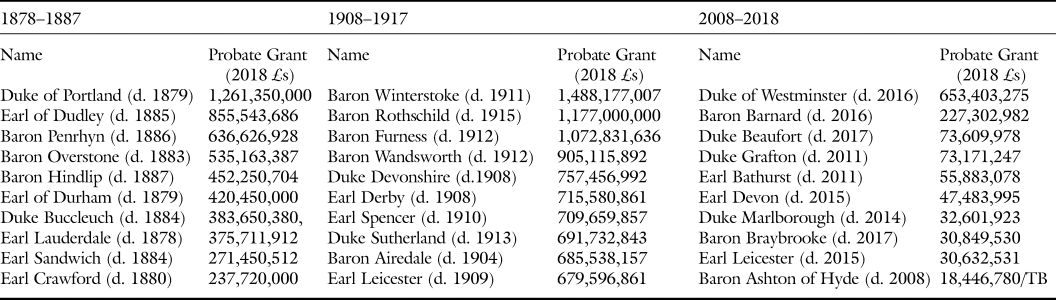
Before concluding this analysis of relative wealth, it is worth dwelling on the resurgence in aristocratic fortunes in recent years. One of the most startling findings when looking at real wealth was that recently aristocratic wealth had recovered to Victorian levels. To focus on purchasing power in this case can be very misleading, because it does not consider how vastly richer Britain is in the twenty-first century than it was in the nineteenth. The hereditary peerage, having recently left fortunes as immense in absolute terms as those of peers of the Victorian period (though not so large as those of the Edwardians), remain extremely rich but have lost a lot of ground relative to the rest of British society. To see just how far the peerage has fallen in relative terms, we show the top ten grants for 1878–1887, 1898–1907, and 2008–2018. We include the decade 1878–1887 because average grant size in real terms is most like the amount for 2008–2018, and we include the decade 1898–1907 because it is the peerage's relative mean peak. The values in the table are adjusted so that they are in the amount of 2018 pounds that would be needed for their fortune to remain at the same ratio to Gross Domestic Product per capita that obtained when they died.
The table shows quite clearly how the relative wealth position of the peerage has changed. To keep the same position in the wealth hierarchy as that of their forebears in the late Victorian era and early twentieth century, the most recent cohort of peers would have had to leave, on average, vastly more wealth, significantly more than ten times what they did leave (excluding the Duke of Westminster and Baron Barnard). It would have needed to include billionaires, and every peer making the top ten would have had to be a centimillionaire. The Duke of Westminster, an outlier in the 2018 cohort, leaving approximately three times the amount of his nearest rival, would have only been the fourth richest in 1878–1997 and would have not made the 1908–1917 list at all. The top ten peers in 2018 are certainly very rich and firmly members of the far upper reaches of the 1 percent, but their fortunes place them in a much lower position in the wealth hierarchy than peers occupied in the past. If hereditary peers are to return to the position they occupied in their past, they will need to grow their fortunes at a very much faster rate than the rest of society.Footnote 62
But we must be nuanced here. One might still argue that if Retail Price Index–adjusted probates approach those of the Victorian period, it is equivalent to saying that peers are able to afford the lifestyle of the salad days of their power—the multiple homes, the high-status consumption practices whose pleasures most of us can only dream of. Although the average British worker can now afford one or even two horseless carriages, and so in some senses has caught up with aspects of aristocratic wealth, the gulf is substantial. Even at their lowest, with an average probate of £4 million net of debts, after having lived a life typically with high consumption costs, the hereditary peers are still well placed in the upper reaches of the 1 percent. It may even be that there are hundreds of thousands of ordinary people today whose homes in London and the South East are worth around £1 million on which, after a lifetime of work, there may be no debt.Footnote 63 But the difference in wealth between that and someone who can leave £4m let alone £16m (the latest cohort's Retail Price Index–adjusted average) is typically underestimated. Leaving £4m net of debts means that the heir could receive a £2m London home, a £1m country home, and £1m of liquid assets, with no mortgages, and again this is for the peerage at its poorest. Owning £16m means you could have a large London home, a country mansion and land, a large foreign holiday villa, several cars (each costing in excess of three or four years of average annual salaries); you could eat where and when you like, dress with elegance, and live very comfortably off your spare assets for the rest of your life without ever really having to work. If we take social status to be measured in part by differences in wealth, then relative wealth might well be a valid measure to grasp an aspect of the status position of the peerage, aristocracy, or whoever. But using only a relative measure is obviously unsatisfactory. Status also includes group behaviors that generate exclusion and inclusion, deference, and a sense of eminence, and a central version of such behavior is consumption and lifestyle. Assuming that the peerage maintain their status group in part through their consumption practices, then simply maintaining their purchasing power would be more important than sheer scales of relative difference when discussing their resilience and persistence.Footnote 64
“New Wealth” and Aristocratic Decline
A keen observer of the hereditary peerage looking at table 1 will have noticed something curious. The peers leaving the largest grants in 1908–1917 include some individuals who had only been in the peerage for a very short time; four of them are Edwardian creations and two are late Victorian. For example, Baron Winterstoke, William Wills, a member of the Wills business family, one of the founders of Imperial Tobacco and a Liberal MP, was made a peer only five years before he died. Similarly, another former Liberal MP, Baron Swaythling, Samuel Montagu, who founded the Federation of Synagogues and the bank Samuel Montagu and Co., was a peer for four years before his death in 1911. The most recent cohort, however, includes only a single peer whose title was created in the twentieth century, Baron Ashton of Hyde; all other peerages were created before 1885, after which non-landed peers began to emerge in number.Footnote 65 To sum up this curious state of affairs, non-landed new wealthy peers burst on the scene from 1885, but their preeminence disappeared by 2018, while the pre-1885 older peers, like the tortoise to the hare, are now among the wealthiest hereditary peers.
Top ten grants adjusted to amount of 2018 pounds to keep ratio to GDP same as when the individual died.

One way of thinking through the contrasting composition of the lists is in terms of two questions: Was the decline in peerage wealth masked by raising plutocrats to the peerage from 1885 onward? And did the plutocratic, non-landed peerage created after 1885 follow a similar or even more precipitous downward trajectory than the older, landed peerage?
Before we attempt to answer these questions, we need to disaggregate and analyze the wealth trajectories of the post-1884 peers who do not come from landed backgrounds and may have disdained the purchase of landed estates. Aristocratic decline scholarship has tended to focus on the traditional landed elite without as much focus on the new non-landed, often plutocratic peers. One can criticize this choice, as the British aristocracy has always been “younger” than the reputation it projects. Like other aristocracies, it has been constantly refreshed by new members, and demographic pressures actually make new blood a requirement for survival. The focus on land receives its justification from the fact that throughout the vast bulk of history, land has been the foundation of its power, wealth, and status; nonetheless, we would contend that the experiences of new peers whose elite standing does not necessarily rest on land can teach the student of decline valuable lessons.Footnote 66
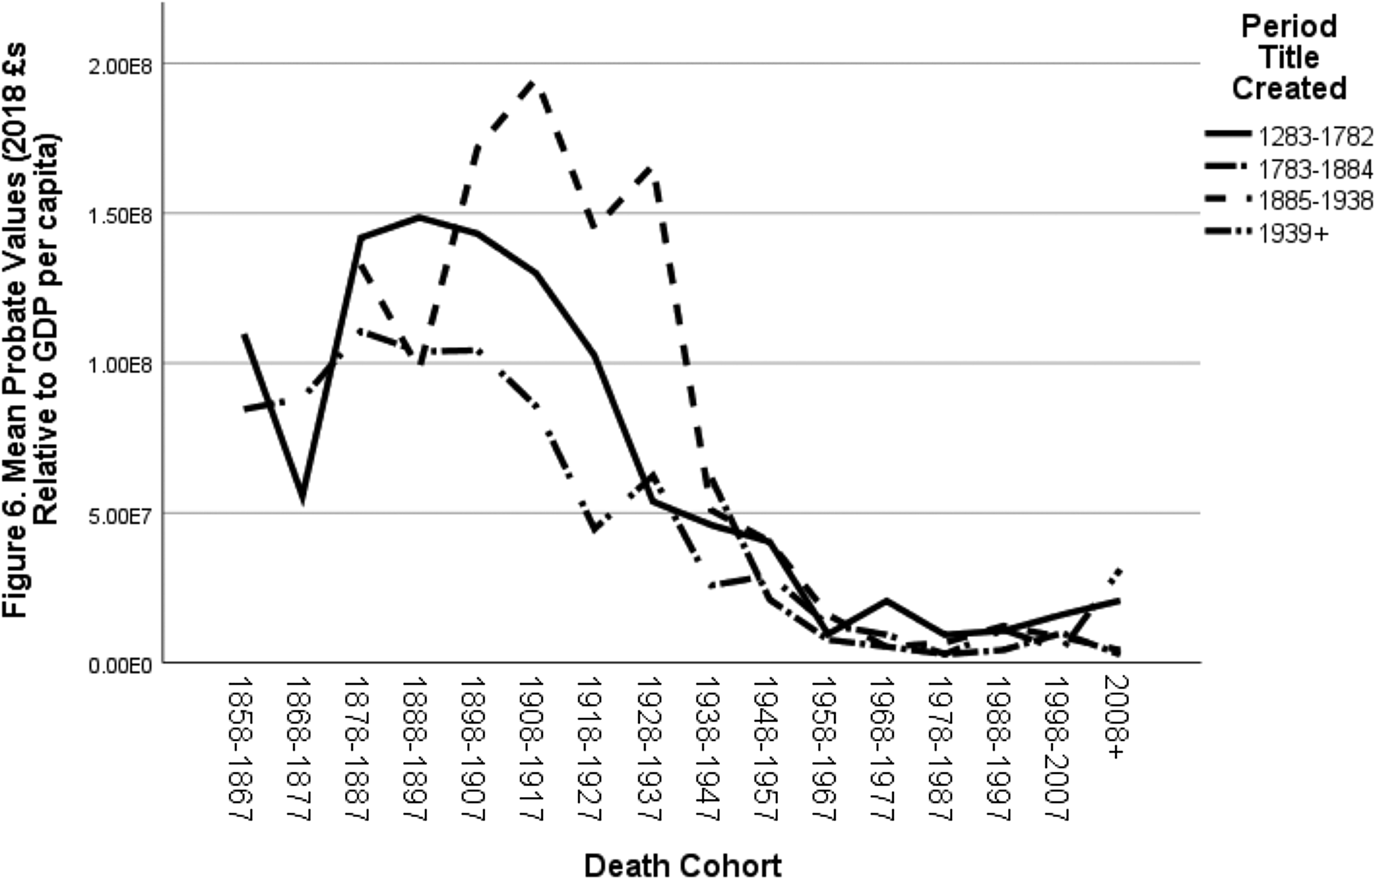
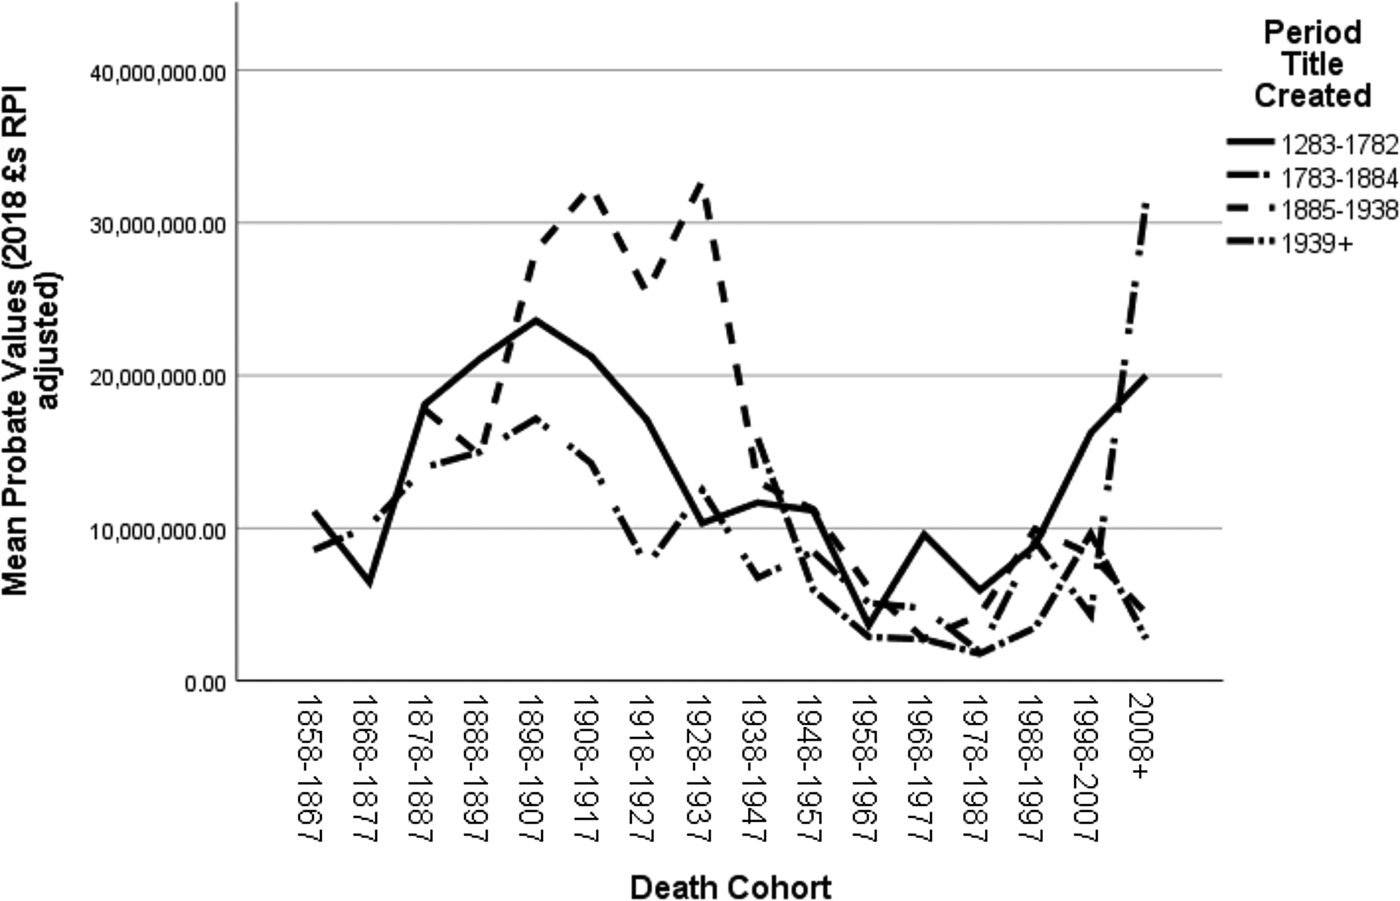
Returning to our questions, in pursuit of an answer, we have divided creations into four periods: 1283–1782, 1783–1884, 1885–1938, and from 1939. The first period includes the oldest peerages through to 1782. The second includes peerages from 1783, when Pitt the Younger became prime minister and started creating peerages at a fast pace through the Hanoverians to the penultimate year of Gladstone's second premiership. The third ranges from 1885 to just before World War II; the key feature of this period was the link between becoming a peer and owning land was partially sundered with an influx of middle class and industrialist peers. The final period starts during the war and contains a more varied mix of peers than ever before, including those rewarded for war service and a larger number of Labour peers. It is also during this period that the hereditary principle in creating peerages disappeared, to be replaced with life peerages (which are not included in the analyses).Footnote 67
Logged Probate Values over Time (GDP per Capita Adjusted 2018 £s).
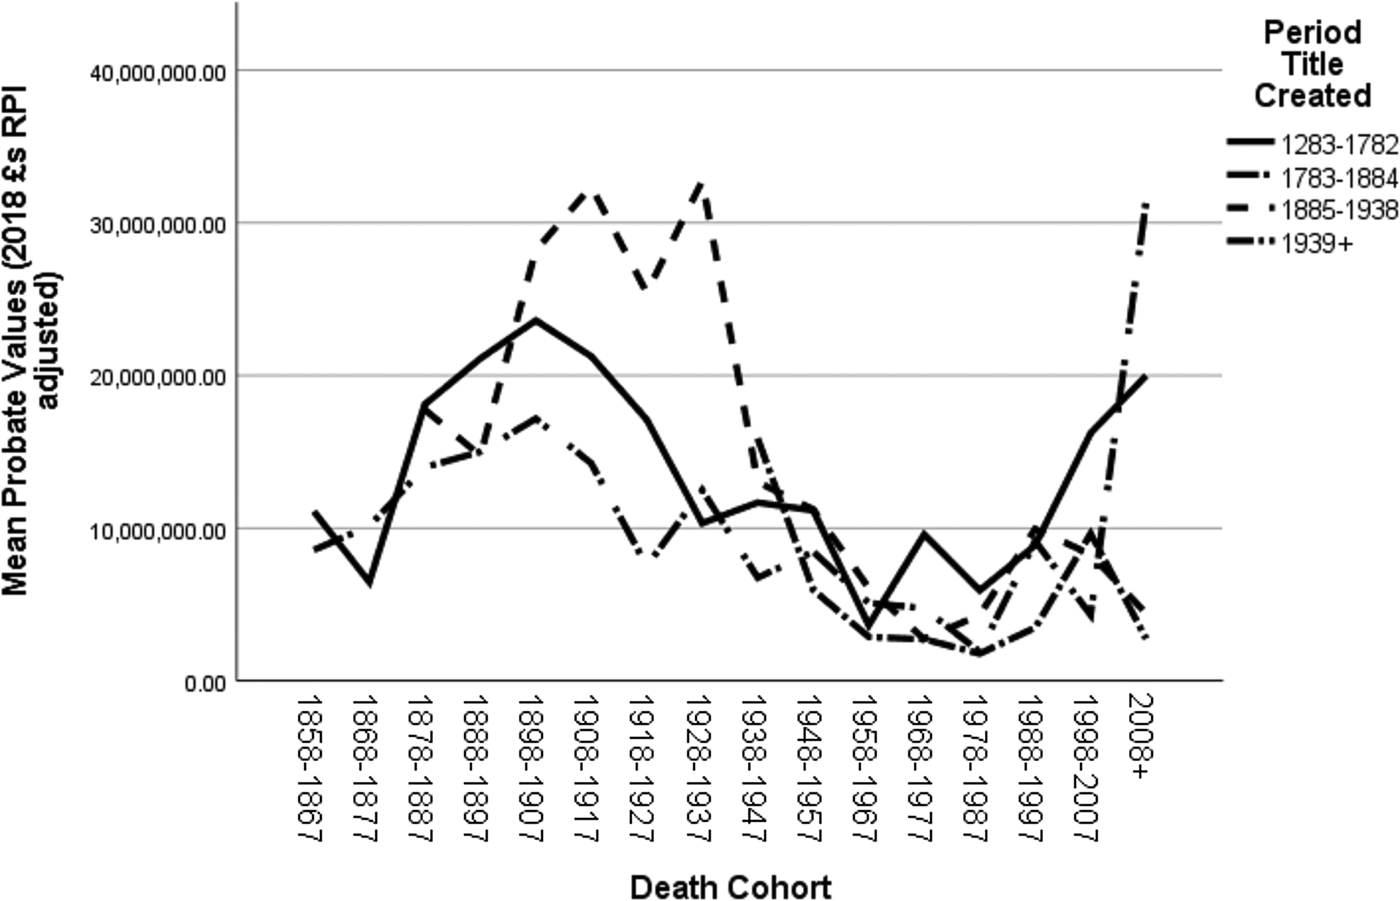
Figures 5 and 6 display changes in the mean real and relative values of the probates of these peerages over time. The figures give a generally positive answer to the first question. Starting with real wealth, the landed elites represented by the two older groups showed decline in real terms after 1898–1907, earlier than the decline noted when all peers, regardless of date of creation, were included. The influx of new wealth represented by the likes of the Barons Swaythling and Winterstoke inflated the mean values of probates in 1908–1917, obscuring the fact that the two groups of traditionally landed elites had started down the route of decline.Footnote 68 However, while pushing back the onset of decline, it still does not overlap with the agricultural depression, during which, in fact, the traditional landed elites were leaving increasingly large fortunes, with the hoariest peerages showing the greatest increases.
Mean probate values by death cohort and year of creation, 2018 £s, RPI adjusted.
Mean probate values by death cohort and year of creation (2018 £s relative to GDP per capita).
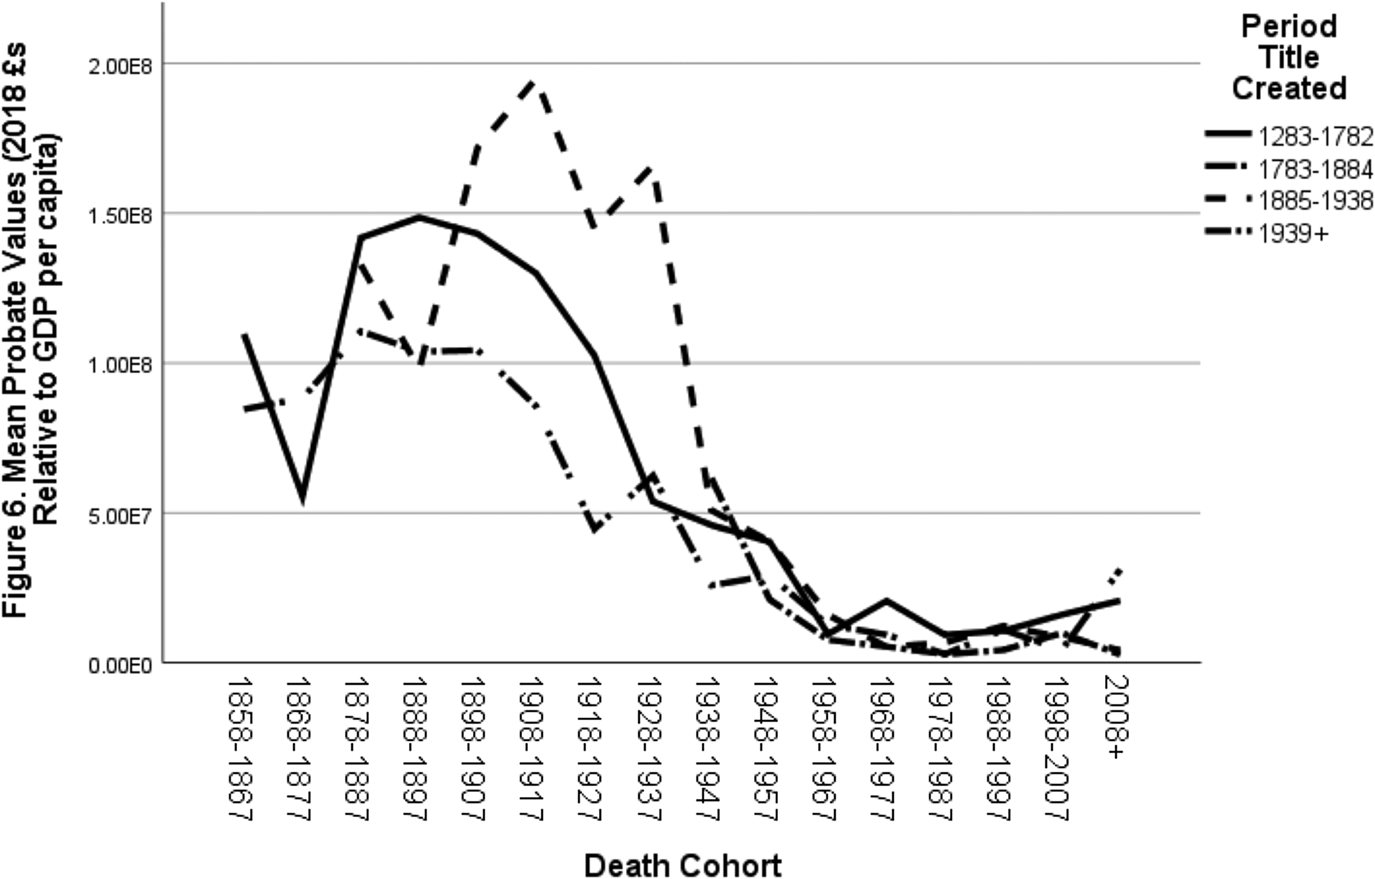
Turning to the relative measure, signs of decline are pushed back further. While the traditional landed elites left increasingly larger grants in absolute terms through the agricultural depression, their relative fortunes tell a different story. Growth in the relative size of the second-oldest group's grants ceased after 1878–1887 and then held nearly steady until 1898–1907. The oldest peerages resisted decline a little longer, showing the first signs in 1888–1897. Even against the rising wealth of the country, the older titles essentially maintained their relative wealth into the Edwardian era. For both groups of traditional landed elites, the sharpest declines occurred through the interwar years.
The new, substantially non-landed peerage created after 1885 showed little sign of major decline before World War II, as Edwardian and interwar plutocrats died leaving vast financial legacies.Footnote 69 There was a huge slump, however, in the size of grants left by the new peerages during the war, when the differences between their grants and other grants narrowed and they ceased leaving the largest grants.
After World War II, the process of convergence continued, with each of the groups showing fluctuating fortunes. The oldest group showed the most stability, modestly increasing its wealth in real and relative terms from 1978–1987 onward. The two oldest groups left the largest grants on average in the most recent period. Thus we can respond emphatically in the positive to our second question as the plutocratic advantage in the early twentieth century is wiped out by the end of the period covered by the study showing a steeper decline than the earlier titles.Footnote 70
Findings and Reflections
The data on hereditary peerage's probate grants since 1858 provide a consistent framework for measuring changes in their wealth over time. Our major findings from analyses of the data include the following:
1. Hereditary peers suffered a drop in their real wealth over time, but their impoverishment was limited. They have remained wealthy.
2. Hereditary peers suffered a sharper drop in their relative wealth. Today they are merely rich; in the past, they were members of the dominant super-rich.
3. Hereditary peers’ probate grants increased in real and relative terms during the agricultural depression of 1873–1896, held steady during the interwar years, and witnessed their greatest drop in average probate grants after World War II.
4. Hereditary peers’ wealth show signs of resurgence in recent decades.
5. The creation of new peerages from 1885 onward inflated the average wealth of the hereditary peerage until World War II.
6. Stripping out peerages created from 1885 onward pushes back the decline of the older, landed titles by approximately one to two decades; however, even in relative terms, and even without new wealth, with the most stringent possible analysis, the landed titles maintained the main part of their wealth through to World War I.
7. The “new,” less landed and more middle-class peerages showed the strongest declines during World War II and its aftermath.
Amid these findings, are there any more general lessons to be discerned? We feel these results tell us something important both about historians’ attempts to explain the decline of the British aristocracy and the place of dynasties and inheritance in capitalist societies.
Do we need a particular explanation for the decline of aristocratic wealth? When telling the history of the British aristocracy over the past one-and-a-half centuries, the historian needs to relate two stories. The first is the account of the flesh-and-blood individuals who filled and fill the different titles: how their actions precipitated, mitigated, or avoided the decline in aristocratic fortunes. Were some peers especially feckless, some especially enterprising, and others covertly using their testamentary freedom to practice financial primogeniture to consolidate family wealth? The second is the account of the financial pressures placed on the aristocracy in an industrial capitalist, increasingly democratic and globalized society. These are largely impersonal, abstract forces facing not only the British aristocracy but a variety of different social groupings across the world. While the first account necessarily requires reference to particular individuals, the second can draw on more general, nomothetic explanations. If we follow this second path, we are led to ask: Did the British aristocracy decline because they were an aristocracy, or did they follow the fate of the British bourgeoisie and the rich in the face of democratizing, redistributive pressures that emerged across the world?
Historians have been divided in their answers to this question. The most notable scholar to argue the former is Martin Wiener.Footnote 71 Wiener's thesis is that the British aristocracy's obsession with status, sumptuous lifestyle, and disdain for business left them ill-prepared for capitalist society and its focus on hard work and profits. His argument is not the typical decline argument, as he claims that the aristocracy lives on, or at least its values do, at the expense of the British economy and so is responsible for its relative decline. While not sharing Wiener's broader criticisms, Cannadine, notwithstanding his references to the minority of super-rich peers, holds similar views of much of the aristocracy as being ill-equipped for the modern world, unable to foresee and not socially and politically nimble enough to sidestep the encroaching dangers of modern society and the threats it posed to their wealth.Footnote 72 A final example is Bush, who claims the aristocracy shunned commercial matters and was more interested in funding consumption in order to demonstrate social status.Footnote 73 According to this view, the British aristocracy failed not only because it faced a hostile environment but also because its underlying character prevented it from adjusting. In the economic sphere, its feudal values left it vulnerable in the face of the cold logic of the market.
On the other side are scholars who claim that the aristocracy was generally economically rational, often entrepreneurial, and keen to seize economic opportunities. Beckett argues that they were responsible for professionalizing estate management, played a significant role in the agricultural revolution, exploited mineral resources on their estates, contributed to industrialization, and improved communications.Footnote 74 One might argue that Thompson finally takes the view that the successful aristocracy are rationally competent, and, indeed, become individualists who are happy to let the unsuccessful components of their order fail.Footnote 75 Another who argues for the economic rationality and innovativeness of the British aristocracy is Wasson. Criticizing Wiener, he writes, “The Wiener thesis is odd in many respects. First, it posits that the most entrepreneurial and acquisitive aristocracy in Europe, noted for digging mines, constructing harbors, managing railroads, promoting resorts, and investing heavily in the stock market somehow destroyed the dynamism of industrialists.”Footnote 76 From this perspective, fault for the aristocracy's economic decline lies not with them but with broader changes in the economy and a fiscally confiscatory state; lugging feudal baggage was not a hindrance.
How do our findings contribute to the debate? We see them as supporting the latter view: there is little that is peculiar to the aristocracy to explain their economic decline, and the difficulties they faced were similar to those faced by the rich more generally in the twentieth century. The first of our findings in support of this thesis is the resilience of aristocratic wealth during the agricultural depression of 1873–1896. One to two generations after the repeal of the Corn Laws and during economic turmoil, the aristocracy was still able to increase its wealth in real as well as relative terms. With their fortunes free from death duties and other taxes on their wealth and income low, they were able to thrive in a relatively unfettered capitalist economy. There seemed no ill fit between the economic orientation of the aristocracy and the logic of the market. One can imagine a counterfactual scenario where taxes on wealth and inheritance had remained what they were before Harcourt's 1894 budget; would they have continued to increase their wealth, growing richer relative to the rest of the society? How much more powerful would the hereditary peerage have remained if it were brimful of centimillionaires and billionaires?
A view of that counterfactual world will forever elude us, but we do have the trajectory followed by the peerage in the world we do inhabit. We can learn valuable lessons by looking at the paths followed by the peerages grouped by their date of creation. Beginning with the oldest peerages, it is worth noting that their decline, which began around the turn of the nineteenth century into the twentieth century (neither as early nor as precipitous as suggested by most historians), followed the national pattern of declining inheritance flows described by Piketty in his discussion of the British case, with a steady decline punctuated by the shocks of the two world wars until stabilizing in the latter half of the century with some signs of resurgence.Footnote 77 If we then focus on the newer, less landed and more middle-class peerages that were created from 1885 through to World War II, the level of wealth they left in the interwar years was very great in real terms and relative to the rest of the peerage and society. Remarkably, however, this difference becomes entirely dissipated by the time we reach the latest cohort, with the older peerages leaving greater amounts on average; the newer were just as vulnerable to decline as the older ones. But, surely, if we were to adopt some variant of the Wiener thesis, then the more recently ennobled peers, especially those not attached to the land and coming from middle-class backgrounds, should be more immune to the aristocratic values responsible for economic decline—and yet they have fallen as far, if not further. One could try to rescue the argument by suggesting that the new peerage dynasties declined because their ennoblement inculcated them with aristocratic values. Going beyond the scope of this study, one could then test this thesis by comparing the new peerage wealth trajectories with those of rich individuals in the interwar years who did not receive peerages; or we one could measure and compare the specific wealth deciles of the aristocracy over time and by family (older and new titles) against similar wealth amounts in families, say, with unusual surnames, belonging to the general population.
Until, however, someone carries out these studies, it is most natural to view the post-1884 peerages’ decline in wealth as disconfirming evidence of the explanatory power of the anticapitalist peculiarity of the aristocracy.
The stability and minor resurgence of wealth among peerages created before 1783 also offers evidence that aristocratic values are not a barrier to economic success. Since the 1980s, the wealth of this group has increased in real terms and at a speed that has improved their relative position. These are the peers who are most likely to own historic landed estates and who have been less touched by middle-class influences, yet they have taken advantage of the opportunities created by the reduction in taxes on wealth and inheritance since the Thatcher governments. Perhaps they have benefited from the heritage industry in ways other peers cannot, but, as Mandler has described, entrepreneurial flair was necessary for them to take advantage of these opportunities.Footnote 78
The differences between the opposing sides of the debate are overshadowed by, in our eyes, a naïve point of agreement. The debate revolves around whether they are rentiers who receive income simply through ownership of land and through advantages buttressed by noble privilege, or if they are entrepreneurs actively chasing down economic opportunities. Both sides agree, however, that while being a rentier was a feasible strategy in earlier, less market-oriented times, it is a detriment to economic advancement in a developed capitalist society and has contributed to the aristocracy's economic decline. Yet it is simply not true that capitalism is the enemy of the rentier. As Piketty has written, “Rent is a reality in any market economy where capital is privately owned. The fact that landed capital became industrial and financial capital and real estate left this deeper reality unchanged. Some people think that the logic of economic development has been to undermine the distinction between labor and capital. In fact, it is just the opposite: the growing sophistication of capital markets and financial intermediation tends to separate owners from managers more and more and thus to sharpen the distinction between pure capital income and labor income.”Footnote 79
Our findings support the idea that the peerage entered the twentieth century in good financial shape, with few signs that they would end up a century later just trying to keep up with where they had been in an immensely richer society. It was not the special characteristics of the aristocracy as a rent-seeking, anachronistic status group that undermined their wealth, nor was it capitalism; instead, fault for economic decline lay, on the one hand, with increased taxes on wealth and inheritance and, on the other, with the shocks of war. Thus, with the stability and lower tax regime that followed the Thatcher governments, there have even been signs of resurgence, as might be expected from our account. The lesson here is not that decline was inevitable but that it was an inadvertent consequence of fiscally targeting the wealthy. If the pressure were lifted, it is quite conceivable the aristocracy would make up much of the economic ground it lost in absolute and perhaps even relative terms.
Conclusion
In this study we have charted the wealth of the British aristocracy over time using all available probate grants for the hereditary peerage from 1858 to 2018. This strategy allowed us to build a framework for evaluating the aristocracy's wealth and for testing conjectures and claims from the historical literature. Our findings are broadly consistent with some of the main contours of the historical decline literature, but they have innovated by distinguishing between real and relative decline, pinpointing the timing of decline, disaggregating titles by age and then identifying wealth by age of title, showing that being in possession of greater wealth does not of itself economically protect future generations, and highlighting the most likely mechanisms of decline. By more precisely identifying the empirical features of aristocratic decline in wealth, we challenge the notion that there was something irrational and premodern about the aristocracy's economic behavior.
Our findings also help to reconcile arguments regarding the nature of British aristocratic decline with arguments regarding the role of the landed classes in the transition to capitalism and democracy. Placing the British aristocracy into a broader comparative framework, it is puzzling why they played a largely accommodative role in the second half of the nineteenth century and since then allowed so many of their advantages and privileges to disappear and erode, when other aristocracies, most notably the Junkers in Prussia and eastern Germany, fought tooth and nail for their privileges. A generation after the Corn Laws had been abolished in Britain in 1846, German conservative agrarians spearheaded by the Junkers successfully imposed tariffs on agricultural and industrial goods in 1879; in 1894, the same year that the House of Lords allowed Harcourt's death duties to become law in England, Caprivi was forced from the German chancellorship for making moves toward free trade. In 1909, death duties were rejected in Germany—the same year that the British aristocracy commenced its failed revolt against the People's Budget. While the British aristocracy acquiesced or was compelled to make concessions to capitalism and democracy, the Junkers successfully adopted a strategy of reaction, thereby thwarting free trade, fiscal redistribution, and attempts to extend democracy.
Many reasons have been adduced for the liberal, pacific route taken by the British aristocracy as opposed to the reactionary route followed by the Junkers. These include the greater “political sagacity” of the British aristocracy in terms of judiciously determining when to make concessions to other social interests; the lack of a parliamentary tradition among the Junkers as opposed to the British aristocracy; the existence of a large peasantry with whom the Junkers could form reactionary alliances against capitalists and urban workers, an option not available to the British; the fact that the British aristocracy was a step ahead of the Junkers, with their reactionary period in the first half of the nineteenth century instead of the second half, and the Junkers’ desire to protect the market for rye from imported wheat. Moreover, the agrarian upper classes in Britain were not so threatened by capitalism and democracy as “the economic position of the governing classes eroded slowly and in a way that allowed them to shift from one economic base to another with only a minimum of difficulty.”Footnote 80
The last reason listed, the viability of the British aristocracy's wealth to act as a buffer that allowed it to adjust peacefully to capitalism and mass democracy, however, does not sit well with a description of the deterioration of aristocratic finances from the 1880s to World War I, sampled from the British aristocratic decline literature. Writes Cannadine, “In sum, their finances were being squeezed, and their fortunes were being surpassed: in the sixty years from the late 1870s, the grandees and the gentry were living in a new and increasingly hostile financial world.”Footnote 81 The claims of the British aristocracy literature create a puzzle for scholars trying to explain this accommodative approach; why did not the British aristocracy follow the Junkers’ reactionary, rent-seeking route rather than stoically overseeing their financial, political, and social ruin? Our findings have shown that the puzzle is more apparent than real and one that is created by exaggerating the economic decline of the British aristocracy. Until World War II, they were, for the most part, getting wealthier or holding steady in both real and relative terms, and they were being refreshed with new members drawn from the burgeoning new class of plutocrats. If their political power was being eroded and they did not receive the deference accorded to their forebears, nevertheless the peerage from the second half of the nineteenth century saw their wealth grow or at least hold steady, which for a traditional status group interested in maintaining a way of life would hardly constitute a crisis.Footnote 82 The route taken by the Junkers was certainly not without risk of conflict from other social groups internally and ire from foreign powers resentful of their militaristic, protectionist approach. What point was there in fighting against the tide of modernity and risking obliteration if the British peerage was getting richer or at least maintaining the wealth to preserve a desired lifestyle and elite social status?
Our findings, by creating a consistent, clear framework for evaluating British aristocratic wealth for more than a century and a half, help clear up historiographical inconsistencies by illuminating areas of historical inquiry too often tackled by partial evidence or anecdote from prominent members. The next step is twofold. The first task is to acquire similar data in other countries that have (or have had) aristocracies. Only then can we profitably develop analytic frameworks to compare the strategies developed by different national aristocracies when faced with the transition to capitalism and democracy. The second task is to acquire similar data for nonaristocratic elites in Britain for the same period. This information will permit scholars to determine the extent to which the decline and persistence of the aristocracy can be interpreted as typical elite behavior in twentieth-century Britain, or whether there is something peculiar about this notionally “feudal” status group.