INTRODUCTION
Over the last half century plant breeding, with a particular emphasis on cereals, has resulted in significant improvements in overall production (Murphy et al. Reference Murphy, Dawson and Jones2008). The increases in yield and quality, particularly of wheat, have largely been achieved by changes in agronomic practices and a corresponding selection of cultivars under those conditions (Austin Reference Austin1999). Such changes include the widespread use of fertilizers, pesticides and growth regulators, which in effect provide more controllable field conditions for the crop (extended nutrient availability and low weed, pest and disease pressure). Despite these major advances, there remain shortfalls in the performance of modern cultivars under conditions of greater field heterogeneity (Wolfe et al. Reference Wolfe, Baresel, Desclaux, Goldringer, Hoad, Kovacs, Löschenberger, Miedaner, Østergård and Lammerts Van Bueren2008).
Low input and organic farming systems are dominated by variation in field conditions between years and sites as a consequence of reduced levels of inputs compared to more intensive systems. Major contributors to this variation are the relatively high weed pressures and nutrient release profiles (Wolfe et al. Reference Wolfe, Baresel, Desclaux, Goldringer, Hoad, Kovacs, Löschenberger, Miedaner, Østergård and Lammerts Van Bueren2008). In organic systems, high concentrations of nutrients are rarely available at peak crop demand (MAFF 1988; Pang & Letey Reference Pang and Letey2000). Instead, nutrient release is dependent on the temperature and biological activity of the soil and its interaction with the declining residues from a previous leguminous fertility-building crop and/or farmyard manure. As a consequence, it is not always possible to match nutrient release with crop demand over time.
Most cereal cultivars available to organic farmers in the UK are those that have been selected under conditions of high-input management. These cultivars often do not achieve the yields or protein content, or the consistency under organic conditions that they do in more intensive farming systems. Recent work has identified that cultivars better adapted to organic conditions are those with relatively rapid establishment and resource capture which are able to take advantage of the early nutrient release from fertility building leys (Baresel et al. Reference Baresel, Zimmermann and Reents1998; Addisu et al. Reference Addisu, Snape, Simmonds and Gooding2010). In contrast, under conditions of high input, cultivars that exhibit extended nitrogen uptake capacity with less emphasis on ability to compete against weeds are favoured (Foulkes et al. Reference Foulkes, Sylvester-Bradley and Scott1998; Wolfe et al. Reference Wolfe, Baresel, Desclaux, Goldringer, Hoad, Kovacs, Löschenberger, Miedaner, Østergård and Lammerts Van Bueren2008). In the present paper, farm management using agrochemical inputs, which can be referred to as intensive, high input or conventional will be termed ‘non-organic’; this will differentiate the two non-organic sites from the two organic sites.
Nineteen cultivars, released to market from 1934 to 2000, were studied for three seasons at two organic and two non-organic sites to provide insights into the effect of selection on yield, protein concentration and protein yield and stability of these characters, and whether any improvements ascribed to modern breeding are more apparent at organic or non-organic sites.
MATERIALS AND METHODS
Selection of genotypes
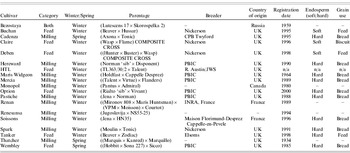
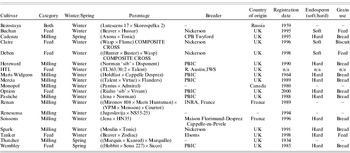
Wheat (Triticum aestivum L.) genotypes were selected in 2002 and were predominantly cultivars from Western Europe that were either popular themselves, or parents of successful cultivars, at or around their time of release (Table 1). The three exceptions were High Tillering Line (HTL), which is a breeding line, Bezostaya, which is a Russian cultivar dating from 1959 and Thatcher, a high quality, rust resistant variety released from the University of Minnesota in 1934. The selection of cultivars was based on obtaining a high level of genetic diversity, so fewer of the cultivars included were released prior to 1972 than after. The 19 cultivars were comprised of two groups: those selected for high yield potential (Bezostaya, Buchan, Claire, Deben, HTL, Option, Tanker and Wembley), the ‘feed’ group; and those selected for bread-making potential (Bezostaya, Cadenza, Hereward, Maris Widgeon, Mercia, Monopol, Pastiche, Renan, Renesansa, Soissons, Spark and Thatcher), the ‘milling’ group. For the purposes of analysis, all cultivars were also included in a third group ‘all’. Bezostaya was included in all three groups because it was regarded as both high yielding and high quality. The parent age was taken to be the number of years from the registration date up to 2008, with the exception of HTL which was released as breeding material in 1985.
Cultivars with grain characteristics, use, parentage, breeder, country of origin, registration date and pedigree. The category refers to the grouping used in the analyses. Missing data are indicated by ‘–’
Site description
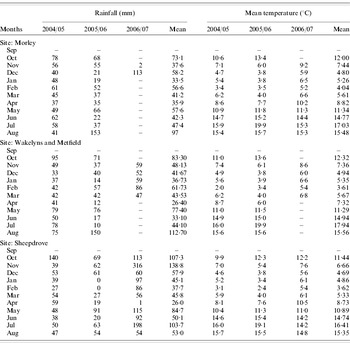
The cultivars were sown at two organic sites: Wakelyns Agroforestry, in Suffolk (52°39′N, 1°17′E) and Sheepdrove Organic Farm in Berkshire (51°31′N, 1°30′W); and two non-organic sites: Metfield Hall Farm, continuous wheat, adjacent to Wakelyns in Suffolk (52°41′N, 1°29′E) and Morley Farm, a research farm in Norfolk managed by The Arable Group (52°56′N, 1°10′E). The mean monthly weather variation over the period of early crop growth is given in Table 2 for each site and for Year 1 (2004/05), 2 (2005/06) and 3 (2006/07). Data are omitted where technical errors in the weather stations occurred.
Monthly weather data for each experimental site in 2004/05, 2005/06 and 2006/07. Missing data are indicated by ‘–’

Experiments were carried out in different fields (or areas of field) within the rotation in each year. Wakelyns had a soil type of sandy-loam over clay with clay content in the range 23–26% by volume, pH 7·4–8·0, organic matter in the range of 23–28 g/kg and low indices for P and K. Sheepdrove had a soil type of clay-loam over chalk with clay content of c. 40% by volume, pH 7·8, and organic matter in the range of 35–49 g/kg. Metfield had a soil type of sandy-loam over clay with clay content c. 16% by volume, pH 7·6–7·9, organic matter c. 20 g/kg and Morley had a soil type of sandy loam with a clay content c. 21% by volume, pH 7·5–7·7, and organic matter in the range of 17–20 g/kg. The N applications at the two non-organic sites (Metfield and Morley) were from mid-March to early April (c. growth stage (GS) 30 (Zadoks et al. Reference Zadoks, Chang and Konzak1974)) were 156, 129 and 129 kg N/ha at Morley and 83, 172 and 129 kg N/ha at Metfield for trial Years 1, 2 and 3, respectively. The late N applications in May (c. GS 39) were 66, 49 and 32·4 kg N/ha at Morley and 106, 64 and 67 kg N/ha at Metfield for Years 1, 2 and 3, respectively. The pesticide applications at these sites followed commercial practice. The preceding crop was grass-clover or grass-vetch-clover ley at Wakelyns, grass-clover at Sheepdrove, winter wheat at Metfield and winter oil seed rape at Morley. Plots were drilled in the three successive years: on 6 October 2004, 3–4 October 2005 and 4 October 2006 at Metfield; 25 October 2004, 12 October 2005, 5 October 2006 at Morley; 11 November 2004, 14 October 2005, 17 October 2006 at Sheepdrove; and 13 October 2004, 7 October 2005, and 4 October 2006 at Wakelyns.
Experimental design and conduct
In each experiment, the cultivar plots were randomized in three blocks. Plot size was 20×1·45 m at Sheepdrove and 20×1·2 m at the other three sites. All experiments were established in the autumn of each year and combined at harvest maturity (moisture content <200 g/kg). Seed rate was 170 kg/ha for non-organic sites and 200 kg/ha for organic sites. Calculations were based on an average target plant density of 425 plants/m2, given a mean thousand-grain weight (TGW) of 40 g in Year 1, and in subsequent years the TGW was calculated for each cultivar. At the organic sites, seed rates were adjusted to take into account an expected mean plant mortality of 0·15.
Assessments
In each year, assessments of powdery mildew (Blumeria graminis), yellow rust (Puccinia striiformis), brown rust (Puccinia recondita), Septoria blotch (Septoria spp.), GLA, grain yield (t/ha@150 g moisture/kg) and grain protein concentration (mg/g) were conducted on all plots. Mean GS was determined for relevant assessment using a decimal scale (Zadoks et al. Reference Zadoks, Chang and Konzak1974).
Disease assessments took place between GSs 37–93 (May–August) to capture information on levels of infection prior to leaf senescence. Area of powdery mildew, brown and yellow rust, Septoria spp. and GLA (proportion) were assessed on 10 randomly selected flag leaves per plot. Grain moisture content at harvest was determined by conductivity (Protimeter Grainmaster I; GE Protimeter plc, Buckinghamshire) such that yields could be corrected to 150 g/kg moisture content. Grain samples from each plot were assessed for grain protein using the wet chemistry method of Dumas combustion.
Analysis
Cultivar superiority (CS) and residual maximum likelihood (REML) analyses were carried out using Genstat® version 10, 2007 (VSN International Ltd, Hemel Hempstead, UK). The program was adapted by R. Payne (personal communication) for CS analysis from the statistical method of Lin & Binns (Reference Lin and Binns1988). For each cultivar, this is the sum of the squares of the differences between its mean in each environment and the mean of the best cultivar there, divided by twice the number of environments. A low CS value indicates a cultivar that has high and stable performance. The CS analysis provides an overall rank of variety performance across sites. The CS analysis of rank is different from an analysis of the mean rank at each individual site (4 sites over 3 years) because there is only one value for each data set (e.g. two organic sites, 3 years). The rank values can be analysed using ANOVA to derive an s.e.d. (and a P value) appropriate for comparing overall yield in organic v. yield in non-organic systems. The REML variance components analysis used grain yield as the response variate, the fixed model was Constant+system+system×cultivar, and the random model was Experiment+Experiment×block.
RESULTS
The weather conditions during early growth indicated that 2006/07 was a wetter year compared to the other trial years across the four trial sites and Sheepdrove (the most westerly site) generally received higher rainfall overall. The mean yields in 2004/05 and 2005/06 were higher at Metfield compared to Morley. No clear differences are evident for the mean temperature or rainfall, and differences in mean yield may be attributed to other environmental factors. In 2004/05 and 2005/06, the mean yield at Wakelyns exceeded Sheepdrove; Sheepdrove was generally wetter and cooler and may explain a proportion of the difference in cultivar performance between the two organic sites (Table 2).
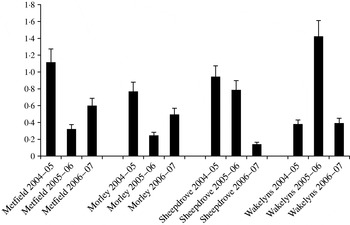
A REML variance component analysis for yield (Fig. 1) shows there was no clear trend in any of the 3 years of the relative contribution of site to the cultivar yield variability at the two organic sites (Sheepdrove and Wakelyns) or the non-organic sites (Metfield and Morley).
Variance estimate for yield (t/ha@150 g moisture/kg) for four sites (Metfield, Morley, Sheepdrove and Wakelyns) for 3 years (2004/05, 2005/06 and 2006/07). The error bars indicate the standard error.

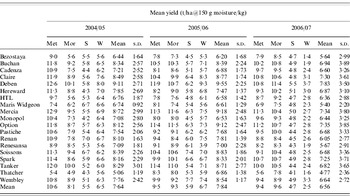
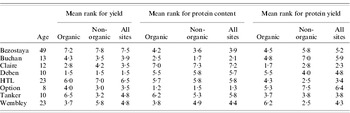
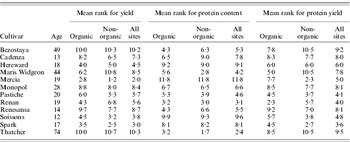
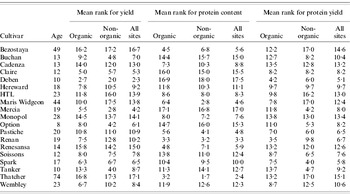
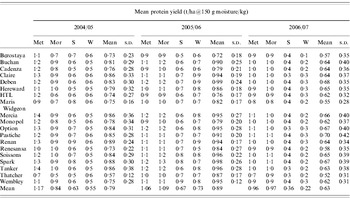
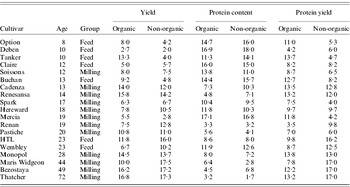
Grain yield was, on average, 44% lower in the organic compared to non-organic systems, with the greatest yields recorded for Morley followed by Metfield, Sheepdrove and Wakelyns. The average yields for Year 1 were 7·60 t/ha, 7·80 t/ha for Year 2 and 6·53 t/ha for Year 3. The highest mean yield recorded was for Deben and the lowest for Bezostaya (Table 3); based on the yield figures alone, Deben or Mercia may be considered the best choice for all systems. Deben and Bezostaya had the highest and the lowest ranks, respectively, in the feed group for yield CS in both organic and non-organic systems, and across all four sites (where ‘highest ranking’ means the lowest value in the table, and vice versa, as a lower CS value indicates greater stability; Table 4). In the milling group, the highest rank of yield CS was recorded for Mercia in organic and non-organic systems, and across all four sites (Table 5). For the ‘all’ group, the highest-ranking cultivar for yield was Deben and the lowest was Thatcher (Table 6). There was a tendency for Buchan (registered in 1995), Mercia (1989), Option (2000) and Tanker (1998) to perform relatively better for ranking of yield CS at non-organic compared to organic farms; in contrast, Hereward (released in 1990), HTL (released as breeding material in 1985), Maris Widgeon (registered in 1964), Renan (1989) and Wembley (released in 1985) had relatively better yield CS in organic conditions (Table 6).
Mean yields (t/ha@150 g/kg moisture content) with standard deviation (s.d.) of varieties at sites Metfield (Met), Morley (Mor), Sheepdrove (S) and Wakelyns (W) in trial years 2004/05, 2005/06 and 2006/07

The mean rank of CS in the feed category, for the characters of yield, protein content (mg/g) and protein yield for the two organic, two non-organic sites separately and for all four sites combined

The mean rank of CS in the milling category, for the characters of yield, protein content (mg/g) and protein yield for the two organic, two non-organic separately and for all four sites combined

The mean rank of CS for all varieties trialled, for the characters of yield, protein content (mg/g) and protein yield for the two organic, two non-organic sites separately and for all four sites combined

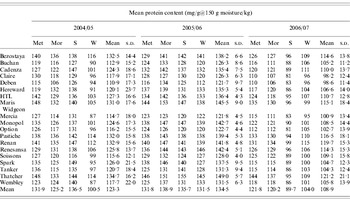
The mean protein concentration at the two non-organic farms was 128 mg/g compared to 116 mg/g (corrected to 150 g moisture per kg) at the organic farms. The highest grain protein levels were recorded at Metfield, followed by Morley, Sheepdrove and Wakelyns. The highest mean protein concentration was recorded in Year 2 at 135 mg/g and the least in Year 3 at 109 mg/g (Table 7), which corresponds to the weather data with Year 3 generally being wetter and cooler in May–July compared to Year 2 (Table 2).
Mean protein content (mg/g@150 g/kg moisture content) of trial varieties at sites Metfield (Met), Morley (Mor), Sheepdrove (S) and Wakelyns (W) in trial years 2004/05, 2005/06 and 2006/07

Within the milling group, the highest ranking cultivar for protein CS across systems was Thatcher and the lowest Mercia, with cultivars Bezostaya, Cadenza and Renesansa tending to rank higher in organic systems, and Maris Widgeon, Pastiche and Thatcher higher in non-organic systems (Table 5).
Protein yield was 48% higher under non-organic compared to organic conditions, with the highest mean at Metfield, followed by Morley, Sheepdrove and then Wakelyns. The greatest mean protein yield was recorded in Year 2 and the least in Year 3 (Table 8). Within the milling group, Mercia, Pastiche, Renesansa, Soissons and Spark ranked higher for protein yield CS at the non-organic compared to the organic sites, and Bezostaya, Maris Widgeon, Renan and Thatcher ranked higher for protein yield CS at the organic sites (Table 5). Across all cultivars, Renan achieved the best mean protein yield CS ranking at organic sites, and Spark at the non-organic sites (Table 5).
Mean protein yield (t/ha@150 g/kg moisture content) with s.d. of trial varieties at sites Metfield (Met), Morley (Mor), Sheepdrove (S) and Wakelyns (W) in trial years 2004/05, 2005/06 and 2006/07

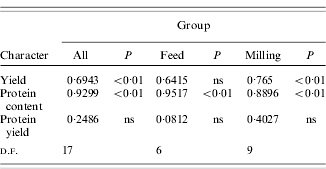
Table 9 provides the correlation coefficients between the organic and non-organic cultivar CS ranks. Despite differences in the relative performance of some cultivars between the two systems (as stated above) there is a significant (P=0·01) positive correlation in cultivar performance for grain protein content across cultivar groups. This trend is also evident in cultivar performance for yield, with the exception of the feed group. However, when the protein yield ranks are assessed for correlations between organic and non-organic systems, no significant trend is evident for any of the cultivar groups.
Correlations of CS ranking in organic and non-organic systems
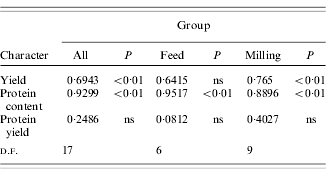
ns=not significant.
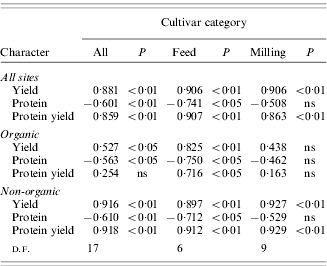
The correlations between cultivar age and yield CS, grain protein CS and protein yield CS (Table 10) were assessed for the two organic sites, the two non-organic sites, or for all four sites. For the feed group, there was a significant positive correlation between yield CS and age within the organic, non-organic and all sites. For the milling group, there was a positive correlation of yield CS with age in non-organic systems (and across ‘all sites’), but not in organic systems. There was a positive correlation between yield CS and age when all the 19 cultivars were assessed at the organic, non-organic and at the four sites (Table 10).
Correlation coefficients for cultivar age with CS for yield (t/ha@150 g moisture/kg), protein content (mg/g@150 g moisture/kg) and protein yield (t/ha) at all four sites (Metfield, Morley, Sheepdrove and Wakelyns), and at the two organic sites (Sheepdrove and Wakelyns) and at the two non-organic sites (Metfield and Morley) considered separately
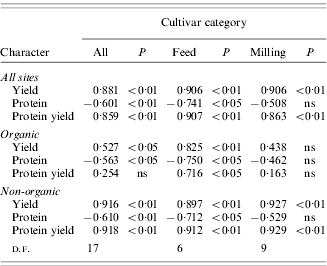
ns=not significant.
A weaker, but negative correlation for grain protein CS was found between the milling, feed and ‘all’ groups and the age of cultivar. For the milling group, there was no detectable correlation, indicating that across the ages of the cultivars studied there has not been a significant change in CS for quality. For the feed and the ‘all’ cultivar groups, there was a reduction in performance (P=0·05) in grain protein CS over time (Table 10).
The analysis of yield and grain protein concentration does not take into account the total protein yield for each cultivar. The positive correlation at all sites, and at the non-organic sites between cultivar age and protein yield CS indicates that there has been a significant increase in protein yield performance over the time period during which the cultivars were released (Table 10). This demonstrates that the significant negative correlation between age and grain protein CS is likely to be attributed to: (i) a dilution effect within the crop – more grain but of lower protein content; and (ii) breeding selection in favour of yield characteristics. The assessment of protein yield highlights that for the cultivars studied, yield increased with time, the protein concentration has either decreased or stayed the same, and that the protein yield improvement is simply a result of the relative changes in yield and protein concentration.
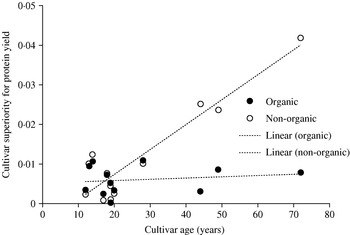
The positive correlations between protein yield CS and cultivar age are weaker across the three cultivar groups in organic systems compared to non-organic. For the milling and ‘all’ cultivar group, there was no detectable correlation at the organic sites (Table 10, Fig. 2).
Plot of cultivar protein yield superiority against cultivar age for non-organic trial sites, Morley and Metfield Hall (open circles) and organic trial sites (Sheepdrove Organic farm and Wakelyns Agroforestry) (closed circles) for 12 milling cultivars. A low value for superiority indicates a higher level of performance (stability of performance and total protein yield). Correlation coefficient for non-organic sites=0·929 (P=0·01), correlation coefficient for organic sites=0·163.

Analysis of CS ranks for yield, protein content and protein yield between organic and non-organic systems highlights cultivars that rank differently between systems (Table 11). The more modern cultivars, registered after 1989 (age 19) had a tendency to rank higher in non-organic systems, with Option and Buchan having a higher rank for yield, and Option, Tanker, Buchan, Spark and Mercia having a higher rank for protein yield. Cultivars registered before 1989 tended to rank higher in organic systems. Renan, HTL and Maris Widgeon had a higher rank for yield, and Renan, HTL, Wembley, Maris Widgeon and Thatcher had a higher rank for protein yield. Maris Widgeon, which ranked higher in non-organic systems, was the only cultivar to show a rank difference for protein content. Renan and Mercia were both registered in 1989 with Renan tending to perform better under organic conditions and Mercia under non-organic conditions.
Rank CS for varieties between organic and non-organic systems for yield, protein content and protein yield. The 19 cultivars were comprised of two groups: those selected for high yield potential (the ‘feed’ group) and those selected for bread-making potential (the ‘milling’ group)

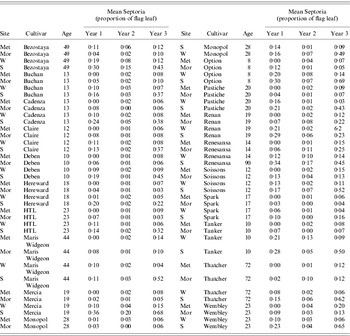
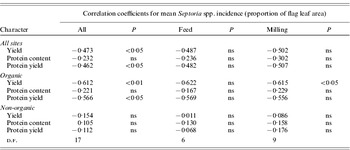
The cultivars were assessed for disease incidence, which included rust, powdery mildew, and Septoria spp., of which the last was the most prevalent. The incidence of Septoria spp. was assessed in mid-July (Table 12). There was a negative correlation between yield, grain protein content and protein yield with Septoria spp. incidence for the three cultivar groupings. However, the trend was only significant at the organic sites, and the ‘all’ group for yield and protein yield (Table 13). Although Septoria spp. presumably had a causal negative influence on yield this was not correlated with cultivar age.
Mean incidence of Septoria spp. (proportional area of flag leaf). The dates of the assessments for Metfield (Met), Morley (Mor), Sheepdrove (S) and Wakelyns (W) were 12, 15, 14 and 13 July in year 1 (2004/05); 5 July, 7 July, 19 June and 5 July in year 2 (2005/06); and 2 July, 5 July, 18 June and 3 July in year 3 (2006/07)

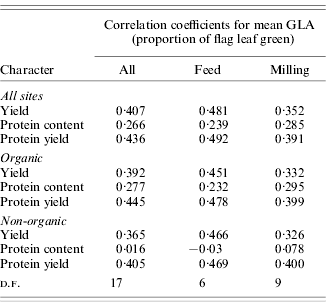
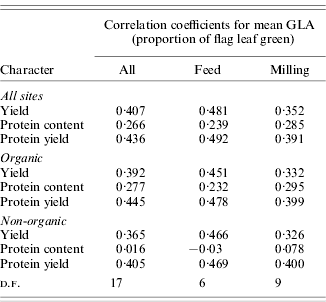
Correlation coefficients for mean GLA (proportional flag leaf green) against yield (t/ha@150 g moisture/kg), protein content (concentration (g/g)@150 g moisture/kg) and protein yield (t/ha) at all four sites (Metfield, Morley, Sheepdrove and Wakelyns) combined, and at the two organic sites (Sheepdrove and Wakelyns) and at the two non-organic sites (Metfield and Morley) separately for all years

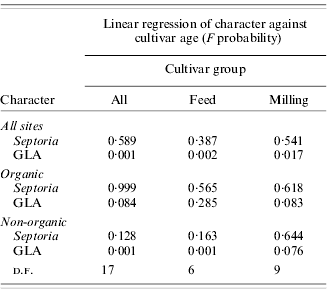
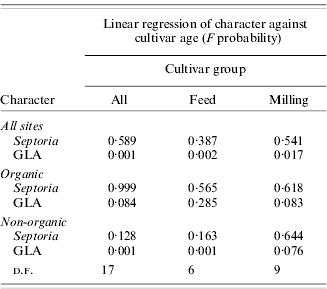
Assessments of GLA indicated that for the cultivars studied, there was no significant correlation between GLA and yield, grain protein content or protein yield for the three cultivar groups (Table 14). However, when GLA was regressed against cultivar age, there was a significant positive trend at non-organic sites for the ‘all’ group and for the feed group. This trend was repeated for the four sites together, but was not detectable at the organic sites (Table 15).
Correlation coefficients for mean Septoria spp. incidence (proportion of flag leaf area) against yield (t/ha@150 g moisture/kg), protein content (mg/g@150 g moisture/kg) and protein yield (t/ha) at all four sites (Metfield, Morley, Sheepdrove and Wakelyns) combined, and at the two organic sites (Sheepdrove and Wakelyns) and at the two non-organic sites (Metfield and Morley) separately for all years within the quality and yield group and all varieties
Linear regression results (F values listed) for Septoria spp. incidence (proportion of flag leaf area) and GLA (proportion of flag leaf green) against cultivar age at all four sites (Metfield, Morley, Sheepdrove and Wakelyns) combined, and at the two organic sites (Sheepdrove and Wakelyns) and at the two non-organic sites (Metfield and Morley) separately for all years within the milling and feed group and all varieties
DISCUSSION
The 44% mean yield reduction under organic conditions is consistent with other data comparing yields between organic and non-organic systems (e.g. Przystalski et al. Reference Przystalski, Osman, Thiemt, Rolland, Ericson, Østergård, Levy, Wolfe, Büchse, Piepho and Krajewski2008).
However, some cultivars performed relatively better in organic compared to non-organic systems for the different characters of yield and protein. Further analysis of these results using rank correlations identified a significant positive relationship for cultivar yield and grain protein content of the cultivars across both systems, but no significant trend was evident for protein yield. Hence, for the trial cultivars used, the ranking of cultivars in non-organic systems is an indicator of performance relating to grain protein content and yield in organic systems. Caution must be used in interpreting these results because the same weather and soil type at Wakelyns and Metfield are likely to have affected the potential for positive correlations. Wakelyns and Sheepdrove, on the other hand, exhibit considerable physical differences as well as different organic management systems.
There were some cultivars that ranked differently in organic compared to non-organic conditions. For the cultivars assessed, those that were registered before 1989 had a tendency to perform relatively better under organic conditions and post-1989 to rank higher in non-organic conditions.
Results recorded by Murphy et al. (Reference Murphy, Campbell, Lyon and Jones2007) from the trialling of 35 wheat genotypes in paired organic and non-organic systems in the USA revealed that in contrast to the present results, the genotypes that yielded well in non-organic systems ranked differently in organic systems. However, they did also identify a small number of broadly adapted genotypes which performed well across both systems. Since the selection criteria for cultivars were based on their recorded success, rather than the selections of genotypes in the F2 populations by Murphy et al. (Reference Murphy, Campbell, Lyon and Jones2007), it can be suggested that the cultivars trialled in the present study can be classified generally as the more ‘broadly adapted genotypes’.
Across farming systems, the most successful cultivars incorporate an increased ability to recover a greater level of mineral fertilizer or nitrogen within the soil profile and/or to produce more dry matter for a given level of nitrogen (Foulkes et al. Reference Foulkes, Sylvester-Bradley and Scott1998). Protein yield, which is the product of grain yield and grain protein content, defines the total tonnage of protein within the crop per hectare. Protein yield is therefore a valuable method of highlighting the ability of a cultivar to take up nitrogen and convert it to grain protein. From the current data, there was no correlation between the rank of cultivar protein yield between organic and non-organic systems. Based on the findings of Foulkes et al. (Reference Foulkes, Sylvester-Bradley and Scott1998), the difference may be due to the relative ability of cultivars to exploit soil nitrogen compared to mineral nitrogen fertilizer.
Further analysis, correlating CS and age, has provided insights into the effect of breeding from 1934 to 2000. The CS analysis developed by Lin & Binns (Reference Lin and Binns1988) was used successfully to quantify the relative stability of cultivar performance in terms of yield, grain protein content and protein yield. The current results are consistent with the fact that there have been major increases in CS of yield over time for cultivars selected for the higher inputs of the non-organic systems. Overall, greater improvements in performance stability were identified in the more modern cultivars when grown in non-organic compared to organic systems. CS integrates absolute and relative performance for any chosen character. Yield differences among cultivars were greater under non-organic than organic conditions, suggesting that such differences played a greater role in determining CS values under non-organic than under organic conditions. The greater improvements in the CS analysis in the non-organic systems may have been more to do with the effect of yield increases than stability which is supported by an absence of clear differences in variance estimates across sites. The stability trends were less evident under organic management, which supports the finding of Calderini & Slafer (Reference Calderini and Slafer1999) that the recent improvements in yield potential of cultivars are likely to be at the expense of yield stability. Moreover, the more modern cultivars are less able to maintain high performance in the more heterogeneous conditions of organic farms. These conditions generally include greater weed competition as well as reduced mineral nitrogen availability.
The protein yield CS of cultivars across the three groups was higher in the more modern (released after 1989) cultivars in the non-organic systems compared to those grown under organic conditions (for the milling cultivars, or all cultivars). This difference may be attributed largely to the more modern cultivars having a better ability to take up mineral nitrogen, but being less able to acquire soil nitrogen (Foulkes et al. Reference Foulkes, Sylvester-Bradley and Scott1998). Cultivars that are more suited to the nutritional regime of organic conditions are those that are capable of early season nutrient uptake, particularly of nitrogen, followed by the internal translocation at the point of, or before, grain filling (Baresel & Reents Reference Baresel, Reents, Lammerts van Bueren, Goldringer, Scholten and Østergård2007; Kichey et al. Reference Kichey, Hirel, Heumez, Dubois and Le Gouis2007). In wheat, an extensive evaluation of a range of cultivars over 11 seasons revealed that the more modern cultivars are better adapted to exploiting large volumes of mineral nitrogen (Foulkes et al. Reference Foulkes, Sylvester-Bradley and Scott1998).
The grouping of the trial cultivars has highlighted that the yield CS, grain protein CS and protein yield CS of more modern milling cultivars is lower compared to the older feed cultivars in the low yielding environment of the organic systems. The greatest difference between the two systems is for protein yield; a correlation coefficient of 0·928 occurred among milling cultivars for protein yield CS and cultivar age under the non-organic systems but a non-significant trend with a coefficient of 0·163 was quantified for protein yield CS and cultivar age at the organic sites. These results suggest that the more modern cultivars have a relatively poor ability to take up nitrogen in organic conditions compared to non-organic conditions. This data is supported by Foulkes et al. (Reference Foulkes, Sylvester-Bradley and Scott1998), who attributed the difference to the selection of phenotypes with longer tiller survival later in the season, but a slower early establishment. They suggested that increased canopy longevity is associated with greater resource capture. Analysis of GLA in the current experiment supports these findings. Cultivar GLAs taken at GSs 77–86 (across the 3 years) were significantly greater in the more modern cultivars at the non-organic sites but not the organic sites. This trend could not be wholly attributed to the incidence of Septoria spp. Leaf senescence is partially associated with stress, as well as genotype (Verma et al. Reference Verma, Foulkes, Worland, Sylvester-Bradley, Caligari and Snape2004). The difference in genotype senescence from the assessment of GLA would indicate that the greater stress under organic conditions reduces the longevity of the flag leaf. This effect could be postulated to explain the difference between protein yield CS for the cultivars in organic compared to non-organic conditions. Increased longevity favours late season resource capture, a clear advantage under intensive management with later season nitrogen availability. However, early resource capture is advantageous in organic conditions (Addisu et al. Reference Addisu, Snape, Simmonds and Gooding2009); a characteristic more prevalent in older cultivars. Further advantages of early crop development in organic conditions are associated with increased weed competitiveness. Weed competitive ability, and sensitivity to weeds has been found to vary in a range of winter wheat cultivars (Hoad et al. Reference Hoad, Topp and Davies2008).
Although wheat breeding in the UK over the last 50 or so years has made major advances in yield for cultivars grown in non-organic conditions, those cultivars are less well-adapted to organic conditions. Selection of cultivars under high agrochemical inputs results in cultivars that are less able to cope with environmental heterogeneity, and as a consequence have a lower stability of performance (Wolfe et al. Reference Wolfe, Baresel, Desclaux, Goldringer, Hoad, Kovacs, Löschenberger, Miedaner, Østergård and Lammerts Van Bueren2008). The findings reported in the present paper are supported by the general observation that UK organic farmers have a greater tendency to grow older cultivars (unpublished results). However, based on the present results the recommended lists could provide a rough guide for organic farmers when selecting feed cultivars. The selection of cultivars under less intensive management with a detailed understanding of the nitrogen source at different GSs is likely to identify genotypes with characteristics associated with resource capture more adapted to organic conditions, which is in agreement with other recent work (Baresel et al. Reference Baresel, Zimmermann and Reents1998; Ceccarelli Reference Ceccarelli1996; Murphy et al. Reference Murphy, Dawson and Jones2008; Wolfe et al. Reference Wolfe, Baresel, Desclaux, Goldringer, Hoad, Kovacs, Löschenberger, Miedaner, Østergård and Lammerts Van Bueren2008).
This work was funded by the UK Government Department for Environment, Food and Rural Affairs, and formed part of the work carried out in project AR0914. The authors would like to thank Roger Payne and his team at VSN International for their significant contribution in developing the CS analyses, to Lesley Fish at the John Innes Centre for helpful assistance in dealing with the cultivar classifications, and to Dr M. J. Gooding for his valuable contribution in the preparation of the manuscript.