1. INTRODUCTION
The Roma form a large minority in the European Union with an estimated population of 4–9 million [Pan and Pfeil (Reference Pan and Pfeil2003), Liégeois (Reference Liégeois2007a, Reference Liégeois2007b), Council of Europe (2012)]. Their low socio-economic status combined with violent incidents of discrimination has increased international alert and triggered the European Union to declare 2005–2015 “The Decade of Roma Inclusion” with the goal of improving their socio-economic status and social inclusion. Despite their poor outcomes being known in a popular sense, there is little systematic research documenting their situation. In this paper, I look at the development of a range of outcomes in Romania based on four population censuses conducted in 1977, 1992, 2002, and 2011. Outcomes and characteristics of family composition, housing conditions, education, language, and the labor market are examined and segmented by age or year of birth, urban versus rural, and gender. According to the censuses, the growing Roma population of Romania has reached 614,010 (or 3.1%) in 2011, but estimates range up to 1.8–2.5 million [ERRC and Danova-Rusinova (2004)], as many Roma tend not to reveal their ethnicity out of fear of stigmatization.Footnote 1
Looking at the Romanian censuses, I reveal many disadvantaged outcomes of Roma compared to the rest of the population, but also within Roma, among which females suffer from worse outcomes than men. The primary problem continues to be educational achievement, as school attendance and primary school completion remain low. The likelihood of young Roma attending school is low, sowing the seed for low educational achievement across future generations. The low levels of education are reflected in the labor market where unemployment among Roma is high and around 90% of those that work are clustered in blue collar occupations, many of which tend to belong to the informal sector. Controlling for observables, Roma have a 30% lower rate of employment and 76% higher rate of unemployment. Female Roma suffer from an even lower probability of employment than males. An Oaxaca–Blinder decomposition suggests that in 2011 still more than one quarter of the employment gap between Roma and non-Roma cannot be explained by observable characteristics. Comparing female and male Roma, the decomposition reveals that nearly 90% of the employment gap cannot be attributed to differences in observables. These two findings indicate that between the population groups, but also within Roma, discrimination or cultural practices might contribute to persistent inequalities beyond what we can observe in the data.
The level of segregation in the Romanian society is indicated by extremely low interethnic marriage rates that I document. In terms of housing, Roma suffer from worse conditions than non-Roma. In 2011, less than half of Roma dwellings compared to the rest of the population have a toilet, a sewage system or access to running water, and less than half the area and number of rooms per person. Also, access to electricity is considerably lower and there are more people per household. All these findings hold for rural as well as urban dwellings and potentially contribute to unhygienic circumstances and consequently health issues.Footnote 2
The Roma odyssey can be dated back to as early as the 15th century, when they were traded as slaves in what today is Romania. Roma slavery was institutionalized and was not abolished until 1856 [Crowe (Reference Crowe2007)]. Even after the end of slavery, misery continued as they were unskilled and a few received land. One of the darkest episodes of their history was the Nazi era in which between 1941 and 1942 an estimated 25,000–36,000 Roma were transported from Romania to concentration camps, and at least half fell victim to the Holocaust [Crowe (Reference Crowe2007)]. During the socialist era, under the influence of the Soviet Union, Roma were forced into agricultural collectives and heavy industry, whereas their traditional occupations were declared illegal [Gilberg (Reference Gilberg1974), Beck (Reference Beck1984)]. In the 1980s, Romanian president Ceausescu resettled entire villages and neighborhoods in his attempt of forcing assimilation [Crowe (Reference Crowe2007)]. Although they could surely not be considered an advantaged group in this historical period, they were largely assured basic education and employment [O’Higgins (Reference O’Higgins2010)], which seems to be one reason why their situation deteriorated between 1992 and 2002 with the rollback of the state. Discrimination and negative attitudes toward Roma remain high, as according to an Ethnobarometer survey taken in 2000, nearly 40% of non-Roma would prohibit Roma from settling in Romania [Ringold et al. (Reference Ringold, Orenstein and Wilkens2005)].
Concerning empirical studies on Roma, many studies are based on detailed non-representative surveys conducted by the UNDP in 2004 spanning nearly 30,000 observations across nine Eastern European countries.Footnote 3 The consensus is that Roma lag behind non-Roma in education, employment, and wages even when controlling for observables. Focusing on education using data collected by the UNDP in 2011, Brüggemann (Reference Brüggemann2012) and O’Higgins and Brüggemann (Reference O’Higgins and Brüggemann2014) show that Roma are more likely to be sent to remedial schools, which are often equipped poorly [ERRC and Danova-Rusinova (2004)], leading to lower levels of achievement. Using the same data, Cukrowska and Kóczé (Reference Cukrowska and Kóczé2013) show that Roma face poor housing conditions and among Roma, females achieve lower levels of education than men. For Roma actually still attending school in Hungary, Kertesi and Kézdi (Reference Kertesi and Kézdi2011b) find that a large share of the test-score gap between Roma and non-Roma students can be explained by social differences in income, wealth, and parental education. In Kertesi and Kézdi (Reference Kertesi and Kézdi2016), they can specifically link this gap to the home environment and parenting practices, finding that these factors can explain a substantial part. The representative nature of the data employed in my study allows us to conclude that not only test-score gaps are important, but also the enrollment gap, i.e., the extensive margin of education, plays an important role for children as young as seven. Moreover, this gap cannot be fully explained by parental characteristics.
An empirical study focusing on Roma inequality in Romania is based on a non-representative survey in 2000, finding that 70% of Roma were below the $4.30 Purchasing Power Parity (PPP) poverty line [Revenga et al. (Reference Revenga, Ringold and Tracy2002)]. Examining total household expenditures during the previous month in the same dataset, Rat (Reference Rat2005) finds that 39% of Roma households belong to the lowest quintile. The poorest, in particular rural, Roma survive on day labor and informal activities, such as recycling scrap metal [Revenga et al. (Reference Revenga, Ringold and Tracy2002)]. As a result of Roma underachievement in the labor market, the World Bank estimates a loss of 202–887 million Euro in Romania annually in productivity and fiscal contributions to the governments. The annual fiscal gains from bridging the employment gap are estimated at 2.4 times the total cost of investing in public education for all Roma children in Romania [De Laat (Reference De Laat2010)].
The study on Roma that bears the closest relation in terms of methodology is by Kertesi and Kézdi (Reference Kertesi and Kézdi2011a). They investigate the magnitude and drivers of the wage gap and low formal employment rate of Roma in Hungary using two surveys spanning 15 years. Although the census data used in my study do not contain information on earnings, the censuses provide larger representative samples stretching over a longer time period and shed light on demographic trends and determinants of (un)employment, occupational inequalities, and education. The presented study, to the best of my knowledge, is the first to provide a large scale descriptive quantitative overview with multiple data points of the Roma population in Romania documenting the evolution of disadvantages and allowing insights into trends and future challenges. I highlight the persistence of gaps in fertility rates and educational achievement, which already existed for birth cohorts as early as 1900. In Romania, the Roma form the largest group in terms of absolute numbers compared to the rest of Europe [Council of Europe (2012)].Footnote 4 Therefore, it is a particularly important place to understand the Roma disadvantages as the Roma are predominantly native, thereby forming a historically rooted minority. In many other countries, the Roma often have settled only recently or a few generations ago and hence other immigrants, rather than locals, could be considered the adequate control group. Their size and history make the Roma of Romania a particular compelling group to understand the evolution and trends of disadvantages faced. We know not only that gaps exist, but that they have persisted over generations and that they are likely to persist in the future. Moreover, the fact that the Roma population is growing at a high rate could exacerbate the impact of this lack of development and persistent inequality.
The paper is organized as follows: In Section 2, the data is described and basic demographics, household composition, and dwelling characteristics are compared. In Section 3, the human capital differences between Roma and the rest of the population are decomposed by looking at educational attainment, school attendance, literacy rates, and language. In Section 4, differences in labor market outcomes and occupation are explained, whereas Section 5 concludes.
2. DATA AND SAMPLE
The data are random representative 10% subsamples of each of the Romanian censuses from the National Institute of Statistics of Romania, which I obtained from IPUMS International [Minnesota Population Center (2017)].Footnote 5 The censuses include the entire Romanian population as all households are surveyed in face-to-face interviews irrespective of individual characteristics and legal situation. The 1977 census includes 619,904 households (4,309 Roma) and 1,937,021 individuals (19,716 Roma). In 1992, the sample covers 728,846 households (8,242 Roma) and 2,238,578 individuals (39,597 Roma). In 2002, there are observations of 732,016 households (11,378 Roma), and 2,137,967 individuals (52,619 Roma). In 2011, information on 746,908 households (14,730 Roma) and 1,991,924 individuals (61,401 Roma) is available. Information on the labor market is only available from the 1992, 2002, and 2011 censuses.Footnote 6
2.1. Demographics
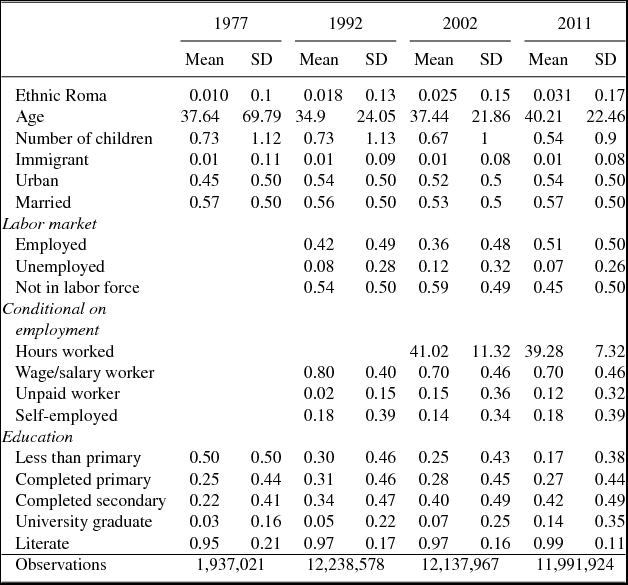
In Table 1, we see that Roma form a growing part of the Romanian population. While the non-Roma population has not increased between 1977 and 2011, the reported Roma population has tripled in the same time period, and now accounts for 3.1% of the total population. Generally, the share of Roma is assumed to be underestimated in the censuses, as many are assumed not to reveal their ethnicity in surveys.Footnote 7
Descriptive statistics of sample

Notes: For 1977 no labor market information is available. Hours worked are weekly hours worked conditional on employment. Number of children refers to own children in household.
Datasource: IPUMS International.
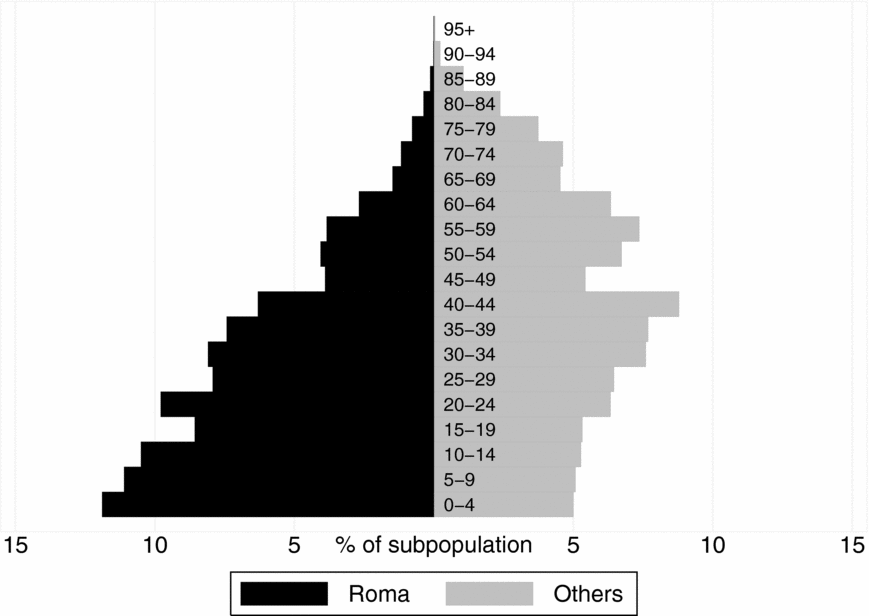
Not only has the share of Roma of the total population increased, but also the population pyramid in Figure 1 indicates the important role Roma will play in the future. Despite life expectancy being about 10 years lower for Roma [McKee (Reference McKee1997)], the fact that only 11% of the rest of the population is younger than 10 years old, compared to 23% of Roma, suggests that a growing share of working age population will be Roma in the future.
Population pyramid by ethnicity and age group in 2011. Datasource: IPUMS International.

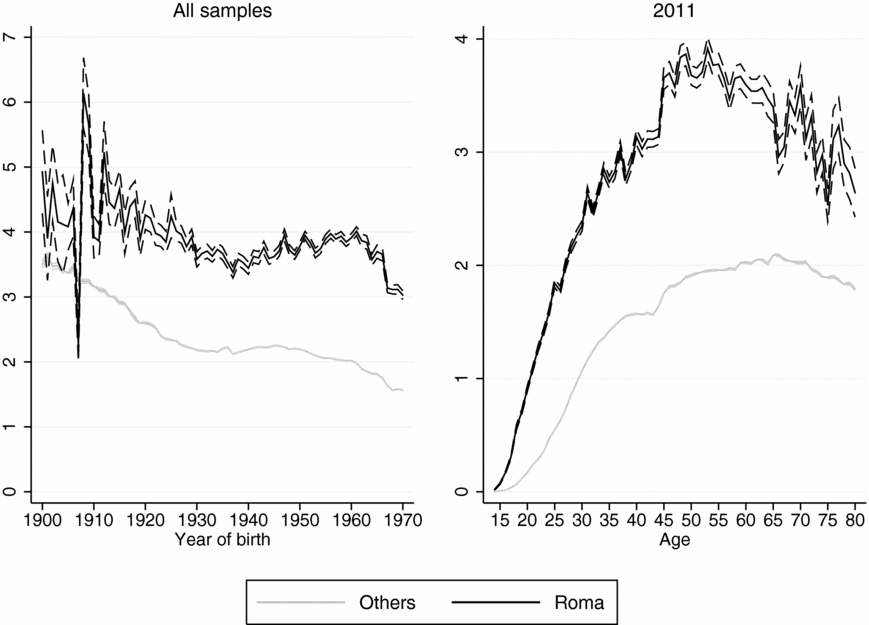
A different way of showing why the Roma population has grown in the past and is likely to continue to grow in the future is Figure 2. The panels show the number of live births per female for Roma (black line) and non-Roma (gray line) and the corresponding 95% confidence interval as dashed lines. The left panel includes all females above age 40 from all samples by year of birth.Footnote 8 We can see that the average number of children has been decreasing by cohort across the board. Although for non-Roma it has fallen below the replacement rate, it still is well above three children for Roma females. The right panel shows the number of children born for all women above age 14 in the 2011 sample. Here, it not only becomes clear that Roma have more children but also that many females already have children extremely early. At age 18, the average number of children born to a Roma female already is 0.57. In Online appendix Table B.3, I show that even controlling for education and county fixed effects, Roma females on average give birth to one additional child.
Number of children born per female by ethnicity. The left panel shows the average number of children by year of birth pooling all samples restricted to females above the age of 40. The right panel shows the average number of children by age using the 2011 sample only. The dashed lines represent the 95% confidence interval. Datasource: IPUMS International.

According to the censuses, the Roma are the third largest ethnic group in Romania (after Hungarians and Romanians) over the observed time period. In general, the population experienced urbanization between 1977 and 1992 during the transition from Communism, but afterwards the urban versus rural distribution has remained fairly stable. Although 54% of non-Roma live in urban neighborhoods in 2011, only 36% of Roma do so, as can be seen in Table B.1 of Online appendix. Interethnic marriage remains a rare event in Romania. Even in 2011, only 0.0013% of non-Roma household heads have a Roma spouse, whereas 93.1% of Roma household heads have a Roma spouse. On average, Roma are younger, have less education, and are less (more) likely to be (un)employed. In Table B.2 of Online appendix, we can see that within Roma, on average, females are less educated and less (more) likely to be (un)employed. In Sections 3 and 4, the education and employments gaps will receive systematic attention.
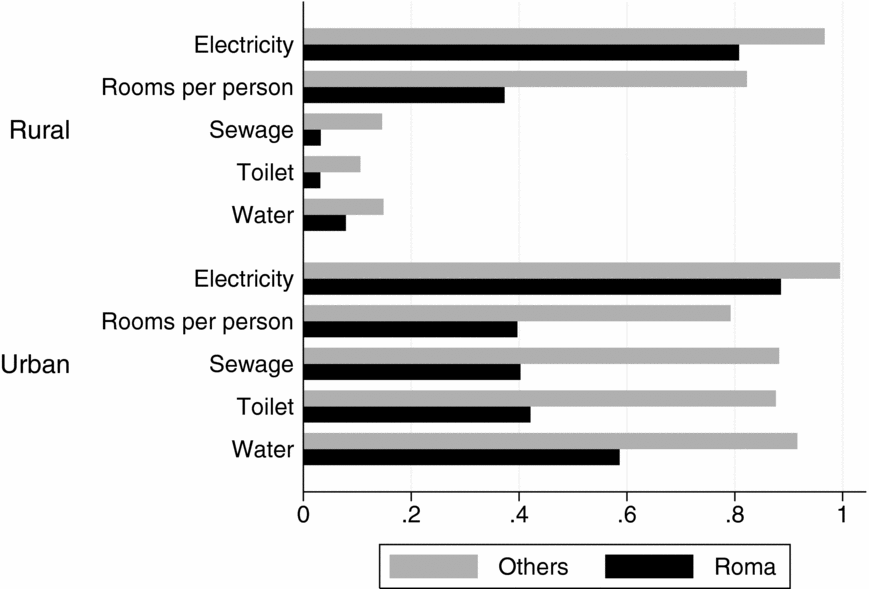
Roma are said to have strong family ties, which is reflected in their household composition. In 2011, on average 4.5 people live in one Roma household, whereas non-Roma share a household amongst around 2.6 people on average.Footnote 9 Despite having more people in a household, the Roma are not equipped with larger housing units. On average, Roma dispose of 12 m2 per capita, which is less than half of the area of others. These differences between the population groups have stayed large across the observed time period with no recognizable convergence. In Figure 3, we can see that Roma households, both rural and urban, are much less likely to be equipped with electricity, a sewage system, or toilets.
Dwelling characteristics of rural and urban Roma and others in 2011. “Room per person” is the average fraction of rooms per person shared in a household. All other bars represent the share of household dwellings equipped with electricity, a sewage system, and a toilet in rural (top) and urban (bottom) areas. Datasource: IPUMS International.

3. EDUCATION
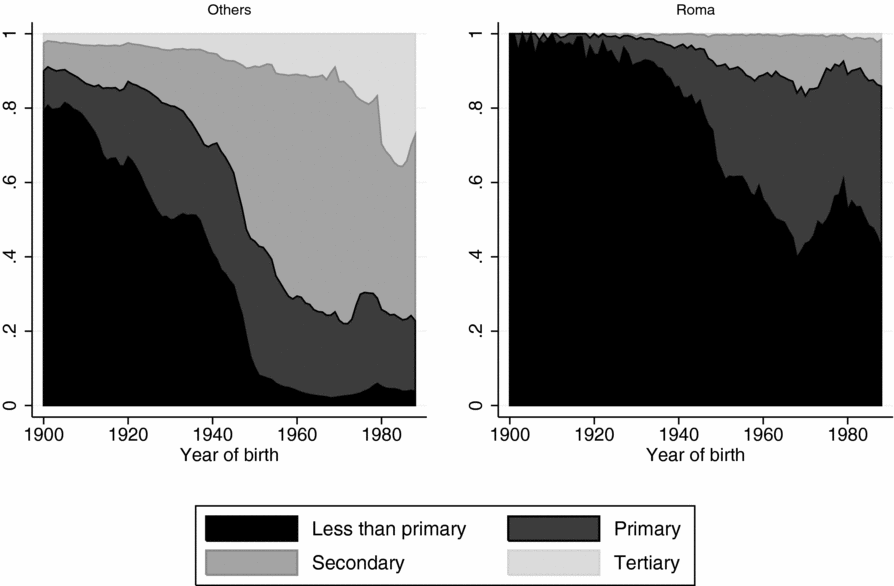
The educational attainment of Roma and others by year of birth is shown in Figure 4. Most recent cohorts of Roma are again finally showing signs of increasing completion of primary schooling and actually a minuscule but nonzero share has completed tertiary education. In Figure B.1 of Online appendix, the equivalent is presented for male and female Roma. As can also be observed in Table B.2 of Online appendix, female Roma consistently achieve lower educational levels than male Roma throughout the observed time period, with no systematic closure of the gap between male and female Roma noticeable.
Highest level of educational attainment of non-Roma and Roma by year of birth. This figure shows the fraction of the population and their highest level of education obtained by year of birth. The sample is restricted to individuals above the age of 22. Datasource: IPUMS International.

3.1. School Attendance
The lack of universal primary school completion amongst future generations of Roma can be deducted from Figure B.2 of Online appendix, where the percentage attending school in 2011 and the 95% confidence interval is plotted on the y-axis against age on the x-axis. When comparing the share of Roma (black line) to non-Roma (gray line), the attendance curve of non-Roma strictly dominates.
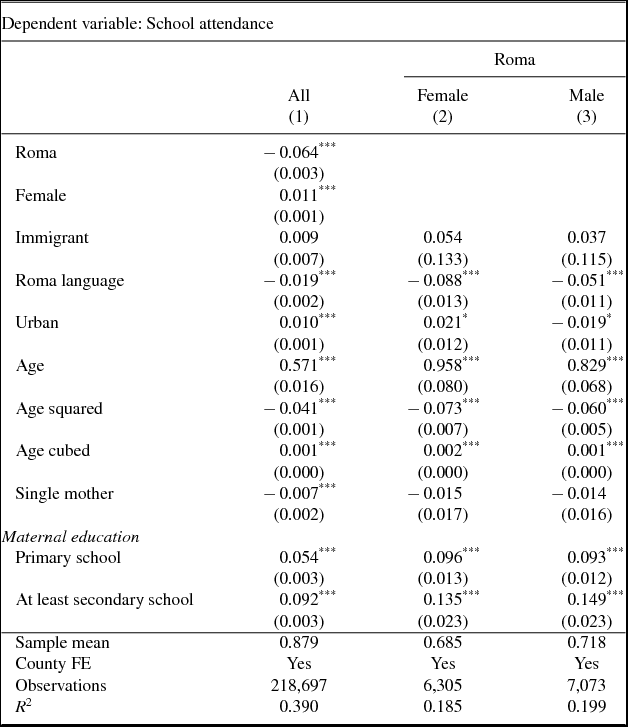
In order to estimate the effects of different circumstances on educational attainment of Roma, I run a logistic regression estimating whether an individual aged 7–18 attends school in 2011, which provides insights into the educational attainment of the next generation of workers. The estimation controls for a vector of individual (X i) and parental characteristics (Z i). The baseline model of the probability of an individual i attending school (schooli ∈ {0, 1}) can be written as Prob(schooli = 1|X i, Z i, Romai, πs) = f(X i, Z i, Romai, πs).
Individual controls include gender, the mother tongue of the child, whether they live in a rural or urban area, and county fixed effects πs. Age is controlled for by using a polynomial of degree 3 in order to account for the non-linear effect of age on school attendance.Footnote 10 Parental characteristics include maternal educational attainment and whether a father is in the household. Educational attainment is split into dummy variables for primary schooling completed and secondary or more schooling completed. Less than primary schooling forms the baseline category. In specification (1) of Table 2 one can see that despite all these controls, Roma still have a lower likelihood of attending school, as the Roma dummy has a negative coefficient, which is significant at the 1% level. Given a baseline attendance of 88%, Roma are, ceteris paribus, 7% less likely to be attending school.
Logistic regression estimating whether child attends school

Notes: Robust standard errors in parentheses. *p < 0.10, **p < 0.05, ***p < 0.01. Reported coefficients are marginal effects. The sample is restricted to individuals aged 6–18. In column (1), both Roma and non-Roma are included, whereas in columns (2) and (3) the sample is restricted to female and male Roma, respectively. County fixed effects and a constant term are included in all specifications. Baseline categories for dummy variables are the following: less than primary schooling for maternal education, male (Female), rural (Urban), non-Roma (Roma).
Given the data, we can only speculate about reasons such as parental demand for child labor, or lack of commitment or valuation of education.Footnote 11 Looking at the signs and significance of other coefficients, one sees that more factors contribute to the lower likelihood of Roma attending school. The probability of attending school is positively associated with maternal educational attainment and having a father present. Also, living in an urban settlement increases the probability of school attendance. Since Roma are less educated and more likely to live in rural areas, one can imagine that the education gap is far from closing. Furthermore, speaking a Roma language as a mother tongue decreases the likelihood of school attendance, which nearly half of Roma children do. This suggests that the misalignment of language spoken at home and language of instruction could play a role in explaining part of Roma underachievement in education.
In columns (2) and (3), I restrict the sample to Roma only and split the analysis by gender to see whether different characteristics have a differential impact on boys and girls. For girls, speaking a Roma language seems to be more detrimental. Living in an urban area increases attendance for girls while reducing it for boys. Although the other covariates exhibit similar effects across boys and girls, the overall attendance rate is lower for girls than for boys (68.5% vs. 71.8%). This could stem from the traditional role of the male breadwinner and females’ roles as housewives, therefore causing underinvestment in the education of female Roma.
3.2. Literacy and Language
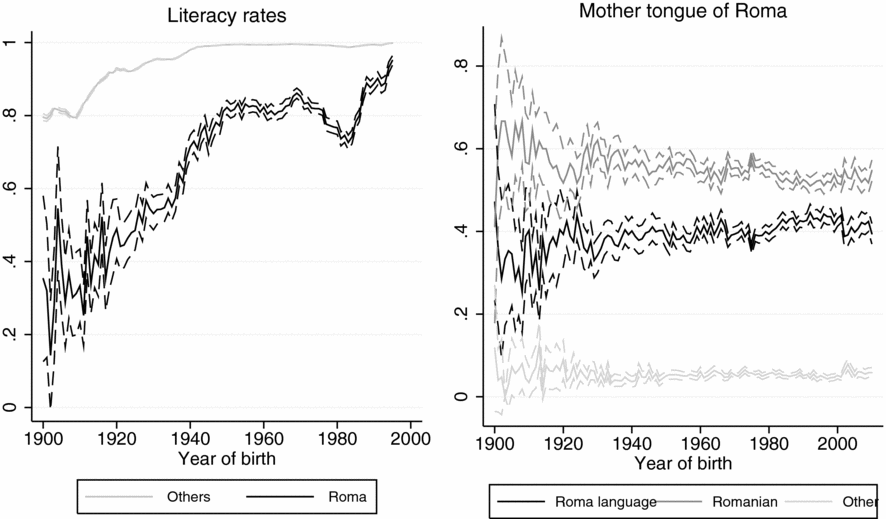
The low educational attainment of Roma is also reflected in literacy rates. In the left panel of Figure 5, literacy rates and corresponding 95% confidence intervals by year of birth of individuals aged 16 and over of both population groups are plotted for all four censuses together. For Roma, literacy rates, indicated by the black line, stagnate around the 80% level for cohorts born between 1950 and 1980. Then, for those born around 1980, the literacy rate actually drops steeply to almost 70%. The last cohorts of the sample enjoy an upward trend again, and the graph indicates that for most recent cohorts the gap is nearly closed.
Literacy rates and mother tongue of Roma by year of birth. The dashed lines represent the 95% confidence interval. The left panel shows literacy rates by ethnicity and year of birth. The sample is restricted to individuals above the age of 15. The right panel shows the shares of the Roma population speaking different mother tongues by year of birth. Datasource: IPUMS International.

Non-Roma females (gray line in left panel of Figure B.3 of Online appendix) catch up to males at the beginning of the 1940s achieving nearly full literacy. However, for Roma females, indicated by the gray line in the right panel, the gap persists across all birth cohorts in the sample until close to the very end, as it seems that those born after 1985 have finally caught up to males.
We previously saw that having a Roma language as mother tongue reduces the probability of school attendance by 8.8 and 5.1 percentage points for female and male Roma, respectively. In the right panel of Figure 5, we can see that around 50% of Roma of the most recent cohort still indicate that their mother tongue is a Roma language (black line), suggesting strong cultural transmission across generations. One reason contributing to dropout rates of Roma might be a misalignment of language of instruction and mother tongue of a large proportion of Roma. This is illustrated in Figure B.4 of Online appendix, where the school attendance rates by age in 2011 of Roma with Romanian as their mother tongue (gray line) strictly dominates the attendance rates of Roma who have a Roma language as mother tongue (black line). This has been recognized by the government, and efforts have been made to provide a number of special educational initiatives providing Roma children with a Roma language as language of instruction [ERRC and Danova-Rusinova (2004)].
4. LABOR MARKET
The low educational attainment of the Roma population of Romania is associated with worse outcomes in the labor market. Although there is no data on labor market outcomes for 1977, a similar gap as in education and literacy is observed for Roma in the labor market between 1992 and 2011. Although the entire population seems to have suffered between 1992 and 2002 due to the economic crisis, potentially attributable to mismanagement of privatization during the 1990s, both groups show improvements from 2002 to 2011.
In Figures B.5 and B.6 of Online appendix, I display employment (only salary/wage workers) and unemployment rates, respectively, for males (top) and females (bottom) for 1992 (left), 2002 (middle), and 2011 (right) over the lifecycle.Footnote 12 The gray line is for non-Roma, whereas the black line represents Roma. The dashed lines represent the 95% confidence interval. One can tell that for both males and females, there is a substantial (un)employment gap over most of the lifecycle. For males, the unemployment gap over the lifecycle has narrowed from 1992 to 2011, whereas for females it has widened substantially. In 2011, young Roma females face unemployment rates close to 80% compared to about 50% for young Roma males.
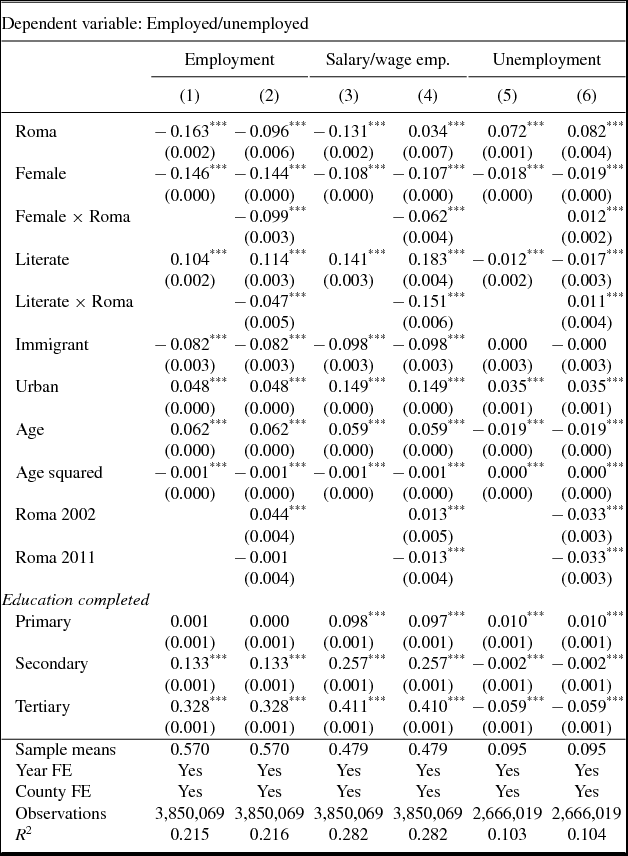
In order to estimate the disadvantage Roma experience in the labor market, I run logit regressions with employment excluding unpaid work [columns (1) and (2)], including only salary/work employment [columns (3) and (4)], and unemployment [columns (5) and (6)[ as the dependent variables while restricting the sample to individuals aged 16–64 not enrolled in education.Footnote 13 If Roma disadvantages stem from reasons beyond their education and other observable characteristics, then policies would have to consider that addressing the educational gap might not be sufficient. I control for a vector of individual characteristics X i including educational attainment, age, age squared, gender, literacy, and whether an individual lives in an urban or a rural area. Education is split into dummy variables for completion of primary, secondary, or tertiary schooling (with less than primary education forming the baseline category). Additionally, I control for county s and year t fixed effects, which are denoted as πs and ϕt, respectively. The estimation of the probability of an individual i being (un)employed ((un)empi ∈ {0, 1}) takes the form Prob((un)empi|X i, Romai, πs, ϕt) = h(X i, Romai, πs, ϕt).
The coefficient of the Roma dummy is (positive) negative and significant at the 1% level for (un)employment in all model specifications exhibited in Table 3. The exhibited marginal effects indicate that Roma have a disadvantage in the labor market that goes beyond their lack of education and differing geographic location. For instance, in columns (1) and (3), we find that Roma suffer a 16 and 13 percentage-point employment deficit, respectively, whereas in column (5) we see that the unemployment surplus amounts to 7.2 percentage points. Relative to baseline rates of 57% or 48% for employment and 9.5% for unemployment, this amounts to a 29% or 27% lower rate of employment and 76% higher rate of unemployment.
Logistic regression estimating (un)employment

Notes: Robust standard errors in parentheses. *p < 0.10, **p < 0.05, ***p < 0.01. Reported coefficients are marginal effects. The dependent variables are employment (either salary/wage workers or self-employed) in columns (1) and (2), salary/wage employment in columns (3) and (4), and unemployment in columns (5) and (6). The sample includes all individuals aged 16–64 not enrolled in education. County and year fixed effects and a constant term are included in all specifications. Baseline categories for dummy variables are the following: less than primary schooling (education), male (Female), non-literate (Literate), rural (Urban), non-Roma (Roma).
In column (2) and (4), I interact the Roma dummy with year dummies in order to see the trend of the Roma penalty in employment. I find that in 2002, the Roma disadvantage in employment decreased relative to 1992, but this improvement is muted by 2011 (and has even worsened for salary/wage work). I also interact the Roma dummy with the female dummy, finding that a female Roma, conditional on all other controls, has an even lower probability (−9.9 or −6.2 percentage points) of being employed. Whether this is due to discrimination within Roma and/or the gender role in Roma families, where the male is assumed to be the breadwinner, or due to discrimination from others, cannot be distinguished with the available data. By interacting the Roma dummy with literacy, I find that the return to literacy in terms of employment is only about half of what it is for non-Roma (6.7 vs. 11.4 percentage points) for self-employment or salary/wage employment. Remarkably, when only looking at salary/wage employment in column (4), illiterate male Roma are actually more likely to be employed (+3.4 percentage points) than their non-Roma equivalent. However, for literate Roma, which form the great majority, the disadvantage remains large and significant.
4.1. Decomposition of Employment Gap and Differences in Occupations
In order to identify how much of the gap in terms of salary/wage employment can be explained by observable characteristics, I decompose it following Oaxaca (Reference Oaxaca1973) and Blinder (Reference Blinder1973). Following the adaptation for a logit model presented in Yun (Reference Yun2004) and Borooah and Iyer (Reference Borooah and Iyer2005), the two-fold Oaxaca–Blinder decomposition splits the difference in employment rates into the part explained by differences in endowments X of the individuals and the gap arising due to discrepancies between the coefficients γ of the regressors of the two population groups. The labor market differential can be expressed as
 $$\begin{equation}
\underbrace{\bar{X}^{{\rm Roma}}\hat{\gamma }^{{\rm Roma}}-\bar{X}^{{\rm other}}\hat{\gamma }^{{\rm other}}}_{\rm Overall\ difference}=\underbrace{(\bar{X}^{{\rm Roma}}-\bar{X}^{{\rm other}})\hat{\gamma }^{{\rm other}}}_{\rm Explained\ difference}+\underbrace{\bar{X}^{{\rm Roma}}(\hat{\gamma }^{{\rm Roma}}-\hat{\gamma }^{{\rm other}})}_{\rm Unexplained\ difference}
\end{equation}$$
where  $\bar{X}^{{\rm Roma}}$ and
 $\bar{X}^{{\rm other}}$ are the average attributes of the Roma and non-Roma, whereas
 $\hat{\gamma }^{{\rm Roma}}$ and
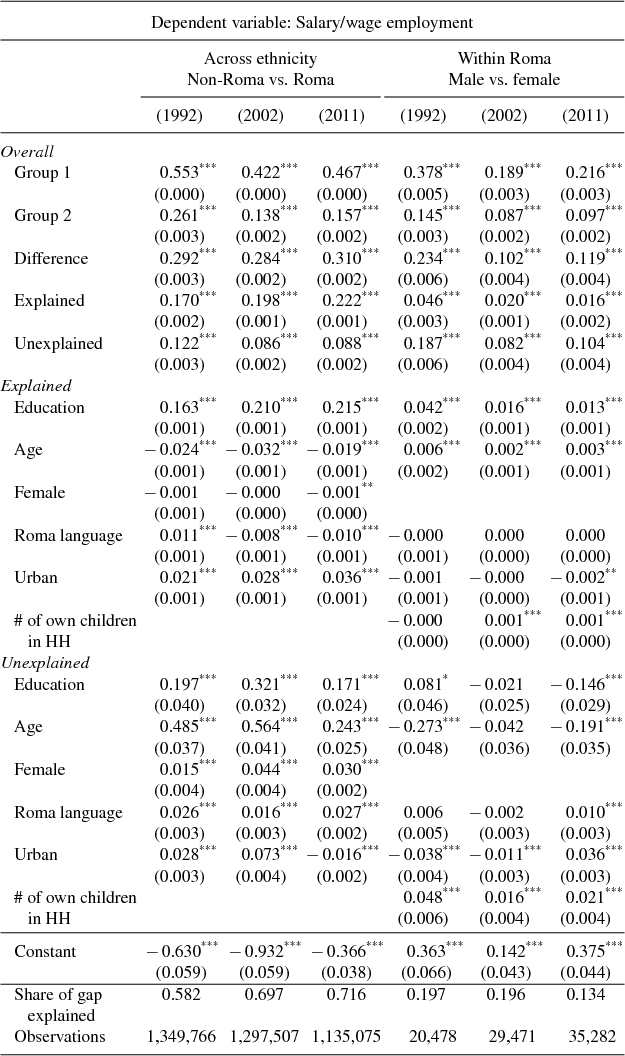
 $\hat{\gamma }^{{\rm other}}$ are the coefficients estimated from separate regressions for Roma and non-Roma, respectively. The left-hand side of equation (1) is the overall difference, which is displayed in the third row of Table 4. The first term on the right-hand side estimates the employment gap that can be attributed to differences in observable characteristics between the two groups and is decomposed in the middle block, whereas the second term is the residual that captures the effect that could be due to discrimination or cultural differences in the bottom block of Table 4. The rows within the middle and bottom block sum up to the explained and unexplained share displayed in rows four and five, respectively.
Oaxaca–Blinder decomposition of employment

Notes: Standard errors computed using the delta method in parentheses. *p < 0.10, **p < 0.05, ***p < 0.01. The dependent variable is salary/wage employment, i.e. excluding unpaid and self-employment. Group 1 are non-Roma and group 2 are Roma in the first three columns, whereas group 1 are Roma males and group 2 are Roma females in the last three columns. The sample includes all individuals aged 16–64 not enrolled in education. Education contains the aggregated effect of a dummy for literacy as well as categorical dummies for completion of primary, secondary, and tertiary education. Age contains both age and age squared.
Datasource: IPUMS International.
The first three columns are dedicated to each year separately of a comparison between non-Roma (group 1) and Roma (group 2), whereas the last three columns compare across gender within Roma, i.e., Roma males (group 1) to Roma females (group 2). The difference in employment between non-Roma and Roma has remained fairly constant around 30 percentage points. However, the share of this gap explained by observables has increased from 58% in 1992 to 72% in 2011. Although this could be interpreted in a good sense as a potential decrease in discrimination in the labor market, given that now observables can account for nearly three times as much as in 1992, the fact that the actual gap is nearly constant is worrying. Education, which I define as highest educational attainment as well as a binary variable for literacy, is responsible for most of the explained gap. For instance, in 2011 education accounts for 21.5 of the 22.2 explained percentage-point gap (97%).
Restricting the sample to only Roma, the explained part of the salary/wage employment gap between males and females has decreased from nearly 20% in 1992 to 13% in 2011, as can be seen in the last three columns of Table 4. Females’ disadvantages in the labor market are larger than observables suggest. The gap does not seem to be attributable to motherly obligations as including the number of children in the household hardly affects the results. The good news is that the gender gap has decreased from 23 percentage points in 1977 to 12 percentage points in 2011. However, this narrowing seems to have more to do with reduced employment rates of males rather than an increase in female employment.
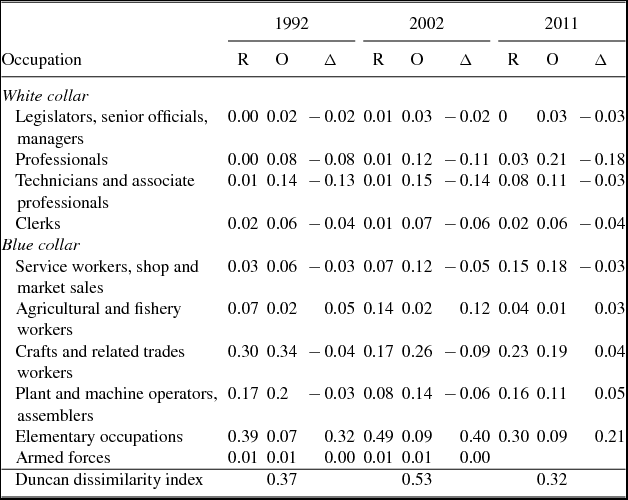
As can be seen in Table 5, Roma are clustered in blue collar occupations (nearly 90%).Footnote 14 In contrast, the rest of the population increased its share of white collar occupations from 30% in 1992 to 41% in 2011. The largest share of Roma work in elementary occupations, traditionally low skilled with low remuneration. The differential distribution across occupational categories is reflected by the Duncan dissimilarity index, where 0 indicates perfect similarity and 1 indicates perfect dissimilarity in occupations. Noticeably, this index increased from 0.37 in 1992 to 0.53 in 2002, before declining to 0.32 in 2011, meaning that in 2011 32% of workers would have to change occupation in order to equalize distributions.
Share of Roma and non-Roma by occupational category

Notes: This table presents the share of salary/wage employed Roma and non-Roma by occupation in each year. The columns headed by “R” are for Roma, whereas “O” represents others. Δ is the difference of the two. The Duncan dissimilarity index represents the share of workers that would have to change occupation in order to equalize distributions. Therefore, 0 indicates perfect similarity and 1 indicates perfect dissimilarity in occupations.
Datasource: IPUMS International.
5. CONCLUSIONS
The Roma are a disadvantaged and understudied minority across Europe. I fill the gap concerning the empirical evidence by exploring the Romanian censuses of 1977, 1992, 2002, and 2011. I show that in Romania, the Roma form a rapidly growing but segregated community with persistently weak socio-economic outcomes and higher fertility rates. Battaglia et al. (Reference Battaglia2017) show that residential segregation is causally linked to higher fertility among Roma in Serbia suggesting that desegregation could lower the high levels amongst the Roma to some extent.Footnote 15 The Roma lag behind the rest of the population in terms of all observed categories, be it dwelling characteristics, education, or the labor market. Even controlling for observables and parental characteristics, I find lower school attendance among the Roma, in particular among Roma girls. These attendance gaps are worrying for the future of the many young Roma in the Romanian population as they point to persistent inequality. Remedial programs, such as the Teaching Assistant Program in Serbia, have been shown to have positive effects on attainment [Battaglia and Lebedinski (Reference Battaglia and Lebedinski2015)]. At least the literacy gap has been narrowing for both male and female Roma, both of whom are now close to universal levels for most recent cohorts.
I present descriptive evidence that lower rates of employment and higher rates of unemployment of the Roma cannot be explained by their lower levels of educational achievement or other observable characteristics. An Oaxaca–Blinder decomposition of employment suggests that Roma might be suffering from discrimination, as their outcomes are even worse than their qualifications and circumstances suggest, especially for female Roma. Given that Roma form a growing share of the population, this is not only important for ethical and equity considerations, but also for the rest of society, as the Roma will form a large potential tax base and source of productivity to the Romanian and European economy. More causal evidence is required to gain a better understanding of why Roma remain in such a disadvantaged position in order to design appropriate policy measures.
SUPPLEMENTARY MATERIALS
To view supplementary material for this article, please visit https://doi.org/10.1017/dem.2017.19