1. Introduction
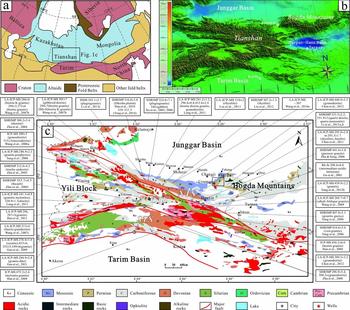
The Central Asian Orogenic Belt is the largest Phanerozoic juvenile crustal growth orogenic belt in the world, extending 7000 km from west to east, situated between the European Craton to the west, the Siberian Craton to the east, and the Tarim and North China cratons to the south (Fig. 1a; Charvet et al. Reference Charvet, Shu, Laurent-Charvet, Wang, Michel, Dominique, Chen and Koen2011). It has a relatively long history dominated by accretion of arcs, accretionary complexes, seamounts and oceanic plateaus (e.g. Şengör, Natal'in & Burtman, Reference Şengör, Natal'in and Burtman1993; Carroll et al. Reference Carroll, Graham, Hendrix, Ying and Zhou1995; Gao et al. Reference Gao, Li, Xiao, Tang and He1998; Jahn, Wu & Chen, Reference Jahn, Wu and Chen2000; Windley et al. Reference Windley, Alexeiev, Xiao, Kröner and Badarch2007; Xiao et al. Reference Xiao, Windley, Huang, Han, Yuan, Chen, Sun, Sun and Li2009; Wong et al. Reference Wong, Sun, Zhao, Yuan and Xiao2010; Han et al. Reference Han, He, Wang and Guo2011). The Tianshan lies in the southern part of the belt and contains units of ophiolites, volcanic rocks, granitoids, high-grade metamorphic rocks and sedimentary sequences (e.g. Gao et al. Reference Gao, He, Li, Xiao, Tang, Wang and Zhao1995, Reference Gao, Long, Klemd, Qian, Liu, Xiong, Su, Liu, Wang and Yang2009; Hu et al. Reference Hu, Jahn, Zhang, Chen and Zhang2000; Jahn, Wu & Chen, Reference Jahn, Wu and Chen2000; Wong et al. Reference Wong, Sun, Zhao, Yuan and Xiao2010). In the eastern segment of the Tianshan, the Bogda Mountains/region (hereafter referred to as the Bogda) are situated between the Junggar Basin to the north and the Turpan Basin to the south (Fig. 1b).
(a) Location of the Central Asian Orogenic Belt including major cratons and orogenic belts of Eurasia (modified after Wang et al. Reference Wang, Wu, Li, Zhu, Chen, Li, Wu, Deng and Chen2016a,b). (b) Digital topographic map of the Bogda Mountains and surrounding area. Topography from Geospatial Data Cloud. (c) Tectonic-geological sketch map of the Chinese Tianshan regions with the approximate location of Figure 2a shown with a box. The red stars represent the locations of the well core samples for zircon LA-ICP-MS U–Pb chronology analysis. The age data for igneous rocks in the NTS and adjacent tectonic units are shown in this picture. 1 – the northern margin fault of Central Tianshan; 2 – the southern margin fault of Central Tianshan; 3 – the northern Tarim margin fault; NTS – North Tianshan; CTS – Central Tianshan; STS – South Tianshan (modified from BGMRXUAR, 1993; Yang et al. Reference Yang, Jolivet, Dupont-Nivet, Guo, Zhang and Wu2012a; Wang et al. Reference Wang, Wu, Li, Zhu, Chen, Li, Wu, Deng and Chen2016a). The age data are from Gu et al. (Reference Gu, Hu, Yu, Zhao, Wu and Li2001), Han et al. (Reference Han, He, Wu and Li2004, Reference Han, He, Wang and Guo2011), Xu et al. (Reference Xu, Ma, Xia, Wang, Li, Xia and Wang2005, Reference Xu, Li, Ma, Xia, Xia and Peng2006), Zhu et al (Reference Zhu, Zhang, Gu, Guo and Zhou2005, Reference Zhu, Wang, Xu, Su, Wu and Wu2006, Reference Zhu, Li, Dong, Zhang, Hu and Wang2008), Wang et al. (Reference Wang, Faure, Cluzel, Shu, Charvet, Meffre and Ma2006, Reference Wang, Shu, Cluzel, Faure and Charvet2007b,c, Reference Wang, Wu, Li, Zhu, Chen, Li, Wu, Deng and Chen2016a), Yang et al. (Reference Yang, Li, Sun and Wang2006, Reference Yang, Wang, wang and Dang2012b, Reference Yang, Zhang, Guo, Fu, Si, Su, Wang and Chen2014), Zhu & Song (Reference Zhu and Song2006), Tang et al. (Reference Tang, Wang, Zhao, Wyman, Jiang and Jia2008), Gao et al. (Reference Gao, Long, Klemd, Qian, Liu, Xiong, Su, Liu, Wang and Yang2009, Reference Gao, Klemd, Qian, Zhang, Li, Jiang and Yang2011), Wang, Wang & Liu (Reference Wang, Wang and Liu2009), Chen, Shu & Santosh (Reference Chen, Shu and Santosh2011), Liu et al. (Reference Liu, Yang, Li, Chen, Xu, Li and Jia2011), Long et al. (Reference Long, Gao, Klemd, Beier, Qian, Zhang, Wang and Jiang2011), Chen et al. (Reference Chen, Zhang, Liu, Xiong, Yuan and Chen2012), Li et al. (Reference Li, Liu, Zhu, Chen, Chen and Jin2013a,b,c).

The Permian–Triassic of the Bogda is of particular interest because it spans a critical transition between the continental amalgamation during Devonian–Carboniferous time (e.g. Allen, Windley & Zhang, Reference Allen, Windley and Zhang1993; Carroll et al. Reference Carroll, Graham, Hendrix, Ying and Zhou1995) and the development of intracontinental orogenic reactivation in Mesozoic–Cenozoic time (e.g. Hendrix et al. Reference Hendrix, Graham, Carroll, Sobel, Mcknight, Schulein and Wang1992). However, the tectonic setting evolution of the transitional stage continues to be debated (Wartes, Carroll & Greene, Reference Wartes, Carroll and Greene2002; Fang et al. Reference Fang, Jia, Guo, Song, Xu and Liu2006; Yang et al. Reference Yang, Jolivet, Dupont-Nivet, Guo, Zhang and Wu2012a; Tang et al. Reference Tang, Zhang, Li, Li, Chen and Guo2014). For instance, (1) the Bogda have been considered to be a Carboniferous island arc (Ma, Shu & Sun, Reference Ma, Shu and Sun1997; Laurent-Charvet et al. Reference Laurent-Charvet, Monié, Charvet, Shu and Ma2003; Xie et al. Reference Xie, Luo, Xu, Chen, Hong, Ma and Ma2016a,b), a rift zone during Carboniferous–Permian time (He et al. Reference He, Li, Liu and Zhou1994; Gu et al. Reference Gu, Yu, Hu and Li2000; Wang et al. Reference Wang, Wu, Li, Zhu, Chen, Li, Wu, Deng and Chen2016b), a Carboniferous island arc superimposed by an Early Permian rift (Shu et al. Reference Shu, Zhu, Wang, Faure, Charvet and Cluzel2005), or part of a mantle plume-related large igneous province (Xia et al. Reference Xia, Xia, Xu, Li, Ma and Wang2004a, b). (2) The prototype of the southern Junggar Basin in Permian time has been suggested to be a foreland basin (Hendrix et al. Reference Hendrix, Graham, Carroll, Sobel, Mcknight, Schulein and Wang1992; Carroll et al. Reference Carroll, Graham, Hendrix, Ying and Zhou1995; Hendrix, Reference Hendrix2000; Chen et al. Reference Chen, Zhang, Tang and Bai2001), a transtensional basin (Allen, Şengör & Natal'in, Reference Allen, Şengör and Natal'in1995; Cai, Chen & Jia, Reference Cai, Chen and Jia2000; Chen, Wang & Wang, Reference Chen, Wang and Wang2005) or a fault-controlled depression during an extensional tectonic episode (Fang et al. Reference Fang, Jia, Guo, Song, Xu and Liu2006; Yang et al. Reference Yang, Jolivet, Dupont-Nivet, Guo, Zhang and Wu2012a; Liu, Guo & Zhang, Reference Liu, Guo and Zhang2013; Wang et al. Reference Wang, Wu, Li, Zhu, Chen, Li, Wu, Deng and Chen2016b). (3) The initial uplift time of the Bogda has been regarded as latest Palaeozoic (Wang et al. Reference Wang, Li, Zhou, Lu, Liu and Li2003), Early–Middle Jurassic (Hendrix et al. Reference Hendrix, Graham, Carroll, Sobel, Mcknight, Schulein and Wang1992; Greene et al. Reference Greene, Carroll, Hendrix, Graham, Wartes and Abbink2001, Reference Greene, Carroll, Wartes, Graham and Wooden2005; Tang et al. Reference Tang, Zhang, Li, Li, Chen and Guo2014) and Late Jurassic (Zhang et al. Reference Zhang, Liu, Zhang, Wang and Yu2005; Fang et al. Reference Fang, Song, Jia, Wang and Yuan2007). And (4) the process of tectonic evolution in the Bogda from Carboniferous to Triassic time is still enigmatic (Tang et al. Reference Tang, Zhang, Li, Li, Chen and Guo2014 and references therein). Lots of researchers have focused on the age, nature and tectonic setting of the various tectonostratigraphic units in the Bogda (Shu et al. Reference Shu, Zhu, Wang, Faure, Charvet and Cluzel2005; Fang et al. Reference Fang, Jia, Guo, Song, Xu and Liu2006; Yang et al. Reference Yang, Jolivet, Dupont-Nivet, Guo, Zhang and Wu2012a; Tang et al. Reference Tang, Zhang, Li, Li, Chen and Guo2014 and references therein), but detailed provenance analyses of these units are still lacking. Provenance analysis, as the bridge linking the sedimentary basin to orogenic belts, is one of the most important parts in reconstructing the tectonic evolution (Nie et al. Reference Nie, Horton, Saylor, Mora, Mange, Garzione, Basu, Moreno, Caballero and Parra2012). Recent studies showed that using a combination of detrital zircon U–Pb geochronology, palaeocurrent measurement and sandstone petrography techniques can provide more reliable information on the provenance of sedimentary rocks (e.g. Gehrels, Yin & Wang, Reference Gehrels, Yin and Wang2003; Nie et al. Reference Nie, Horton, Saylor, Mora, Mange, Garzione, Basu, Moreno, Caballero and Parra2012; Gehrels, Reference Gehrels2014; Li et al. Reference Li, Chen, Wei, Wang and Han2015; Li, Chen & Wei, Reference Li, Chen and Wei2016). In this contribution, we combine conventional sandstone petrography, palaeocurrent measurement and detrital zircon U–Pb geochronology to reconstruct the clastic provenance and basin–mountain interaction in the Bogda from Late Carboniferous to Late Triassic time.
2. Geological setting and potential sediment sources
Traditionally, the Tianshan is subdivided into three tectonic units: the North Tianshan (NTS), Yili–Central Tianshan (YCTS) and South Tianshan (STS) from north to south (e.g. Gao et al. Reference Gao, Li, Xiao, Tang and He1998). The E–W-trending Bogda exclusively belongs to the northern part of the NTS (Fig. 1b). But considering the differences between the Bogda and the western segment of the Tianshan (NTS in this text), we describe the Bogda separately. The Tianshan results from complex accretions of island arcs and amalgamation of continental lithospheric blocks during late Palaeozoic time (Carroll et al. Reference Carroll, Graham, Hendrix, Ying and Zhou1995; Gao et al. Reference Gao, Li, Xiao, Tang and He1998; Charvet, Shu & Laurent-Charvet, Reference Charvet, Shu and Laurent-Charvet2007). The Tarim–STS and YCTS blocks collided during Devonian–Carboniferous time (e.g. Chen & Shi, Reference Chen and Shi2003; Han et al. Reference Han, He, Wang and Guo2011). This accretion was followed by the collision of the newly formed Tarim–YCTS blocks with a series of the late Palaeozoic island arcs now forming the NTS (e.g. Allen, Windley & Zhang, Reference Allen, Windley and Zhang1993; Han et al. Reference Han, Guo, Zhang, Zhang, Chen and Song2010; Charvet et al. Reference Charvet, Shu, Laurent-Charvet, Wang, Michel, Dominique, Chen and Koen2011). The following summary of the Palaeozoic geological history of the Tianshan, presented in Figure 1c and Table 1, is supported by a review of isotopic ages obtained from the volcanic rocks.
Predicted sediment provenance signatures for the NTS, YCTS and Bogda

Note: NTS – North Tianshan; YCTS – Yili–Central Tianshan; Bogda – Bogda Mountains/region
2.a. The North Tianshan (NTS)
The NTS is occupied by a W–NW-striking ophiolitic mélange zone that separates the YCTS Block to the south and the Junggar Block to the north (Allen, Windley & Zhang, Reference Allen, Windley and Zhang1993; Gao et al. Reference Gao, Li, Xiao, Tang and He1998; Han et al. Reference Han, Guo, Zhang, Zhang, Chen and Song2010, Reference Han, He, Wang and Guo2011). The southward subduction of the NTS oceanic crust beneath the YCTS Block during Devonian–Carboniferous time created the Yili–NTS magmatic arc (Carroll et al. Reference Carroll, Graham, Hendrix, Ying and Zhou1995; Gao et al. Reference Gao, Li, Xiao, Tang and He1998; Wang et al. Reference Wang, Shu, Cluzel, Faure and Charvet2007a,b; Charvet, Shu & Laurent-Charvet, Reference Charvet, Shu and Laurent-Charvet2007). It is mainly composed of Devonian marine volcano-sedimentary rocks, and Late Carboniferous volcanic rocks and tuffs (320–300 Ma; Wang et al. Reference Wang, Wu, Li, Zhu, Chen, Li, Wu, Deng and Chen2016a), intercalated with carbonates (BGMRXUAR, 1993). The Palaeozoic structures are intruded by numerous Permian post-collisional A-type granites (300–260 Ma; Han et al. Reference Han, Guo, Zhang, Zhang, Chen and Song2010; Chen, Shu & Santosh, Reference Chen, Shu and Santosh2011).
2.b. The Yili–Central Tianshan (YCTS)
The YCTS is located between the NTS and STS. The Central Tianshan and Yili are two continental units with Precambrian basements, and they are generally called the Central Tianshan Block and Yili Block (Wang et al. Reference Wang, Faure, Shu, Jong, Charvet, Cluzel, Jahn, Chen and Ruffet2010a, Reference Wang, Shu, Faure, Jahn, Cluzel, Charvet, Chung and Meffre2011) or YCTS Block (Gao et al. Reference Gao, Li, Xiao, Tang and He1998). The YCTS Block was mainly formed by two magmatic belts (Gao et al. Reference Gao, Li, Xiao, Tang and He1998; Han et al. Reference Han, He, Wu and Li2004). In the northern belt, the Devonian–Carboniferous arc-related volcanic rocks were generated by the NTS oceanic crust subducting southwards below the YCTS Block (420–360 and 320–300 Ma; Carroll et al. Reference Carroll, Graham, Hendrix, Ying and Zhou1995; Gao et al. Reference Gao, Li, Xiao, Tang and He1998; Wang et al. Reference Wang, Shu, Cluzel, Faure and Charvet2007b; Charvet, Shu & Laurent-Charvet, Reference Charvet, Shu and Laurent-Charvet2007; Han et al. Reference Han, Guo, Zhang, Zhang, Chen and Song2010; Li & Peng, Reference Li and Peng2013). Post-collisional A-type granitoids have also been reported in this belt (300–260 Ma; Wang et al. Reference Wang, Shu, Cluzel, Faure and Charvet2007b). The southern magmatic belt of the YCTS is composed of Ordovician–Early Carboniferous arc-related granitic plutons produced by the northward subduction of the STS oceanic crust (460–320 Ma; Wang et al. Reference Wang, Shu, Cluzel, Faure and Charvet2007a,c; Gao et al. Reference Gao, Long, Klemd, Qian, Liu, Xiong, Su, Liu, Wang and Yang2009; Han et al. Reference Han, He, Wang and Guo2011; Li & Peng, Reference Li and Peng2013).
2.c. The South Tianshan (STS)
The STS orogenic belt is bounded by the YCTS Block to the north and the Tarim Craton to the south, and is generally considered as the closure of the STS Ocean (Windley et al. Reference Windley, Alexeiev, Xiao, Kröner and Badarch2007; Han et al. Reference Han, He, Wang and Guo2011). It mainly consists of Palaeozoic strata (Carroll et al. Reference Carroll, Graham, Hendrix, Ying and Zhou1995), remnants of the STS oceanic lithosphere (Han et al. Reference Han, He, Wang and Guo2011), as well as active margin material of the Kazakhstan–Yili Block (Windley et al. Reference Windley, Alexeiev, Xiao, Kröner and Badarch2007; Han et al. Reference Han, He, Wang and Guo2011).
2.d. The Bogda Mountains/region (Bogda)
The Bogda, located in the northern part of the NTS, contains upper Palaeozoic to Quaternary sedimentary and igneous rocks (BGMRXUAR, 1993). The upper Palaeozoic strata in the Bogda is composed mostly of Carboniferous–Early Permian bimodal volcanic rocks (340–270 Ma; Allen, Windley & Zhang, Reference Allen, Windley and Zhang1993; Carroll et al. Reference Carroll, Graham, Hendrix, Ying and Zhou1995; Gao et al. Reference Gao, Li, Xiao, Tang and He1998; Gu et al. Reference Gu, Yu, Hu and Li2000, Reference Gu, Hu, Yu, Zhao, Wu and Li2001; Wartes, Carroll & Greene, Reference Wartes, Carroll and Greene2002; Shu et al. Reference Shu, Zhu, Wang, Faure, Charvet and Cluzel2005; Wang et al. Reference Wang, Faure, Shu, Jong, Charvet, Cluzel, Jahn, Chen and Ruffet2010b, Reference Wang, Xu, Ma, Chen, Zhu, Sun and Cui2015e). Of these, the Carboniferous volcanic rocks are dominated by basalts (Liang et al. Reference Liang, Guo, Gao, Fan, Qin, Zhou and Hei2011), but result in minor volumes of zircons. Moreover, there are also some Triassic thin amygdaloidal andesite intercalations reported in the Jimusaer region (250–200 Ma; BGMRXUAR, 1993; Wang et al. Reference Wang, Wu, Li, Zhu, Chen, Li, Wu, Deng and Chen2016b).
2.e. The Junggar Basin
The Junggar Basin, surrounded by active mountain ranges but with little internal deformation, is one of the most prominent walled sedimentary basins in western China (Carroll, Graham & Smith, Reference Carroll, Graham, Smith, Graham, Carroll and Ping2010). The triangle-shaped basin can be subdivided into six structural units (e.g. Qiu, Zhang & Xu, Reference Qiu, Zhang and Xu2008). The deepest one, lying along the northern edge of the NTS, is the southern depression that has collected about 16 km of sediments since Permian time (Qiu, Zhang & Xu, Reference Qiu, Zhang and Xu2008). The Permian magmatism in the Junggar Basin and its adjacent regions is generally attributed to an extensional tectonic setting (Ma, Shu & Sun, Reference Ma, Shu and Sun1997; Jahn, Wu & Chen, Reference Jahn, Wu and Chen2000; Wartes, Carroll & Greene, Reference Wartes, Carroll and Greene2002; Laurent-Charvet et al. Reference Laurent-Charvet, Monié, Charvet, Shu and Ma2003; Shu et al. Reference Shu, Zhu, Wang, Faure, Charvet and Cluzel2005, Reference Shu, Wang, Zhu, Guo, Charvet and Zhang2011).
3. Stratigraphic sequences
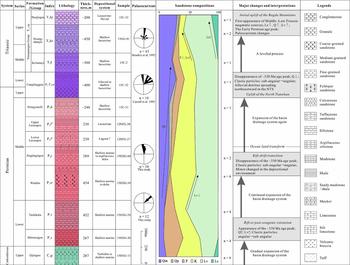
Thick continuous marine–terrigenous sequences from the upper Palaeozoic to Mesozoic are deposited in the Bogda. A summary of the observed and published descriptions of lithology, thickness, depositional system, palaeocurrent measurements and sandstone petrography is presented (Figs 2–5).
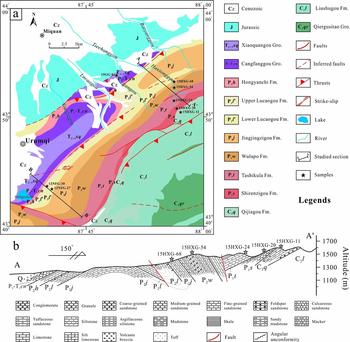
(a) Simplified geological map of the study area with the measured section of Figure 2b shown with a black line. (b) Measured section of the Upper Carboniferous to Lower Triassic strata along the Xiamenzi–Haxionggou section. The stars represent the location of the selected samples for zircon LA-ICP-MS U–Pb geochronology analysis.

Generalized stratigraphic column of the studied Upper Carboniferous to Upper Triassic series. See text for series descriptions, depositional environments, sandstone compositions and interpretations. The published palaeocurrent data are from Hendrix et al. (Reference Hendrix, Graham, Carroll, Sobel, Mcknight, Schulein and Wang1992) and Carroll et al. (Reference Carroll, Graham, Hendrix, Ying and Zhou1995).


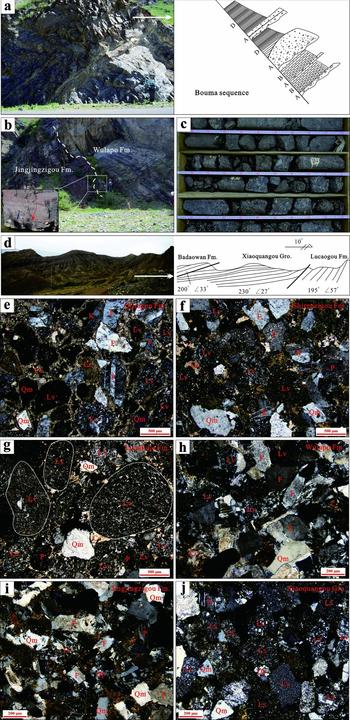
(a) Bouma sequence, including the A unit (graded bedding conglomerate), B unit (parallel bedding sandstone) and D unit (horizontal lamination); Qijiagou Formation, person (for scale) is 1.6 m tall. (b) An erosional contact (dashed line) which was caused by a relative sea-level fluctuation separating the Jingjingzigou Formation from the overlying Wulapo Formation; person (for scale) is 1.7 m tall. (c) Matrix-supported conglomerate, clasts are very poorly sorted, lack preferred orientation and a vertical grain-size trend; alluvial fan deposits of the Cangfanggou Group from the well core observation. (d) The angular unconformity contact between the Badaowan Formation, Xiaoquangou Group and Lucaogou Formation; sites were in the Aiweiergou area, Houxia; telegraph pole is 10 m high. (e–j) Photomicrographs of the sandstone samples under cross-polarized light; see text for details. Abbreviation of minerals: Cc – calcite; F – feldspar; K – potassium feldspar; Lv – volcanic/metavolcanic lithic fragment; Ls – sedimentary/metasedimentary lithic fragment; P – plagioclase; Qm – monocrystalline quartz; Qp – polycrystalline quartz.

The Carboniferous strata with a thickness of 1200–1800 m are the oldest rocks exposed in the Bogda. They are divided into two series, namely the Lower Carboniferous Qiergusitao Group (C1qr) and the Upper Carboniferous Liushugou Formation (C2l) and Qijiagou Formation (C2q) (BGMRXUAR, 1999). These formations mainly consist of sandstone, mudstone, limestone, turbidite, tuff, basalt and rhyolite; the only difference is the fossil assemblages developed in these rocks (Shu et al. Reference Shu, Wang, Zhu, Guo, Charvet and Zhang2011). The depositional environments were interpreted as turbidite to shallow marine systems (Figs 3–5a).
The Permian strata, more than 3000 m thick, can be divided into three series. The Lower Permian defined as the Jijicaozi Group (P1jj), which can be subdivided into the Shirenzigou Formation (P1s) and Tashikula Formation (P1t), is composed of sandstone, mudstone and chert intercalated with bimodal volcanic rock or alkaline basalt. The depositional environments were interpreted as shallow marine systems. The Mid Permian is further subdivided into four formations, namely the Wulapo Formation (P2w), Jingjingzigou Formation (P2j), Lucaogou Formation (P2l) and Hongyanchi Formation (P2h), which are composed of clastic rocks including conglomerate, sandstone, mudstone and oil shale. The depositional environments evolved from littoral–neritic systems in Early Permian time to delta–shallow-lacustrine systems in Middle Permian time, indicating a slight regression sequence (Figs 3, 4). The Upper Permian strata are composed entirely of non-marine sediments (Wartes, Carroll & Greene, Reference Wartes, Carroll and Greene2002), named the Cangfanggou Group. However, despite the bad outcrop exposure, and without any precise dating ages or biostratigraphy, the Cangfanggou Group is defined as Late Permian to Early Triassic in age (Zhou et al. Reference Zhou, Li, Yang, Hou, Liu, Cheng, Wu and Li1997).
The Cangfanggou Group (P3–T1ch) is transitional with the underlying strata, which is usually marked by variegated stratigraphy dominated by siliciclastic mudstone. But the lowermost strata mainly consist of red conglomerate with some argillaceous sandstone, showing characteristics of typical alluvial fan to shallow-lacustrine systems (Fig. 3, 5c; Li & Peng, Reference Li and Peng2013; Wang et al. Reference Wang, Wu, Li, Zhu, Chen, Li, Wu, Deng and Chen2016b). The Mid–Upper Triassic Xiaoquangou Group (T2+3xq) is subdivided into three formations: the Kelamayi Formation (T2k), Huangshanjie Formation (T3hs) and Haojiagou Formation (T3hj). These strata are marked by mudstone, argillaceous siltstone and sandy mudstone interbedded with conglomerate. This group was deposited in shallow-lacustrine to braided river systems (Fig. 3). The Triassic sediments are a fining-upwards depositional cycle, which reflects the increasing depth of water and expansion of the lake (Li & Peng, Reference Li and Peng2013).
4. Sampling and analytical methods
Four stratigraphic sections with a total thickness of ~4000 m were measured at a decimetre–metre scale in this study (Fig. 2). Among them, the Xiamenzi–Haxionggou section along the northern margin of the Bogda has been studied in detail because of their relatively good preservation and exposure of the Carboniferous to Triassic sedimentary series (Figs 2–4). Moreover, 12 sandstone samples ranging in age from Late Carboniferous to Late Triassic were collected from two field sections and two well cores for detrital zircon U–Pb geochronology analysis (Figs 1b, 2). Of these, six samples of the Upper Carboniferous – Upper Triassic strata were selected from the eastern Xiamenzi–Haxionggou profile (Fig. 2), two samples of the Lucaogou Formation from the western Niufengou profile (Fig. 2a), and four samples of the Upper Permian to Upper Triassic strata from the well cores near Urumqi (Fig. 1c). The sources of the sediments in the profiles and well cores share similar characteristics owing to their equivalent stratigraphic sequences and relatively short distances between sampling areas. The major characteristics of the samples are described in Table 2.
Summary of major characteristics of the sandstone samples

4.a. Sandstone petrography
Acquisition of sandstone compositional data from point-counting (systematic identification and classification of constituent minerals and lithic fragments) yields quantitative information on the contributing source lithology (Dickinson et al. Reference Dickinson, Beard, Brackenbridge, Erjavec, Ferguson, Inman, Knepp, Lindberg and Ryberg1983; Ingersoll et al. Reference Ingersoll, Bulard, Ford, Grimn, Pickle and Sares1984). A total of 28 thin-sections were counted according to the Gazzi–Dickinson method, in which the constituent mineral directly under the cross-hairs of the petrographic microscope is identified and counted (Dickinson, Reference Dickinson and Zuffa1985; Ingersoll et al. Reference Ingersoll, Bulard, Ford, Grimn, Pickle and Sares1984). For each sample, at least 300 individual grains were counted and categorized. Raw data were parameterized for each sample and calculated as total quartz (Qt = monocrystalline quartz (Qm) + polycrystalline quartz (Qp)), feldspar (F = plagioclase (P) + potassium feldspar (K)), and unstable lithic fragments of sedimentary/metasedimentary (Ls) and volcanic/metavolcanic (Lv) rocks. Raw data are presented in online Supplementary Material Table S1 available at http://journals.cambridge.org/geo. Representative thin-sections are shown in Figure 5.
4.b. Detrital zircon U–Pb geochronology
Crustal rocks generally contain zircons resistant to chemical weathering and post-depositional diagenetic processes (Nie et al. Reference Nie, Horton, Saylor, Mora, Mange, Garzione, Basu, Moreno, Caballero and Parra2012 and references therein). In cases where possible sources exhibit diagnostic zircon U–Pb age distribution patterns, one can infer the original source by dating zircons from the basin fill (Nie et al. Reference Nie, Horton, Saylor, Mora, Mange, Garzione, Basu, Moreno, Caballero and Parra2012). Zircon grains were dated by the laser ablation-inductively coupled plasma-mass spectrometry (LA-ICP-MS) method. Zircon grains were extracted using heavy liquid and magnetic methods, and further purified by hand-picking under a binocular microscope. Zircons were set in an epoxy mount, which was polished and then vacuum-coated with a layer of 50 nm high-purity gold. Cathodoluminescence (CL) images of the zircons were used to examine the internal structure of individual grains. CL images of representative zircon grains are presented in online Supplementary Material Figure S1 available at http://journals.cambridge.org/geo. LA-ICP-MS U–Pb zircon dating of the 12 samples was performed with an Agilent 7500c ICP-MS equipped with a 193 nm laser (COMPexPro102) at the Key Laboratory of Orogenic Belts and Crustal Evolution, Ministry of Education, School of Earth and Space Sciences, Peking University. The detailed analysis procedures are similar to those described by Yuan et al. (Reference Yuan, Gao, Liu, Li, Günther and Wu2004) and Li & Chen (Reference Li and Chen2014). The spot diameter was 32 μm. Zircon 91500 was used as an external standard age calibration, the standard glass NIST 610 was used to optimize the machine and zircon Plesovice was used as a monitoring standard. 207Pb/206Pb, 206Pb /238U and 207Pb/235U ratios and apparent ages were calculated using the GLITTER 4.0 program (Jackson et al. Reference Jackson, Pearson, Griffin and Belousova2004). Measured compositions were corrected to common Pb using the measured non-radiogenic 204Pb (Andersen, Reference Andersen2002). The age calculations and plotting of concordia diagrams were done by ISOPLOT 3.0 with uncertainties quoted at the 1σ standard deviation and 95% confidence levels (Ludwig, Reference Ludwig2003). The analytical data are given in online Supplementary Material Table S2 available at http://journals.cambridge.org/geo.
For usual U–Pb (LA-ICP-MS) dating of detrital zircons, approximately 80–120 grains for each sample need to meet the requirements for statistical analysis of a basic age distribution (Andersen, Reference Andersen2005). In this study, 90–100 grains from each sample were selected randomly for analysis, so the results should reflect the provenance characteristics. Ages with a discordance degree of > 10% were excluded from the analysis (Gehrels, Yin & Wang, Reference Gehrels, Yin and Wang2003; Gehrels, Reference Gehrels2014).
5. Results
5.a. Sandstone petrography
Raw point-count data were recalculated into detrital modes following the methods of Dickinson (Reference Dickinson and Zuffa1985) and plotted on Qt–F–L and Qm–F–Lt ternary diagrams (Fig. 6; Dickinson, Reference Dickinson and Zuffa1985). The sandstones from all samples in this study are lithic-rich (mean Qm16F42Lt42). They contain a large proportion of lithic volcanic grains, attesting to a dominantly volcanic provenance (Figs 3, 6). The trends in framework grain composition discussed below are derived from a subset of 28 thin-sections collected from the Xiamenzi–Haxionggou section, Niufengou section and well cores.
Relationship between framework composition and tectonic setting (after Dickinson, Reference Dickinson and Zuffa1985). The Upper Carboniferous to Upper Triassic sandstone compositional data were plotted on the Qt–F–L and Qm–F–Lt ternary diagrams. Qt – total quartzose grains; Qm – monocrystalline quartz; Qp – polycrystalline quartz; F – total feldspar grains; P – plagioclase grains; K – potassium feldspar grains; L – unstable lithic fragments; Lt – total lithic fragments; Lv – volcanic/metavolcanic lithic fragments; Ls – sedimentary/metasedimentary lithic fragments. Qt = Qm+Qp; L = Lv+Ls; Lt = L+Qp.

5.a.1. Quartz and feldspar grains
Quartz grain abundance increases steadily upwards from the Upper Carboniferous to Upper Triassic, balanced by a concurrent decrease in feldspar grains (Fig. 3). However, the sum of all types of quartz grains displays a slightly more pronounced decrease through the Mid Triassic Kelamayi Formation, because of a slight increase in the abundance of lithic grains (Fig. 3). From the Mid Permian Tashikula Formation to the Jingjingzigou Formation, the K grains increase from 18% to 38% (online Supplementary Material Table S1 available at http://journals.cambridge.org/geo), which could be evidence of increasing exposure of granitoids.
5.a.2. Lithic grains
The lithic grains are dominated by Lv grains with minor Ls grains, and the relative percentage of various lithic grain types shows the dramatic changes through time (Fig. 3). In the Upper Carboniferous samples, Lv and Ls (mainly bioclastic) fragments compose 28% of the framework grains. The Lv grains, mainly composed of intermediate–acid rocks, increase from the Upper Carboniferous to Lower Permian, reaching values of 56% in the Lower Permian Tashikula Formation. The percentage of Lv grains remains unchanged throughout the Mid–Upper Permian (40~46%). Both the Lv grains and, to a lesser extent, Ls grains increase from the Mid–Upper Triassic samples (Fig. 2). In contrast, the percentage of F grains decreases. F, Lv and Ls grain percentages for the Mid Triassic Kelamayi Formation are 37%, 41% and 0%, respectively, and 10%, 52% and 7%, respectively for the Mid–Upper Triassic Xiaoquangou Group.
In summary, the Lv grains dominate in the Upper Carboniferous through Lower Triassic sandstones, but a pronounced increase in Ls grains occurs in the Mid–Upper Triassic samples (Fig. 3). The most common Ls types are mudstone and sandstone containing some mica flakes (Fig. 5j). Furthermore, the percentage of Lv grains remains high throughout the Permian–Triassic strata, but an apparent decrease from the Tashikula to Wulapo Formation can be clearly observed (Fig. 3).
5.b. Detrital zircon U–Pb geochronology
The various zircon age groups and corresponding statistical data for the samples are shown in Table 3. Results for each sample are potted as relative age U–Pb concordia and probability density diagrams (Figs 7, 8). More than 1100 U–Pb zircon analyses have been conducted for 12 samples to satisfy the statistical requirements. Almost all the zircons have subhedral to euhedral crystal shapes, a variable grain size of 50–160 μm, low luminescence and concentric oscillatory zoning (online Supplementary Material Figure S1 available at http://journals.cambridge.org/geo), with Th/U values higher than 0.1 (online Supplementary Material Table S2 available at http://journals.cambridge.org/geo), implying an igneous origin (Pupin, Reference Pupin1980; Corfu et al. Reference Corfu, Hanchar, Hoskin and Kinny2003).
Summary of the various age groups and corresponding statistical data for the 12 samples

U–Pb concordia diagrams for zircon grains of the 12 sandstone samples.

Relative U–Pb age probability plots of detrital zircons of the Upper Carboniferous to Upper Triassic sandstone samples in the Bogda Mountains.

5.b.1. Late Carboniferous samples
A total of 91 zircon grains were measured for the Late Carboniferous sample 15HXG-11, which was collected from the Qijiagou Formation, and 90 effective data points were obtained. Ninety U–Pb analyses give a range of 206Pb–238U ages scattering between 352 and 277 Ma. The 206Pb–238U age spectrum has a major peak at 310 Ma (Fig. 8).
5.b.2. Early Permian samples
Sample 15HXG-20 from the Shirenzigou Formation yielded 90 effective data points with sufficient concordance and precision. The 206Pb–238U ages range from 868 to 284 Ma, and the ages can be divided into four groups: 300–284 Ma (21 grains); 320–301 Ma (peak at 308 Ma, 49 grains); 347–322 Ma (12 grains); and 501–362 Ma (7 grains). The oldest age, from this sample, is 868±12 Ma.
Sample 15HXG-24 was collected from the Tashikula Formation. Ninety-nine U–Pb analyses give a wide range of 206Pb–238U ages ranging from 501 to 296 Ma. Four age populations are evident: 300–296 Ma (7 grains); 320–301 Ma (peak at 304 Ma, 55 grains); 339–321 Ma (peak at 330 Ma, 35 grains); and 501–441 Ma (2 grains).
5.b.3. Middle Permian samples
Sample 15HXG-54 from the Mid Permian Wulapo Formation yielded 95 age points with sufficient concordance and precision. Unlike the Early Permian samples, the U–Pb age distribution of these zircons displays a more complicated pattern. The ages can be divided into four groups: 300–287 Ma (5 grains); 320–301 Ma (peak at 306 Ma, 30 grains); 358–322 Ma (peak at 340 Ma, with a subordinate peak at 332 Ma, 44 grains); and 540–361 Ma (peak at 516 Ma, 16 grains). However, the 206Pb–238U age spectrum has two major peaks at 340 and 306 Ma.
Sample 15HXG-68 was collected from the Mid Permian Jingjingzigou Formation. A total of 100 analyses were randomly selected from this sample, which yielded 100 effective data points with ages from 585 to 265 Ma. Four age populations are evident: 300–265 Ma (peak at 299 Ma, with a subordinate peak at 266 Ma, 36 grains); 320–301 Ma (peak at 318 Ma, 36 grains); 359–321 Ma (peak at 346 Ma, 19 grains); and 494–361 Ma (8 grains). One zircon yielded a 206Pb–238U age of 585±7 Ma.
Sample 12NFG-27 from the Lower Lucaogou Formation yielded 88 concordant analyses with ages from 1023 to 276 Ma. Four age groups were obtained: 299–276 Ma (peak at 293 Ma, 32 grains); 320–301 Ma (peak at 310 Ma, 34 grains); 359–321 Ma (19 grains); and 374–362 Ma (2 grains). One zircon yielded a 206Pb–238U age of 1023±14 Ma.
Sample 12NFG-30 is from the Upper Lucaogou Formation. Ninety zircon crystals were randomly selected from this sample and 87 effective data points were obtained. The 206Pb–238U ages range from 2421 to 266 Ma, which can be identified as four age populations: 300–266 Ma (peak at 299 Ma, 35 grains); 320–301 Ma (peak at 316 Ma, 23 grains); 358–321 Ma (peak at 330 Ma, 24 grains); and 472–399 Ma (3 grains). Two zircons yielded ages of 2421±37 Ma and 1465±20 Ma.
Sample 15C-31 was collected from the Hongyanchi Formation in the well core near Urumqi. A total of 100 grains were analysed from this sample, which produced 100 effective data points from 1462 to 272 Ma. Four age groups are evident: 300–272 Ma (7 grains); 320–301 Ma (peak at 315 Ma; 46 grains); 359–321 Ma (peak at 330 Ma; 44 grains); and 378–369 Ma (peak at 378 Ma, 2 grains). One magmatic zircon has an age of 1462±13 Ma.
5.b.4. Late Permian – Early Triassic samples
Ninety zircon crystals were randomly selected from the Late Permian – Early Triassic sample 15C-32 from the well core near Urumqi and 89 effective data points were obtained. The U–Pb ages range from 398 to 273 Ma, and can be divided into four groups: 293–273 Ma (5 grains); 319–303 Ma (29 grains); 357–321 Ma (peak at 328 Ma, 52 grains); and 398–361 Ma (3 grains).
5.b.5. Middle–Late Triassic samples
Sample 15C-2 was collected from the Mid Triassic Kelamayi Formation in the well core near Urumqi. A total of 90 grains yielded 87 usable ages, which span a range from 956 to 241 Ma. Except for one Precambrian (956±10 Ma), five Ordovician–Devonian (474–367 Ma) and two Triassic (245–241 Ma) ages, the remaining 79 zircon ages define a cluster from the Carboniferous to Early Permian (354–289 Ma), with a peak age at 314 Ma. Compared with the Cangfanggou Group, there are many more grains in the range of 320–300 Ma (more than half) and fewer grains in the range of 360–320 Ma (Fig. 9).
Zircon U–Pb age group variations of the 12 sandstone samples from the Upper Carboniferous Qijiagou Formation to Upper Triassic Haojiagou Formation.

Sample 15GG-01 was collected from the Xiaoquangou Group in the Xiamenzi–Haxionggou section. A total of 100 analyses were conducted on these grains, which show concordant ages. The 206Pb–238U ages range from 1020 to 275 Ma. The results show a dominant age group of 320–301 Ma (peaks at 312 and 303 Ma, 38 grains), and subordinate groups of 300–275 Ma (peak at 277 Ma, 19 grains), 357–321 Ma (peak at 342 Ma, 22 grains) and 541–400 Ma (peaks at 455 and 426 Ma, 20 grains). One detrital zircon has an age of 1020±9 Ma.
Sample 15C-33 was collected from the well core adjacent to 15C-2, 15C-31 and 15C-32. Analysis of 100 grains yielded 99 usable ages, which span a wide range from 807 to 213 Ma. Five age populations are evident: 250–213 Ma (peaks at 243 and 234 Ma, 28 grains); 300–251 Ma (peak at 293 Ma, with a subordinate peak at 271 Ma, 24 grains); 320–301 Ma (peak at 303 Ma, 17 grains); 345–321 Ma (peak at 336 Ma, 17 grains); and 490–395 Ma (peaks at 476, 446 and 413 Ma, 13 grains). Three zircons yielded ages of 807±8, 806±8 and 584±6 Ma.
6. Discussion
6.a. Provenance
U–Pb zircon age data from the 12 analysed samples mainly fall into six groups: (1) Precambrian zircons having ages of 2421–541 Ma; (2) Cambrian to Devonian zircons ranging in age from 541 to 360 Ma; (3) Early Carboniferous zircons with ages from 360 to 320 Ma; (4) Late Carboniferous zircons with ages between 320 and 300 Ma; (5) Permian zircons having ages of 300–250 Ma; and (6) Triassic zircons with ages ranging from 250 to 200 Ma. The relative proportions of these six age components vary among samples. Palaeocurrents in the strata of the Bogda are mainly N-directed implying the provenance of the Bogda sediments was situated mainly to the south in the Tianshan area (Hendrix et al. Reference Hendrix, Graham, Carroll, Sobel, Mcknight, Schulein and Wang1992; Hendrix, Reference Hendrix2000; Greene et al. Reference Greene, Carroll, Hendrix, Graham, Wartes and Abbink2001). However, considering the long distance between the STS and the Bogda in late Palaeozoic time (Li et al. Reference Li, Tang, Peng and Xu2012; Li & Peng, Reference Li and Peng2013), the STS is unlikely to be the provenance of the Bogda sediments.
The age populations within 2421–541 Ma and 541–360 Ma shown in the age spectrum are consistent with the ages of the Proterozoic basement and Cambrian–Devonian magmatic rocks in the YCTS (Fig. 1c; Han et al. Reference Han, He, Wu and Li2004; Zhu & Song, Reference Zhu and Song2006; Gao et al. Reference Gao, Long, Klemd, Qian, Liu, Xiong, Su, Liu, Wang and Yang2009; Chen et al. Reference Chen, Zhang, Liu, Xiong, Yuan and Chen2012; Yang et al. Reference Yang, Jolivet, Dupont-Nivet, Guo, Zhang and Wu2012b). Alternatively, these zircons could possibly be derived from the recycled pre-orogenic sediments. A few Devonian ages (420–360 Ma) have also been reported in the NTS and northern margin of the YCTS (Fig. 1c; Gao et al. Reference Gao, Li, Xiao, Tang and He1998), but these zircons have little impact on our interpretations of detrital zircon populations (Fig. 8).
The Early Carboniferous zircons with ages from 360 to 320 Ma in the contribution correlate well with the arc-related granitic plutons produced by the northward subduction of the STS oceanic crust in the southern magmatic belt of the YCTS (Fig. 1c; Wang et al. Reference Wang, Shu, Cluzel, Faure and Charvet2007a,c; Gao et al. Reference Gao, Long, Klemd, Qian, Liu, Xiong, Su, Liu, Wang and Yang2009; Han et al. Reference Han, He, Wang and Guo2011; Li & Peng, Reference Li and Peng2013), and they are the potential sources of the studied rocks. Moreover, igneous rocks with ages of 334±2 Ma and 332±2 Ma were also reported in the Bogda (Li et al. Reference Li, Liu, Zhu, Chen, Chen and Jin2013a,b), but are dominated by basic rocks, therefore resulting in small volumes of zircons (Wang et al. Reference Wang, Faure, Shu, Jong, Charvet, Cluzel, Jahn, Chen and Ruffet2010b). In summary, the 360–320 Ma zircon ages were mainly derived from the southern magmatic belt of the YCTS (Li et al. Reference Li, Tang, Peng and Xu2012; Li & Peng, Reference Li and Peng2013).
Detrital zircons with ages of 320–300 Ma are typically euhedral, suggesting derivation from a local source area. Our sampling area is close to the NTS. The Late Carboniferous island arc volcanic rocks are abundant in the NTS and northern margin of the YCTS, and have ages largely between 320 and 300 Ma (Table 1; Han et al. Reference Han, Guo, Zhang, Zhang, Chen and Song2010; Liu et al. Reference Liu, Yang, Li, Chen, Xu, Li and Jia2011, Reference Liu, Guo, Zhang and Wu2012; Yang et al. Reference Yang, Zhang, Guo, Fu, Si, Su, Wang and Chen2014; Wang et al. Reference Wang, Wu, Li, Zhu, Chen, Li, Wu, Deng and Chen2016a). These observations suggest that the Late Carboniferous volcanic rocks in the NTS and northern magmatic belt of YCTS were the sources.
Detrital zircons of 300–250 Ma ages have been reported in the NTS (Han et al. Reference Han, Guo, Zhang, Zhang, Chen and Song2010), YCTS (Wang et al. Reference Wang, Shu, Cluzel, Faure and Charvet2007b; Tang et al. Reference Tang, Wang, Zhao, Wyman, Jiang and Jia2008; Gao et al. Reference Gao, Long, Klemd, Qian, Liu, Xiong, Su, Liu, Wang and Yang2009, Reference Gao, Klemd, Qian, Zhang, Li, Jiang and Yang2011; Han et al. Reference Han, He, Wang and Guo2011; Long et al. Reference Long, Gao, Klemd, Beier, Qian, Zhang, Wang and Jiang2011) and the Bogda (Gu et al. Reference Gu, Hu, Yu, Zhao, Wu and Li2001; Chen, Shu & Santosh, Reference Chen, Shu and Santosh2011). Thus, these zircons are unable to be unequivocally distinguished from a single region or both regions. These zircons are always from the Permian high-K calc-alkaline and alkaline igneous rocks (e.g. granites), which relate to post-collision (Liu et al. Reference Liu, Han, Ji and Li2005; Shu et al. Reference Shu, Zhu, Wang, Faure, Charvet and Cluzel2005; Chen, Shu & Santosh, Reference Chen, Shu and Santosh2011).
The Triassic age group (250–200 Ma) in the detrital zircons is associated with the Mesozoic magmatism, but there is relatively little direct field evidence of Triassic magmatic activity in the southern margin of the Junggar Basin. However, near the Jimusaer and slightly further east, thin amygdaloidal andesites interlayered with the Mid–Upper Triassic strata have been reported (BGMRXUAR, 1993; Wang et al. Reference Wang, Wu, Li, Zhu, Chen, Li, Wu, Deng and Chen2016b). Hence, we suggest the Bogda was probably the source of the zircons with an age range of 250–200 Ma.
Accordingly, the provenance of the Bogda was probably derived from the NTS, YCTS and the Bogda. In spite of this, sources from the NTS and the northern margin of the YCTS would be dominated by higher proportions of euhedral and angular grains, and sandstone rich in F and Lv grains (Table 1). The source from the southern margin of the YCTS would be characterized by lower proportions of euhedral and angular grains relative to rounded grains (owing to long-distance transport and multiple-phase recycling), and sandstone rich in quartz grains with some metamorphic fragments (Table 1). The source from the Bogda would be dominated by mixed angular to rounded grains, and sandstone composed of quartz, Ls and Lv grains (Table 1).
6.b. Tectonic setting
The Late Carboniferous geodynamic setting of the NTS has long been debated (e.g. Wang et al. Reference Wang, Shu, Faure, Cluzel and Charvet2007d; Tang et al. Reference Tang, Wang, Wyman, Sun, Li, Zhao, Sun, Jia and Jiang2010; Wang et al. Reference Wang, Wu, Li, Zhu, Chen, Li, Wu, Deng and Chen2016a and references therein). Fortunately, the composition of a sandstone can be related to plate tectonic processes, making it a powerful tool in the recognition of ancient tectonic settings (e.g. Dickinson, Reference Dickinson and Zuffa1985). As shown in Figures 3 and 6, except for the Mid–Upper Triassic samples, the remaining sandstones plotted in the magmatic arc area, and the lithic clasts are dominated by volcanic lithic fragments. Thus, we propose that the arc-related sources were the provenance of the Upper Carboniferous – Lower Triassic sediments. As the 320–300 Ma zircon ages (mainly derived from the NTS) are always present in the age pattern of detrital zircons from the Upper Carboniferous to Lower Triassic (Figs 8, 9), we suggest the NTS was an island arc in Late Carboniferous time. This can be further evidenced by the characteristics of the volcanic rocks in the NTS (Wang et al. Reference Wang, Wu, Li, Zhu, Chen, Li, Wu, Deng and Chen2016a and references therein). The Upper Carboniferous rock assemblages of the NTS display a consecutive magma series, and most of them fall into the calc-alkaline field (Figs 10, 11; Wang et al. Reference Wang, Wu, Li, Zhu, Chen, Li, Wu, Deng and Chen2016a and references therein). On the Th–Ta–Hf/3 (Fig. 11a; Wood, Reference Wood1980) and Th/Yb–Nb/Yb (Fig. 11c; Pearce, Reference Pearce2008) discriminant diagrams, most of the Late Carboniferous basaltic volcanic rocks plot in the calc-alkaline basalt field and reveal a subduction-related magmatism. In the Y+Nb versus Rb diagram (Pearce, Reference Pearce1996), the Late Carboniferous felsic volcanic rocks plot in the volcanic arc field, consistent with the characteristics of an arc-type setting of active continental margins. All of this evidence suggests that the NTS was in a subduction-related setting in Late Carboniferous time. However, in Early Permian time, the volcanic rocks show a bimodal pattern, and the granites mainly plot in the within-plate field (Fig. 11e). Some Early Permian high-K calc-alkaline and alkaline igneous rocks have also been reported (Han et al. Reference Han, Guo, Zhang, Zhang, Chen and Song2010; Tang et al. Reference Tang, Wang, Wyman, Sun, Li, Zhao, Sun, Jia and Jiang2010; Wang et al. Reference Wang, Wu, Li, Zhu, Chen, Li, Wu, Deng and Chen2016a). Therefore, we propose that the post-collisional extensional environment initiated from Early Permian time (Wang et al. Reference Wang, Wu, Li, Zhu, Chen, Li, Wu, Deng and Chen2016a).
K2O versus SiO2 diagram for the Carboniferous – Early Permian volcanic rocks and granite–mafic intrusions in the NTS and Bogda Mountains (modified after Peccerillo & Taylor Reference Peccerillo and Taylor1976). Data are from Chen et al. (Reference Chen, Zhou, Xie, Zhang and Guo2000, Reference Chen, Shu, Santosh and Zhao2013), Gu et al. (Reference Gu, Yu, Hu and Li2000, Reference Gu, Hu, Yu, Zhao, Wu and Li2001), Xia et al. (Reference Xia, Xia, Xu, Li, Ma and Wang2004b), Liu et al. (Reference Liu, Han, Ji and Li2005, Reference Liu, Yang, Li, Chen, Xu, Li and Jia2011, Reference Liu, Guo, Zhang and Wu2012), Shu et al. (Reference Shu, Zhu, Wang, Faure, Charvet and Cluzel2005, Reference Shu, Wang, Zhu, Guo, Charvet and Zhang2011), Ouyang et al. (Reference Ouyang, Zhou, Lin and Feng2006), Wang et al. (Reference Wang, Shu, Faure, Cluzel and Charvet2007d, Reference Wang, Li, Tian, Yu, Wang, Zhao and Tang2010b, Reference Wang, Cui, Sun, Zhu, Zhu and Bai2015a,b,c,d,e, Reference Wang, Wu, Li, Zhu, Chen, Li, Wu, Deng and Chen2016a), Guo et al. (Reference Guo, Zhou, Ouyang and Zhou2009), Han et al. (Reference Han, Guo, Zhang, Zhang, Chen and Song2010), Wang & Cai (Reference Wang and Cai2010), Chen, Shu & Santosh (Reference Chen, Shu and Santosh2011), Liang et al. (Reference Liang, Guo, Gao, Fan, Qin, Zhou and Hei2011), Long et al. (Reference Long, Gao, Klemd, Beier, Qian, Zhang, Wang and Jiang2011), Xiong et al. (Reference Xiong, Yang, Jia, Xu, Chen, Li, Ren and Zuo2011), Gao et al. (Reference Gao, Li, Guo, Zhou, Liu, Fang and Zhou2013, Reference Gao, Li, Liu, Gao, Guo, Zhou and Fang2014), Li et al. (Reference Li, Liu, Zhu, Chen, Chen and Jin2013b), Si et al. (Reference Si, Su, Yang, Zhang and Yang2014), Yang et al. (Reference Yang, Zhang, Guo, Fu, Si, Su, Wang and Chen2014), Zhao et al. (Reference Zhao, Xu, Zhu, Liu and Chen2014) and Xie et al. (Reference Xie, Luo, Xu, Chen, Hong, Ma and Ma2016a).

Discrimination diagrams illustrating the tectonic setting of the volcanic rocks from the Bogda Mountains and NTS. (a, b) Th–Ta–Hf/3 discriminant diagrams (basaltic only; fields after Wood, Reference Wood1980); (c, d) Th/Yb versus Nb/Yb discriminant diagrams (basaltic only; fields after Pearce, Reference Pearce2008); (e, f) Rb versus Yb+Nb discriminant diagrams (felsic only; fields after Pearce, Reference Pearce1996). Data sources are the same as in Figure 10. WPG – within-plate granites; VAG – volcanic arc granites; Syn-COLG – syn-collision granites; ORG – ocean ridge granites.
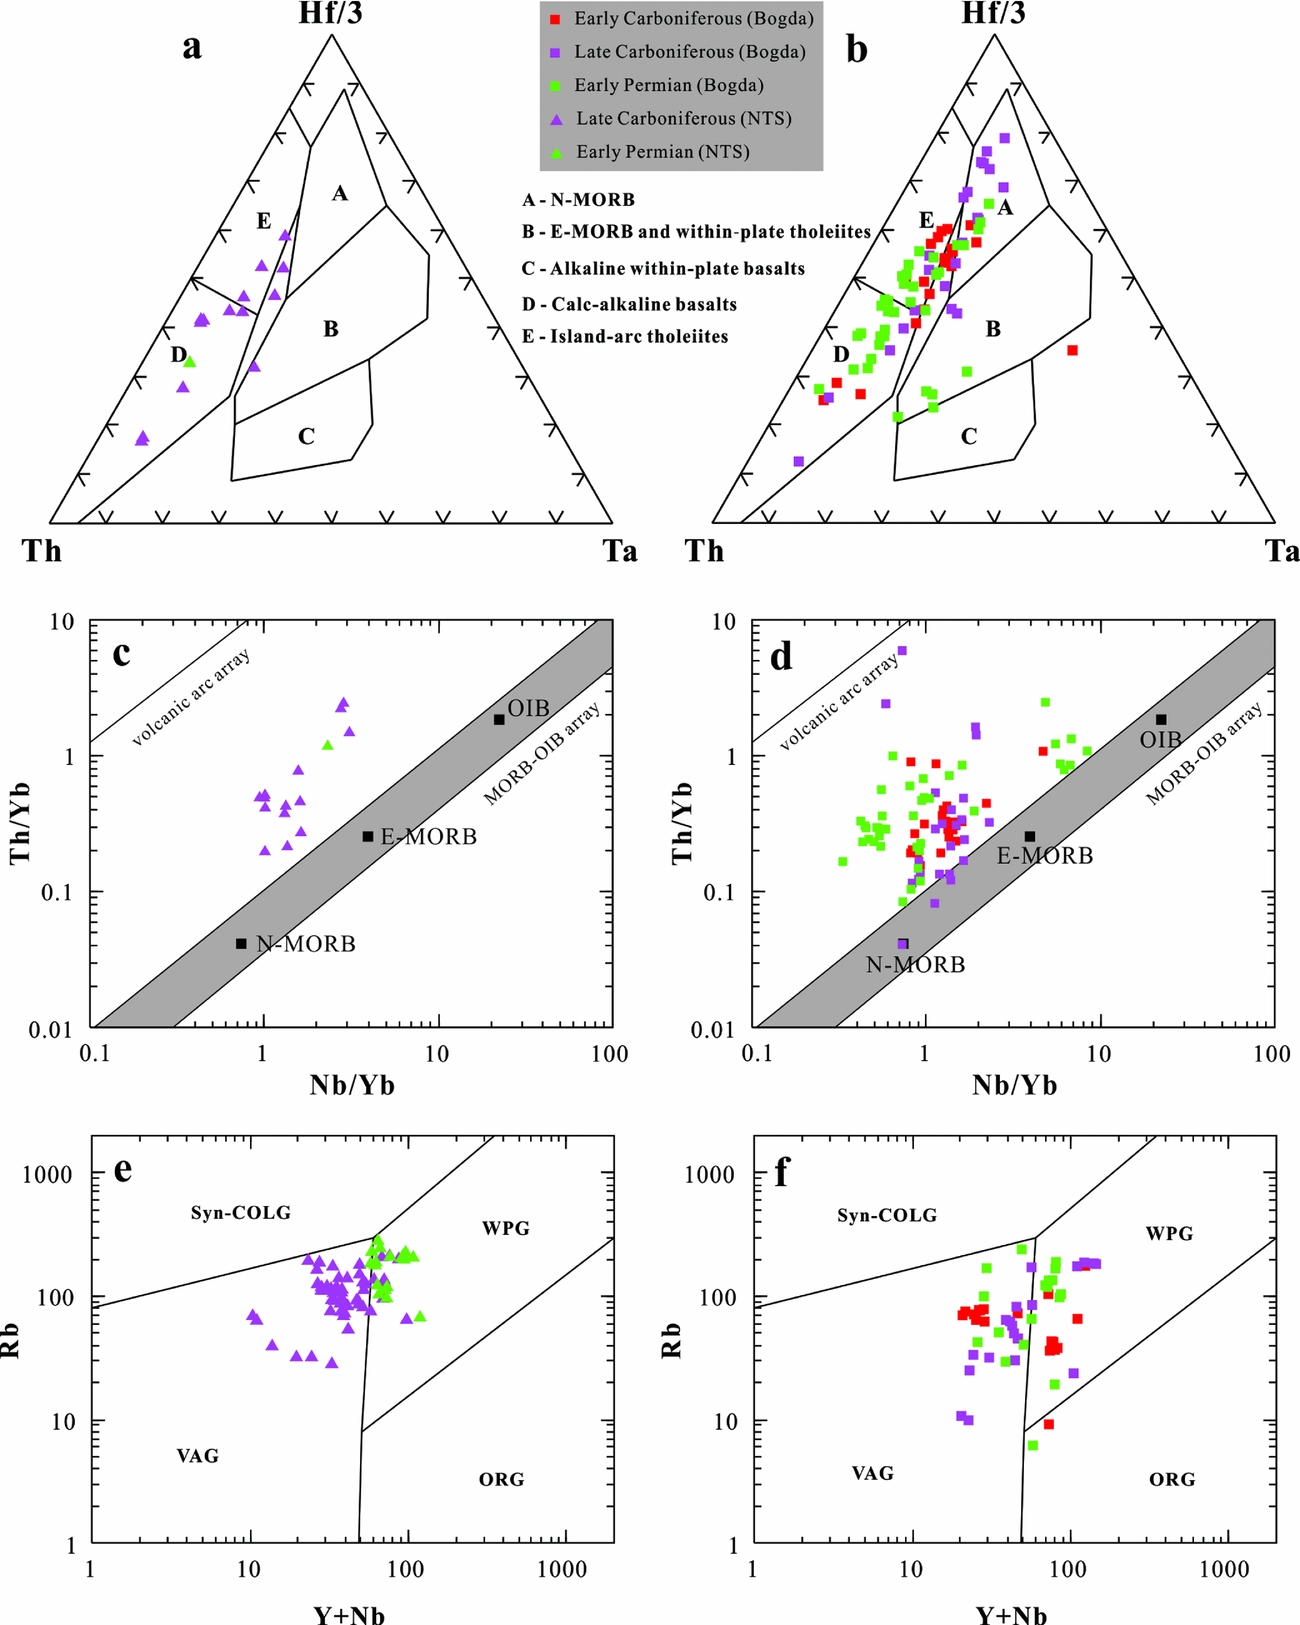
As Section 1 mentioned, the initial tectonic setting of the Bogda is still a matter of debate. Three samples from the Mid–Upper Triassic Xiaoquangou Group plot in the recycled orogeny area instead of the magmatic arc area on the Qt–F–L and Qm–F–Lt ternary diagrams (Fig. 6). Considering the Bogda begins to provide sedimentary materials in Middle–Late Triassic time (see Section 6.c.4), we speculate that the Bogda was not a volcanic arc as proposed by Ma, Shu & Sun (Reference Ma, Shu and Sun1997) and Laurent-Charvet et al. (Reference Laurent-Charvet, Monié, Charvet, Shu and Ma2003). Instead, more and more multidisciplinary data support that the Bogda was a rift in Carboniferous time (Gu et al. Reference Gu, Yu, Hu and Li2000, Reference Gu, Hu, Yu, Zhao, Wu and Li2001; Wang et al. Reference Wang, Faure, Shu, Jong, Charvet, Cluzel, Jahn, Chen and Ruffet2010b, Reference Wang, Xu, Ma, Chen, Zhu, Sun and Cui2015e), followed by Permian extension (Shu et al. Reference Shu, Wang, Zhu, Guo, Charvet and Zhang2011). This is also supported by the widely distributed Carboniferous–Early Permian bimodal volcanic rocks in the Bogda (Fig. 10; Gu et al. Reference Gu, Yu, Hu and Li2000; Wang et al. Reference Wang, Faure, Shu, Jong, Charvet, Cluzel, Jahn, Chen and Ruffet2010b, Reference Wang, Xu, Ma, Chen, Zhu, Sun and Cui2015e; Chen, Shu & Santosh, Reference Chen, Shu and Santosh2011), the underwater olistostrome of Baiyanggou (Shu et al. Reference Shu, Wang, Zhu, Guo, Charvet and Zhang2011) and the regional strike-slip faults in the Tianshan (Shu et al. Reference Shu, Zhu, Wang, Faure, Charvet and Cluzel2005). Furthermore, on the Th–Ta–Hf/3 (Fig. 11b), Th/Yb–Nb/Yb (Fig. 11d) and Rb–(Y+Nb) (Fig. 11f) discriminant diagrams, the basaltic rocks plot in multiple fields, indicating an origin from melting of variably enriched mantle sources. This evidence indicates an extensional affinity in Carboniferous–Early Permian time. Therefore, we suggest the initial tectonic setting of the Bogda was an extensional context which was related to rifting or post-collision.
6.c. Implications for tectonic evolution of the Bogda
As mentioned in Section 1, controversy has surrounded the tectonic evolution of the Tianshan, Bogda and Junggar Basin for a long time. The integrated provenance techniques employed here reveal a series of significant shifts in geochronology and sandstone composition. These variations clearly indicate that sediment sources varied in relation to four distinct stages from Late Carboniferous to Late Triassic time (Fig. 12).
Reconstruction of key periods in the tectonic evolution of the Bogda Mountains/region from Late Carboniferous to Late Triassic time.

6.c.1. Rift or post-collisional extension (Late Carboniferous to Early Permian)
The patterns of the detrital zircon ages from the Upper Carboniferous Qijiagou Formation (sample 15HXG-11) and Lower Permian Shirenzigou Formation (sample 15HXG-20) showed similar unimodal peaks, indicating a single source of magmatic rocks. Together with the nearly automorphic crystal fragments (e.g. feldspar and quartz) and angular detritus observed under the microscope (Fig. 5e, f), this implies that during this period the Late Carboniferous magmatic belt of the NTS and northern margin of the YCTS were the principal provenance areas. The late Early Permian sample 15HXG-24 from the Tashikula Formation showed some similarities with samples 15HXG-11 and 15HXG-20 with one major Late Carboniferous peak age. This was interpreted as again being mostly derived from the Late Carboniferous magmatic belt of the NTS and northern margin of the YCTS. However, the older peak of 330 Ma in sample 15HXG-24, associated with several early Palaeozoic ages, suggested exhumation of older and further sources that were probably derived from the southern margin of the YCTS. The appearance of the Early Carboniferous source from the southern margin of the YCTS maintained that the basin drainage widened and the distance over which sediments were transported gradually increased from Late Carboniferous to Early Permian time. This is consistent with the characteristics of the clastic particles in the thin-sections: clastic particles from the Qijiagou Formation were angular (Fig. 5e), but some of the clastic grains of the Lower Permian were sub-angular to rounded (Fig. 5f, g). All this evidence reflects the gradual expansion of the drainage systems from Late Carboniferous to Early Permian time, as well as up to Middle Permian time (see Section 6.c.2).
Taking into account the lithostratigraphic features, provenances and the published data (see Section 6.b.), the Upper Carboniferous to Lower Permian strata are interpreted as having formed possibly in an extensional context which was related to rifting or post-collision (Fig. 12a). This viewpoint had also been proposed in several previous studies (e.g. Wartes, Carroll & Greene, Reference Wartes, Carroll and Greene2002; Shu et al. Reference Shu, Zhu, Wang, Faure, Charvet and Cluzel2005, Reference Shu, Wang, Zhu, Guo, Charvet and Zhang2011; Fang et al. Reference Fang, Jia, Guo, Song, Xu and Liu2006; Wang et al. Reference Wang, Faure, Shu, Jong, Charvet, Cluzel, Jahn, Chen and Ruffet2010b; Chen, Shu & Santosh, Reference Chen, Shu and Santosh2011; Yang et al. Reference Yang, Jolivet, Dupont-Nivet, Guo, Zhang and Wu2012a; Tang et al. Reference Tang, Zhang, Li, Li, Chen and Guo2014).
6.c.2. Rift-drift transition (Middle Permian)
The spectrogram of detrital zircon ages and N-directed palaeocurrents suggest that the material deposited within the Mid Permian Wulapo Formation (sample 15HXG-54) was predominantly derived from the NTS and northern margin of the YCTS (peak at 306 Ma), and minor amounts of materials were sourced from the southern margin of the YCTS (peak at 340 Ma). We propose this indicates the continued expansion of the drainage system. However, the peak age of 340 Ma disappeared in the Mid Permian Jingjingzigou Formation (sample 15HXG-68), and the clastic particles changed from sub-rounded in the Wulapo Formation (Fig. 5h) to sub-angular in the Jingjingzigou Formation (Fig. 5i). Furthermore, the minor peak age at 318 Ma in the age pattern of sample 15HXG-68 suggests older, most likely deeper sources of the NTS. Therefore, the main provenance had a shift from a mixture of two sources to a single source from the Wulapo to Jingjingzigou Formation. Although the episode of basin underfilling recorded by the Jingjingzigou Formation may reflect structural damming during local uplift of the orogenic wedge or propagation of a new frontal thrust (Lawton & Trexler, Reference Lawton and Trexler1991; Wartes, Carroll & Greene, Reference Wartes, Carroll and Greene2002), minor changes in depositional environment should be considered (Figs 3, 5b). Plus, the subordinate peak ages (359 Ma and 346 Ma), associated with several early Palaeozoic ages, indicate that the YCTS still provided some materials to the Bogda. That is, though the NTS source was important, positive reliefs were certainly present but were probably smooth enough to allow rivers to cut through and bring materials from the YCTS to the north. These results suggest that the main watershed did not exist between the YCTS and NTS in this period. In addition, syn-sedimentary normal faults are widely distributed in the Lower Permian strata, revealing a rift-related depositional environment (Wang et al. Reference Wang, Wu, Li, Zhu, Chen, Li, Wu, Deng and Chen2016b). In Middle Permian time, the depositional environment was relatively stable, without intensive deformation, showing weak tectonic activity (Wang et al. Reference Wang, Wu, Li, Zhu, Chen, Li, Wu, Deng and Chen2016b). These phenomena are incongruent with the local uplift model, which would cause a sharp provenance change (Wartes, Carroll & Greene, Reference Wartes, Carroll and Greene2002). Therefore, we interpret this as passively subsiding during the rift-drift transition (Fig. 12b). This is consistent with the depositional unconformity between the Wulapo and Jingjingzigou formations investigated in the field section (Fig. 5b), which was possibly caused by the sudden fall of relative sea-level.
Afterwards, the Mid Permian Lower Lucaogou Formation (sample 12NFG-27), Upper Lucaogou Formation (sample 12NFG-30) and Hongyanchi Formation (15C-31) show some similarities with sample 15HXG-68 with one major NTS source. But the percentage of the older age group 360–320 Ma gradually increased (Fig. 9), implying the southern magmatic belt of the YCTS had joined the sources. The increased contribution from the southern margin of the YCTS implies the drainage system had widened again after the rift-drift transition.
6.c.3. Uplift of the NTS (Late Permian – Early Triassic)
The distribution of detrital zircon U–Pb ages in sample 15C-32 from the Upper Permian – Lower Triassic Cangfanggou Group shows a distinct Early Carboniferous peak age (328 Ma) and several Devonian ages. Combined with the NE-directed palaeocurrents, a single population peak and high quartz contents, this indicates a primary source of magmatic rocks in the southern margin of the YCTS. However, comparing this with the age spectra of the Mid Permian Hongyanchi Formation (sample 15C-31) and Mid Triassic Kelamayi Formation (sample 15C-2), those ages were expressed in sample 15C-31, but almost completely disappear in sample 15C-2. Furthermore, the slightly older peak age at 314 Ma in the Mid Triassic Kelamayi Formation (sample 15C-2) suggests the exhumation of an older and deeper source of the NTS. Thus, we attribute the provenance change to the uplift of the NTS in Late Permian – Early Triassic time (Fig. 12c). This interpretation is evidenced by the alluvial detritus which spread northeastwards in the NTS piedmont (Fig. 5c; Greene et al. Reference Greene, Carroll, Hendrix, Graham, Wartes and Abbink2001; Wang et al. Reference Wang, Wu, Li, Zhu, Chen, Li, Wu, Deng and Chen2016b) and the low-temperature thermochronology data in the region (Dumitru et al. Reference Dumitru, Zhou, Chang and Graham2001; Jolivet et al. Reference Jolivet, Dominguez, Charreau, Chen, Li and Wang2010). Moreover, tectonic subsidence of the Southern Junggar Basin also accelerated during Late Permian time, creating accommodation for > 4000 m of non-marine sediments (Carroll et al. Reference Carroll, Graham, Hendrix, Ying and Zhou1995; Wartes, Carroll & Greene, Reference Wartes, Carroll and Greene2002), which accords with the uplift of the NTS. In addition, the missing Lower Triassic strata and the angular unconformity contact relationship between the Permian and Triassic rocks in the Aiweiergou area to the south also records the Late Permian – Early Triassic tectonic uplift of the NTS (Fig. 5d; Greene et al. Reference Greene, Carroll, Hendrix, Graham, Wartes and Abbink2001; Wartes, Carroll & Greene, Reference Wartes, Carroll and Greene2002; Tang et al. Reference Tang, Zhang, Li, Li, Chen and Guo2014; Chen, Liao & Liu, Reference Chen, Liao and Liu2015; Wang et al. Reference Wang, Wu, Li, Zhu, Chen, Li, Wu, Deng and Chen2016b).
It is also worth noting that the conformable contact relationship between the Triassic and Permian series in the Bogda suggests that the Late Permian – Early Triassic uplift was only limited to the NTS region to the south and did not affect the Bogda to the north (Tang et al. Reference Tang, Zhang, Li, Li, Chen and Guo2014). This is consistent with the same northward palaeocurrent direction on both sides of the Bogda, which indicates that the Bogda was not uplifted in Early Triassic time (Hendrix et al. Reference Hendrix, Graham, Carroll, Sobel, Mcknight, Schulein and Wang1992; Wartes, Carroll & Greene, Reference Wartes, Carroll and Greene2002; Greene et al. Reference Greene, Carroll, Wartes, Graham and Wooden2005).
6.c.4. Initial uplift of the Bogda (Middle–Late Triassic)
Previous studies suggested that the Bogda had existed as a positive physiographic feature in Early Jurassic time based on the abrupt changes of sandstone composition and palaeocurrent direction in the southern Bogda (Hendrix et al. Reference Hendrix, Graham, Carroll, Sobel, Mcknight, Schulein and Wang1992; Greene et al. Reference Greene, Carroll, Hendrix, Graham, Wartes and Abbink2001, Reference Greene, Carroll, Wartes, Graham and Wooden2005), or the appearance of the Early Permian ages from the Lower Jurassic sample (Tang et al. Reference Tang, Zhang, Li, Li, Chen and Guo2014). However, our new data, coupled with recent studies, suggests the initial uplift of the Bogda occurred in Middle–Late Triassic time (Fig. 12d). The reasons are described as below: (1) The age spectrum of the Upper Triassic Haojiagou Formation (sample 15C-33) shows a significant multimodal distribution (Figs 8, 9). The multimodal spectrum implies the joining of other sources and a diversity of provenances in Late Triassic time. Moreover, this sample also presents a dramatic change with the first appearance of zircons from sub-contemporaneous Middle–Late Triassic magmatic sources (Fig. 8; peak ages of 243 and 234 Ma). Combined with the limited volume of the Triassic magmatism that occurred in the Bogda (BGMRXUAR, 1993; Wang et al. Reference Wang, Wu, Li, Zhu, Chen, Li, Wu, Deng and Chen2016b), we suggest the age group of 250–200 Ma in the detrital zircons probably came from the Bogda. (2) Sandstone compositional data reveals a sudden increase in Ls grains from the Mid–Upper Triassic samples. Moreover, the framework grain composition of these samples shows relative good sorting, abundant volcanic and quartz grains, and a mixed particle morphology (Fig. 5j), and displays the characteristics of sedimentary recycling on the Qt–F–L and Qm–F–Lt ternary diagrams (Fig. 6). These phenomena suggest the Bogda began to provide sedimentary materials. (3) The decrease in F grains from the Mid–Upper Triassic samples suggests less unroofing of the granitoids. Combined with the older and deeper Carboniferous rocks that had been erosionally unroofed in the NTS, the Early Permian detrital zircons (peak ages of 277 and 271 Ma) may have come from the NTS and the Bogda, which also proves the Bogda began to provide sources. (4) The depositional environments evolved from shallow-lacustrine systems to fluvial systems in Middle–Late Triassic time (Fig. 3), implying the Bogda had existed as a relatively positive topography. Upsection, the switching from NE- to N-directed palaeocurrents may maintain that the Bogda began to provide sources. (5) In the Dalongkou section, Jimusaer region, the Triassic series are overlain unconformably by the Lower Jurassic Badaowan Formation, revealing intensive tectonic activity in Late Triassic time (BGMRXUAR, 1999). In contrast, the five formations of the Upper Permian – Lower Triassic Cangfanggou Group are in conformable contact with each other, recording continuous sedimentation through the Permian–Triassic transition (Zhou et al. Reference Zhou, Li, Yang, Hou, Liu, Cheng, Wu and Li1997; Metcalfe et al. Reference Metcalfe, Foster, Afonin, Nicoll, Mundil, Wang and Lucas2009). The stratigraphic contact relationships propose that the initial uplift of the Bogda was not in Late Permian time, but most likely in Late Triassic time. And (6) the Triassic magmatism and ore-formation in the Eastern Tianshan were related to collisional crustal shortening and thickening (Gu et al. Reference Gu, Zhang, Wu, Tang, Wang, Xi and Zheng2006; Deng et al. Reference Deng, Chen, Santosh, Wang, Li, Yue, Zheng, Chen, Tang, Dong and Qu2017), revealing an Indosinian (Triassic) orogenic event (Gu et al. Reference Gu, Zhang, Wu, Tang, Wang, Xi and Zheng2006). All the evidence suggests that the Bogda was a gentle positive relief providing sedimentary materials to the Junggar Basin in Middle–Late Triassic time. In addition, it is important to note that the sample 15GG-01 from the Xiaoquangou Group lacks precise dating ages or biostratigraphy, which cannot constrain its accurate age. Thus, we mark the initial uplift and erosion of the palaeo-Bogda as occurring in Middle–Late Triassic time, and most likely in Late Triassic time.
Combining this with the Early Carboniferous ages (peak at 336 Ma), Late Carboniferous ages (peak at 303 Ma) and Permian ages (peaks at 293 Ma and 271 Ma) that exist in the spectrograms of the detrital zircons, we suggest the provenance of the Middle–Late Triassic samples mainly include the Bogda, NTS and YCTS. Furthermore, considering the YCTS also became the source area of the basin, together with the extensive lacustrine deposits in the Junggar Basin and its adjacent regions (Li & Peng, Reference Li and Peng2013), we suggest the further expansion of the basin drainage system during Middle–Late Triassic time, as well as Early–Middle Jurassic time (Yang et al. Reference Yang, Jolivet, Dupont-Nivet, Guo, Zhang and Wu2012a; Tang et al. Reference Tang, Zhang, Li, Li, Chen and Guo2014). This is consistent with the southern edge of the Junggar Basin extending at least into the Houxia area during Middle–Late Triassic time, where the Mid–Upper Triassic Xiaoquangou Group overlies unconformably the Mid Permian Lucaogou Formation (Fig. 5d; Wartes, Carroll & Greene, Reference Wartes, Carroll and Greene2002; Chen, Liao & Liu, Reference Chen, Liao and Liu2015; Wang et al. Reference Wang, Wu, Li, Zhu, Chen, Li, Wu, Deng and Chen2016b). Numerous studies indicated that the Tianshan and its adjacent regions were a peneplain during Early Jurassic time, and the Tianshan had a relatively gentle palaeogeomorphology (e.g. Li & Peng, Reference Li and Peng2013; Tang et al. Reference Tang, Zhang, Li, Li, Chen and Guo2014). Thus, the expanded drainage system, the relatively low topography and the weakened uplift of the Tianshan also suggest a levelled process from Middle–Late Triassic to Early–Middle Jurassic times (Tang et al. Reference Tang, Zhang, Li, Li, Chen and Guo2014).
7. Conclusions
The integrated provenance techniques employed here for the Bogda revealed a series of shifts in the geochronology, palaeocurrents and sandstone composition from Late Carboniferous to Late Triassic time. These analyses, combined with the published data, led us to draw the following conclusions:
(1) The U–Pb detrital zircon ages range widely from 2421 to 213 Ma and can be divided into six groups: 2421–541 Ma, 541–360 Ma, 360–320 Ma, 320–300 Ma, 300–250 Ma and 250–200 Ma. Those groups, together with the available palaeocurrent measurements, indicate that the 2421–541 Ma, 541–360 Ma and 360–320 Ma age groups were assigned to the Precambrian basement and magmatic rocks of the YCTS, and the 320–300 Ma age group was related to the volcanic island arc in the NTS and northern margin of the YCTS. Furthermore, the 250–200 Ma age group corresponded to the Middle–Late Triassic volcanism in the Bogda. (2) The initial tectonic setting of the Bogda in Carboniferous–Early Permian time was an extensional context, which was related to rifting or post-collision. (3) The tectonic evolution of the Bogda can be divided into four stages: rift or post-collisional extension from Late Carboniferous to Early Permian time, rift-drift transition in Middle Permian time, uplift of the NTS during Late Permian – Early Triassic time, and the initial uplift of the Bogda in Middle–Late Triassic time.
Acknowledgements
We thank Editor-in-Chief Prof. Mark Allen and two anonymous reviewers for their constructive comments and careful corrections that led to significant improvement of the manuscript. We express our gratitude to Dr Rong Chen, Dr Jian Ma and Dr Yizhe Wang for their discussion and field assistance. This work was financially supported by the National Science and Technology Major Project of China (Grant No. 2011ZX05009–001).
Supplementary material
To view supplementary material for this article, please visit https://doi.org/10.1017/S0016756816001217.