Introduction
Bipolar disorder (BD) and major depressive disorder (MDD) are highly heritable mood disorders characterized by episodic elevation and/or depression of mood respectively. The disorders share overlapping genetic architecture, demonstrated by molecular genetic approaches (Green et al. Reference Green, Grozeva, Jones, Jones, Kirov, Caesar, Gordon-Smith, Fraser, Forty, Russell, Hamshere, Moskvina, Nikolov, Farmer, McGuffin, Holmans, Owen, O'Donovan and Craddock2010; Liu et al. Reference Liu, Blackwood, Caesar, de Geus, Farmer, Ferreira, Ferrier, Fraser, Gordon-Smith, Green, Grozeva, Gurling, Hamshere, Heutink, Holmans, Hoogendijk, Hottenga, Jones, Jones, Kirov, Lin, McGuffin, Moskvina, Nolen, Perlis, Posthuma, Scolnick, Smit, Smit, Smoller, St Clair, van Dyck, Verhage, Willemsen, Young, Zandbelt, Boomsma, Craddock, O'Donovan, Owen, Penninx, Purcell, Sklar and Sullivan2011; Schulze et al. Reference Schulze, Akula, Breuer, Steele, Nalls, Singleton, Degenhardt, Nöthen, Cichon, Rietschel and McMahon2014), and by familial studies which show an increased frequency of both BD and MDD in first-degree relatives of bipolar patients (McGuffin et al. Reference McGuffin, Rijsdijk, Andrew, Sham, Katz and Cardno2003).
Emotional regulation deficits in both disorders appear to have an overlapping neural basis. Neuroimaging studies indicate abnormalities in components of the cortico-thalamic-limbic network (Phillips et al. Reference Phillips, Drevets, Rauch and Lane2003; Savitz & Drevets, Reference Savitz and Drevets2009; Sacher et al. Reference Sacher, Neumann, Fünfstück, Soliman, Villringer and Schroeter2012). Models proposed to explain dysfunctional mood regulation suggest either a loss or reduction of higher order cognitive control over limbic regions, or a hyperactive limbic network overriding cortical control (Savitz & Drevets, Reference Savitz and Drevets2009). The majority of studies of emotional memory in mood disorder have been conducted on patients with longstanding illness v. controls. It is unclear therefore whether abnormalities are confounded by secondary effects of long-term illness or treatment, or how brain function may change during the development of the disorder. Previously we reported increased activation of the bilateral insula, extending to inferior frontal/superior temporal cortices, during a cognitive task in individuals who became unwell approximately 2 years after the time of the initial scanning (Whalley et al. Reference Whalley, Sussmann, Romaniuk, Stewart, Papmeyer, Sprooten, Hackett, Hall, Lawrie and McIntosh2013). These findings suggested there may be neurophysiological changes in emotion-processing brain regions detectable prior to conversion to illness.
One approach to testing these models in relation to mood disorder is the study of emotional modulation of memory, where emotionally arousing events are typically better remembered than neutral (Cahill & McGaugh, Reference Cahill and McGaugh1995, Reference Cahill and McGaugh1998). Neuroimaging studies demonstrate a role for the amygdala and hippocampus in the emotional modulation of memory with additional regulation imposed by the cingulate and prefrontal regions via thalamo-cortical connections, hence the relevance to mood disorders (Cahill & McGaugh, Reference Cahill and McGaugh1998; Phelps, Reference Phelps2004; LaBar & Cabeza, Reference LaBar and Cabeza2006; Whalley et al. Reference Whalley, McKirdy, Romaniuk, Sussmann, Johnstone, Wan, McIntosh, Lawrie and Hall2009). Facilitation of memory for emotionally salient stimuli has been reported to be disrupted in mood disorders with evidence of mood-congruent memory biases (Kauer-Sant'anna et al. Reference Kauer-Sant'anna, Yatham, Tramontina, Weyne, Cereser, Gazalle, Andreazza, Santin, Quevedo, Izquierdo and Kapczinski2008). For example, in BD, studies have reported an enhanced perception of, and enhanced memory for, emotionally charged events (Rock et al. Reference Rock, Goodwin and Harmer2010). In MDD, there is a tendency to rate positively charged emotional events as less positive v. controls with a negative effect of depressed mood on emotional memory (Yeh & Hua, Reference Yeh and Hua2009). These are accompanied by changes in limbic activation (Derryberry & Reed, Reference Derryberry and Reed1994; Keightley et al. Reference Keightley, Seminowicz, Bagby, Costa, Fossati and Mayberg2003; Canli, Reference Canli2004; Haas & Canli, Reference Haas and Canli2008), with increases in fronto-striatal-limbic activation in BD during the encoding of emotional stimuli (Dickstein et al. Reference Dickstein, Rich, Roberson-Nay, Berghorst, Vinton, Pine and Leibenluft2007) and increased attentional bias to negative and neutral stimuli accompanied by increased recruitment of prefrontal regions in MDD (Bertocci et al. Reference Bertocci, Bebko, Mullin, Langenecker, Ladouceur, Almeida and Phillips2012; Kerestes et al. Reference Kerestes, Ladouceur, Meda, Nathan, Blumberg, Maloney, Ruf, Saricicek, Pearlson, Bhagwagar and Phillips2012). Overall, these findings suggest that abnormalities of emotional memory and associated networks may underlie characteristic features of mood disorders and components of its extended phenotype. We previously employed an emotional memory task in BD and schizophrenia, demonstrating a distinct pattern of activation of medial temporal regions between the patient groups (Whalley et al. Reference Whalley, McKirdy, Romaniuk, Sussmann, Johnstone, Wan, McIntosh, Lawrie and Hall2009). Here we employ the same task to explore emotional brain circuitry in those at familial risk of mood disorder.
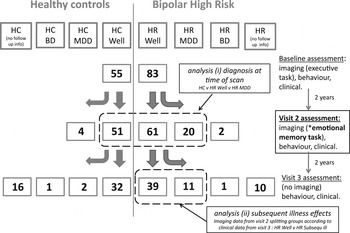
The current study presents findings from the time of the second brain scanning assessment of the Scottish Bipolar Family Study (BFS, see Fig. 1). We conducted two analyses. The first contrasted groups based on diagnosis at the time of the scan [Controls, High-risk (HR) Well and HR MDD]. We hypothesized decreased activation of regulatory regions (prefrontal cortex/anterior cingulate) and increased activation of thalamic and limbic regions in those who were ill at the time of the scan. Our second analysis focused on individuals at high familial risk who were well at the time of the second assessment (HR Well) where we compared those who subsequently became ill after the second scan v. those who remained well. The individuals who became ill between assessments 2 and 3 represent a relatively small sample size (n = 11); however, we considered due to the valuable nature of prospective imaging data before illness onset that this analysis was justified with the caveat of interpreting the findings as preliminary. We hypothesized, based on our previous study, that abnormalities in cortico-thalamic-limbic regions, and in particular the insula, would precede subsequent illness in currently unaffected individuals.
Overview of study design. All imaging data presented were obtained at visit 2 during an emotional memory paradigm. Analysis (i) refers to the comparison of the three groups based on diagnostic status at the time of the scan (Controls, HR Well, HR MDD). Analysis (ii) examines individuals at time 2 from the HR Well group based on follow-up clinical data, comparing those who developed MDD v. those who remained well.

Material and method
Study population
Participants were recruited as part of the BFS (Whalley et al. Reference Whalley, Sussmann, Chakirova, Mukerjee, Peel, McKirdy, Hall, Johnstone, Lawrie and McIntosh2011). The BFS is a prospective longitudinal study examining individuals at familial risk of mood disorder and healthy controls on three occasions, 2 years apart. The current study reports findings from imaging data collected at the second assessment (see Fig. 1). At the beginning of the study, individuals with a diagnosis of bipolar I disorder were identified by psychiatrists across Scotland. Each affected subject was asked to identify members of close family aged 16–25 years. Diagnosis of affected subjects was confirmed with the OPCRIT symptom checklist (McGuffin et al. Reference McGuffin, Farmer and Harvey1991) using data from clinical notes and the structured clinical interview for DSM IV (SCID). Following informed consent, unaffected individuals with at least one first-degree, or two second-degree relatives with bipolar I disorder were invited to participate. Of the 81 HR individuals, 77 had a first-degree relative with BD I, the remaining four had ⩾2 second-degree relatives. For those 77 individuals with first-degree relatives, 73 were offspring of the affected family member, the remaining four individuals were siblings. Unaffected, unrelated comparison subjects with no personal or family history of major psychiatric disorder in first-degree relatives were identified from the social groups of the HR subjects and matched for age, sex and premorbid IQ to the HR group. Comparison subjects were also screened using the SCID. Exclusion criteria for both groups at initial recruitment included a personal history of major depression, mania or hypomania, psychosis, or any major neurological or psychiatric disorder, a history of substance dependence, learning disability, or any history of head injury that included loss of consciousness and any contraindications to magnetic resonance imaging (MRI). After complete description of the study to the subjects, written informed consent was obtained. The study was approved by the Multi-Centre Research Ethics Committee for Scotland.
Clinical assessments
All participants were interviewed by one of two experienced psychiatrists (A.M.M., J.E.S.) using the SCID (First et al. Reference First, Spitzer, Gibbon and Williams2002) to confirm lifetime absence of any Axis I disorders at initial assessment, and at the second and third assessment to determine the presence of any mood disorder meeting diagnostic criteria over the intervening period. Clinical, behavioural and neuropsychological assessments only were performed at the third visit. For subjects who did not return for a third assessment diagnostic status was determined through written contact with the NHS. Current manic and depressive symptoms were rated using the Young Mania Rating Scale (YMRS; Young et al. Reference Young, Biggs, Ziegler and Meyer1978) and Hamilton Rating Scale for Depression (HAMD; Hamilton, Reference Hamilton1960). Estimates of trait-liability to mood disorder (cyclothymia, neuroticism, extraversion) were measured using the Temperament and Personality Measures (TEMPS-A) and Neuroticism Extraversion Openness - Five Factor Inventory (NEO-FFI) (McCrae & John, Reference McCrae and John1992; Akiskal et al. Reference Akiskal, Mendlowicz, Jean-Louis, Rapaport, Kelsoe, Gillin and Smith2005).
Comparison of groups based on diagnosis at the time of the second functional MRI (fMRI) scan
At the second assessment, 51 controls and 81 bipolar HR individuals provided suitable fMRI data. Of the latter, 61 HR individuals were well at the time of the scan (HR Well), and 20 had been diagnosed as MDD between initial recruitment and the second scan (HR MDD) (Fig. 1). Five individuals in the HR MDD group were prescribed antidepressants at the time of scanning. These were initially included in the main analyses, then were excluded to examine findings without potentially confounding medication effects. We additionally performed separate analyses randomly excluding related individuals (limiting the analysis to one individual per family; 55 individuals who were HR Well and 18 individuals with MDD).
Comparison of groups to identify predictors of future illness
At the third assessment, an average of 2 years after the second imaging assessment, a further 11 individuals from the HR Well group had developed MDD. In order to determine whether cortico-thalamic-limbic network abnormalities and in particular insula dysfunction were causally related to the development of MDD, we compared HR individuals known to have remained well across the study (n = 39) to those that subsequently developed MDD (n = 11) from the HR Well group (see Fig. 1). For the remaining individuals from the above HR Well group (n = 61) one individual had developed BD and it was not possible to ascertain the clinical status of the other 10.
Statistical analysis of demographic data was conducted using one-way ANOVAs or χ 2 tests as appropriate. For clinical assessments and measures of temperament, comparison of groups was conducted using Kruskal–Wallis tests. All analyses and graphs were performed in ‘R’ (http://www.R-project.org).
Experimental paradigm
The experimental paradigm was based on previous studies (Hamann et al. Reference Hamann, Ely, Grafton and Kilts1999; Hall et al. Reference Hall, Harris, McKirdy, Johnstone and Lawrie2007) using positive and neutral emotional stimuli selected from the International Affective Picture System (Lang & Bradley, Reference Lang and Bradley2007). Positive stimuli were used as these have previously been shown to demonstrate significant emotional modulation effects and to activate typical emotion-processing regions (Garavan et al. Reference Garavan, Pendergrass, Ross, Stein and Risinger2001; Hamann & Mao, Reference Hamann and Mao2002). The scanning session was divided into blocks during which images of positive emotional scenes (emotion blocks), images of neutral emotional scenes (neutral blocks), and baseline fixation periods (baseline blocks) were presented. Subjects were asked to rate how emotionally arousing they found the pictures (response choices: ‘emotional’, or ‘not emotional’). Post-scan recognition testing was conducted outside the scanner. Participants were shown the full set of old items intermixed with the same number of distracters and were asked to indicate whether the images were ‘recognized’ or ‘not recognized’. Additional details are given in the online Supplementary material.
Behavioural analysis
Within-scanner behavioural measures included accuracy of emotional ratings and reaction time. For retrieval, behavioural measures included recognition accuracy (hit rate – false alarm rate) and reaction time (Hall et al. Reference Hall, Harris, McKirdy, Johnstone and Lawrie2007). Emotional enhancement of recognition memory or ‘emotional modulation’ was calculated by determining the difference between the recognition accuracy scores for the emotional and neutral conditions.
Image processing and analysis
Scanning details are provided in the online Supplementary material. EPI and T1-weighted images were reconstructed into nifti format (Mayo Foundation, USA) using DICOM convert in SPM8 (Statistical Parametric Mapping: The Wellcome Department of Cognitive Neurology and collaborators, Institute of Neurology, London) running in Matlab (The MathWorks, USA). Images were pre-processed using standard protocols available in SPM8. All EPI images were realigned to the mean volume in the series. Functional images were then normalized according to standard co-registration procedures using the individual's structural scan. Finally, all images were smoothed with an 8 × 8 × 8 mm full-width half maximum (FWHM) Gaussian filter. At the individual level the data were modelled with two conditions (positive and neutral). Estimates of the subject's movement during the scan were entered as ‘covariates of no interest’. Contrast images were generated for ‘positive scenes v. baseline’, ‘neutral scenes v. baseline’, and ‘positive scenes v. neutral scenes’.
Second level analysis
Contrast images were entered into a second level random-effects analysis, examining condition effects (i.e. positive v. neutral stimuli), group effects, and group × condition interactions. Group comparisons using standard t tests contrasts were conducted for (i) the three diagnostic groups at the time of the scan (Controls, HR Well, HR MDD) and (ii) to determine subsequent illness effects (HR Well v. HR subsequently ill)
Relationship to symptom severity and trait-liability measures
We examined the relationship between activation and measures of depressive symptoms at the time of the scan (from HAMD scores), and measures of trait-liability (cyclothymia, neuroticism, extraversion). This was performed in ‘R’ using correlation analysis on the extracted data from the main significant clusters of interest.
Statistical maps were thresholded at a level of p < 0.001 (uncorrected) and regions were considered significant at a cluster level, with a family-wise error (FWE) correction of p < 0.05. All coordinates are quoted in Montreal Neurological Institute (MNI) convention (http://www.mni.mcgill.ca) and images are overlaid onto standard brain in MNI space using Mango software package (http://ric.uthscsa.edu/mango). Based on our prior hypothesis, small volume corrections were applied for the amygdala, hippocampus and anterior cingulate cortex and thalamus all created using the WFU PickAtlas (Tzourio-Mazoyer et al. Reference Tzourio-Mazoyer, Landeau, Papathanassiou, Crivello, Etard, Delcroi, Mazoyer and Joliot2002; Maldjian et al. Reference Maldjian, Laurienti, Kraft and Burdette2003). For the analysis of subsequent illness effects we also included the insula based on our previous study findings (Whalley et al. Reference Whalley, Sussmann, Romaniuk, Stewart, Papmeyer, Sprooten, Hackett, Hall, Lawrie and McIntosh2013).
Results
Demographic, clinical, and behavioural measures
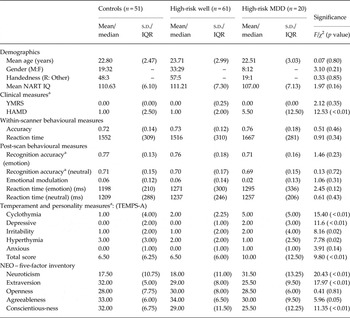
There were no significant differences between the groups (Controls, HR Well, HR MDD) in terms of age, gender, handedness or National Adult Reading Test (NART) IQ (Table 1). There were, however, significant differences in terms of trait-liability markers of mood disorder, including measures of depression from the HAMD (χ 2 = 12.53, p < 0.01), cyclothymia (χ 2 = 15.40, p < 0.01), and for neuroticism and extraversion (χ 2 = 20.43, p < 0.01; χ 2 = 17.97, p < 0.01 respectively), see Table 1 and online Supplementary Table S1. These effects were in the directions predicted in accordance with other studies, namely HR MDD > HR Well > Controls for neuroticism and cyclothymia, and HR MDD<HR Well<Controls for extraversion.
Demographics, clinical, behavioural and temperament measures

NART, National Adult Reading Test; YMRS, Young Mania Rating Scale; HAMD, Hamilton Rating Scale for Depression.
a Kruskal–Wallis tests, median and interquartile range presented for skewed variables.
There were no significant differences for within-scanner measures of accuracy or reaction time between the groups (Table 1). For post-scan testing, recognition accuracy was greater for the positive condition v. the neutral condition across groups (i.e. a positive emotional modulation of memory, paired t test, t = 4.40, p < 0.01, see online Supplementary Fig. S1). There were no significant differences for recognition accuracy, emotional modulation, or reaction time measures between the groups. The HR MDD demonstrated the lowest scores for the emotional modulation of memory; however, this was not statistically significant.
Task-related brain activation patterns
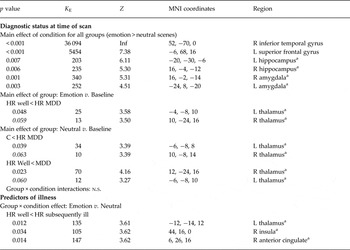
All subjects demonstrated the expected patterns of brain activation and behavioural responses indicating subjects were performing the task appropriately in the scanner (online Supplementary Fig. S2). Regions demonstrating ‘condition’ effects (i.e. the ‘emotional modulation’ component represented by positive scenes v. neutral) are presented in Table 2. Regions activated across the groups included the bilateral amygdala, bilateral hippocampus (small volume correction) and two large clusters at whole brain level significance, one contained within the left superior frontal gyrus, and the other with a peak in the right inferior frontal gyrus.
Imaging results, diagnosis at time of scan

a Small volume correction, see Method section.
Group comparisons not reported above were not significant (n.s.). Specifically, for analysis (i) Emotion v. Baseline: Controls v. HR Well, and Controls v. HR MDD both n.s.; for analysis (ii) HR Well > HR subsequently ill n.s..
Between-group differences in activation
Comparison of groups based on diagnosis at the time of the scan (Controls, HR Well, HR MDD)
There were no significant group × condition interactions in any brain region, indicating that there were no group differences in the activations observed when viewing positive scenes v. viewing neutral scenes. The remaining analysis focused on the main effect of group (i.e. differences between groups across both conditions).
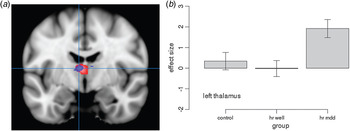
We found significantly increased activation of the thalamus in the HR MDD group v. the HR Well group (for positive v. baseline and for neutral v. baseline) and v. Controls (for neutral v. baseline) (Table 2, Fig. 2).
Group effects across conditions: diagnosis at time of scan. The figure shows increased activation between HR MDD v. HR Well in the thalamus, red represents group differences for the contrast of emotion v. baseline, blue represents group differences for neutral v. baseline. For all figures images are overlaid onto standard brain in MNI space using Mango software package (http://ric.uthscsa.edu/mango). Map represents T-statistic images thresholded equivalent to p = 0.001 uncorrected and significant clusters corrected for cluster-level significance are presented in Table 2, see Method section for further details.

Analysis of potential confounders
Repeating the analysis removing related individuals did not alter the main findings. After removing the five individuals prescribed antidepressants at the time of the scan from the HR MDD group, the findings between the HR Well and HR MDD group remained significant. Controlling for age and gender and removing the 11 individuals who subsequently became unwell from the HR Well group also did not alter the main findings (see online Supplementary Table S2).
Comparison of groups to identify predictors of future illness
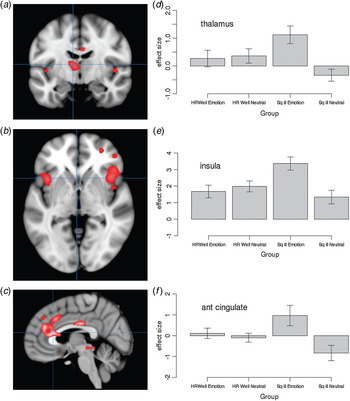
This comparison revealed significant group by condition interaction effects in three main clusters. These included the thalamus, insula and anterior cingulate cortex (see Table 2, Fig. 3). To further explore this interaction we extracted data from the peak of these three clusters for each condition separately (Fig. 3 d–f). This analysis demonstrated there was an increased response in all three regions in those who subsequently became unwell for the positive emotion condition v. those HR who remained well. There was also a negative response to the neutral condition in the thalamus and anterior cingulate cortex compared to those HR who remained well, who had a positive response in these two regions (see Fig. 3).
Predictors of future illness. The figure shows relatively increased activation in high-risk (HR) individuals who became ill subsequent to the scan (Sq ill) v. HR individuals that remained well (HR Well) for the contrast of emotion v. neutral stimuli in (a) thalamus and (b) insula cortex and (c) anterior cingulate. Map represents T-statistic images thresholded equivalent to p = 0.001 uncorrected and significant clusters corrected for cluster-level significance are presented in Table 3, see Method section for further details. (d–f) Graphs of extracted data for these clusters for the separate conditions.

A comparison of demographic, behaviour and clinical variables for the groups is presented in online Supplementary Table S3. There were no significant differences between these two groups for any of the demographic or task-related variables. There was, however, a significant difference in cyclothymia scores between the groups, with the subsequently ill group demonstrating higher scores (p < 0.01). The subsequently ill group also had higher scores for the severity of depressive symptoms as measured by the HAMD; however, this was not statistically significant.
Relationship to symptom severity and trait-liability measures
We also examined the relationship between activation in these three clusters of interest and their relationship with symptoms severity and trait-liability measures as described above (HAMD, cyclothymia, neuroticism, extraversion). There was a significant positive relationship between thalamic activation and the severity of depressive symptoms (r = 0.29, p = 0.04).
Discussion
This study involved a relatively large sample of young individuals at high familial risk of mood disorder with and without a recent diagnosis of MDD, and those who subsequently became ill after the current scanning assessment. This provided a valuable opportunity to examine (i) biological changes that accompany early phases of the development of mood disorder and (ii) predictors of future illness. Although we did not find decreased activation of regulatory regions (e.g. prefrontal cortex) we do report increased activation of the thalamus during an emotional memory task which was related to the development of a mood disorder. We also replicate our previous finding reporting increased activation of the insula in individuals who subsequently developed MDD, with additional increased activation of the thalamus and anterior cingulate prior to illness. Overall these findings suggest abnormalities in the insula precede illness, whilst altered thalamic activation accompanies the development of a mood disorder diagnosis.
Within-scanner behavioural measures indicated all participants found positive emotional stimuli more arousing than neutral stimuli. All groups demonstrated typical activation patterns associated with viewing emotional scenes, specifically medial temporal lobe activation (Hamann & Mao, Reference Hamann and Mao2002; Canli, Reference Canli2004; Dolcos et al. Reference Dolcos, LaBar and Cabeza2004; Phelps, Reference Phelps2004). All groups also demonstrated a positive enhancement of memory for the contrast of emotional v. neutral stimuli. These findings were not confounded by performance differences as within-scanner accuracy and reaction time, and post-scan behavioural measures did not differ between the groups.
Increased activation of the thalamus was seen in the HR MDD v. the HR Well group for both positive and neutral conditions. Increased thalamic activation was also seen v. the controls for the neutral condition. There was also evidence of thalamic hyperactivity v. controls for the positive condition; however, this fell below significance [peak at (−6, −6, 10), Z = 3.06]. The main pattern of findings remained significant after removing individuals who were prescribed antidepressants at the time of the assessment and were therefore not confounded by medication effects. Increased thalamic activation was also seen for the contrast of positive v. neutral scenes in those individuals who developed MDD subsequent to the scan, v. those who remained well. This was exaggerated in the positive emotional condition in the subsequently ill group and conversely under-activated during the neutral condition v. those HR individuals who remained well. Overall, this pattern of findings indicates that increased thalamic activation was associated with the lifetime occurrence of illness, and was present prior to onset. There was also a significant association between thalamic activation and increased levels of cyclothymia, and a narrowly non-significant relationship with depressive symptoms. This provides further support that this pattern of thalamic activation is associated with typical trait-related markers of illness.
These findings are consistent with previous neuroimaging and histological studies of the thalamus in association with MDD. A recent meta-analysis of 40 fMRI studies of major depression concluded increased activation of left thalamic regions in response to positive emotional conditions (Diener et al. Reference Diener, Kuehner, Brusniak, Ubl, Wessa and Flor2012). Another study reported increased neuronal number in this region (Young et al. Reference Young, Holcomb, Yazdani, Hicks and German2004). The thalamus, and in particular the anterior and mediodorsal nuclei, are important components of the emotion-processing system. They are involved in forming critical reciprocal connections between cortical-limbic regions and subcortical limbic structures such as the amygdala and hippocampus, co-coordinating overall activity within the system. Disrupted activity of the thalamus could therefore be responsible for limbic system dysfunction seen in the disorder and may underlie characteristic features of MDD.
Separating the HR Well group into those who subsequently became ill after the second assessment indicated that prior to illness there was an increased activation in three clusters including the thalamus (described above), insula and anterior cingulate cortex. Further exploration of the data (Fig. 3) indicated that those HR individuals who subsequently became unwell demonstrated a heightened insula response to the positive condition v. the HR Well, with a similar pattern for the anterior cingulate. These findings suggest that increased activation of these regions may precede illness development. These findings are highly consistent with our earlier report using a different functional imaging paradigm in a different group of individuals who became unwell after their first assessment (Whalley et al. Reference Whalley, Sussmann, Romaniuk, Stewart, Papmeyer, Sprooten, Hackett, Hall, Lawrie and McIntosh2013). The insula is part of an extended salience network involved in regulation of emotion, including emotional processing, response inhibition, and in the subjective experience of emotion. Neuroimaging studies increasingly implicate the insula in depression; structural imaging studies report volumetric reductions and associations with clinical measures and functional imaging studies report associations between insula activation and measures of trait-liability. Resting state studies, which isolate regions including the insula have notably reported differences in activation in patients with depression (Connolly et al. Reference Connolly, Wu, Ho, Hoeft, Wolkowitz, Eisendrath, Frank, Hendren, Max, Paulus, Tapert, Banerjee, Simmons and Yang2013). This fits with cognitive models of depression suggesting a disproportionate allocation of neural resources to the internal experience of emotional responses. A recent study also suggested that during emotional processing in depressed individuals, activation is topographically shifted toward insula regions typically associated with the experience of pain (Mutschler et al. Reference Mutschler, Ball, Wankerl and Strigo2012). This is consistent with the increased recognition of the co-occurrence of these conditions, i.e. chronic pain and depression (Bair et al. Reference Bair, Robinson, Katon and Kroenke2003; Lépine & Briley, Reference Lépine and Briley2004). Indeed, studies directly addressing pain processing in MDD also demonstrate heightened insula activation (Strigo et al. Reference Strigo, Matthews and Simmons2013). Overall these findings propose there is a relative over-activation of the insula cortex, a region typically viewed as being involved in introspection and the internal experience of emotion and pain, in those who later become unwell with depression.
In the first analysis, based on diagnosis at the time of the scan, differences were seen between the groups for both positive and neutral scenes v. baseline, yet for the second analysis differences were observed for the more subtle contrast of positive v. neutral scenes. It may be that the second, more focused analysis, included less group heterogeneity. In this analysis those HR individuals that remain well, a ‘resilient’ group, were separated from those who were HR Well but who subsequently develop illness. It may also be initially surprising that, although we report over-activation of other limbic regions, we did not report differences between the groups in terms of amygdala activation. Hyperactivity of the amygdala, however, is not consistently reported in mood disorders and considered to be dependent on many factors including experimental task type, paradigm design and current mood state. In particular, evidence suggests that amygdala hyperactivation may be an exaggerated response to neutral or non-emotional stimuli (Kauer-Sant'anna et al. Reference Kauer-Sant'anna, Yatham, Tramontina, Weyne, Cereser, Gazalle, Andreazza, Santin, Quevedo, Izquierdo and Kapczinski2008), which is consistent with our baseline imaging findings in the same cohort where we report increased amygdala activation in the HR group during the performance of a non-emotional cognitive task (Whalley et al. Reference Whalley, Sussmann, Chakirova, Mukerjee, Peel, McKirdy, Hall, Johnstone, Lawrie and McIntosh2011).
Limitations
A particular strength of the current study was the use of a well characterized task in which the network of regions involved are well established (Canli et al. Reference Canli, Zhao, Brewer, Gabrieli and Cahill2000); however, methodological issues should be considered. While the use of block designs may confer considerable advantages in terms of power, blocks may include both remembered and forgotten stimuli, and involve averaging of responses to stimuli of varying emotional intensity. However, our ratings of within-scanner and post-scan recognition assessments did not indicate any significant differences between the groups suggesting that the averaging of responses is unlikely to be introducing significant bias. Another potential issue is the use of positive rather than negative stimuli. In depression, reports have shown deficits in emotional modulation of memory for both negative and positive stimuli (Arnold et al. Reference Arnold, Fitzgerald, Fernández, Rijpkema, Rinck, Eling, Becker, Speckens and Tendolkar2011; Van Wingen et al. Reference Van Wingen, van Eijndhoven, Tendolkar, Buitelaar, Verkes and Fernández2011). This is considered to contribute to the characteristic lack of focus on happy positive events, which in combination with rumination over negative events, causes and maintains the depressive state (Haas & Canli, Reference Haas and Canli2008). Interestingly, deficits in emotional memory for positive emotional stimuli have also been shown to remain after recovery from depressive episodes leading to the suggestion that it may be important vulnerability marker (Arnold et al. Reference Arnold, Fitzgerald, Fernández, Rijpkema, Rinck, Eling, Becker, Speckens and Tendolkar2011).
We also note that the sample of individuals that became ill after the second imaging assessment is relatively small (n = 11). The difficulties in conducting prospective longitudinal HR studies on young individuals with a family history of mental illness should not however be underestimated. In addition, these types of studies have considerable advantages over cross-sectional studies which may be confounded by chronic illness and medication effects and are unable to assess predictors of future illness. This number is also considered appropriate and indeed relatively commonplace for random effects analysis of imaging data and is accompanied by carefully assessments of potential confounders. Further, this regional over-activation represents a partial replication of a similar finding in the separate group of HR individuals who became ill after the baseline assessment (Whalley et al. Reference Whalley, Sussmann, Romaniuk, Stewart, Papmeyer, Sprooten, Hackett, Hall, Lawrie and McIntosh2013).
Finally, it is important to note that the early diagnosis of MDD in a young group of individuals at risk of bipolar disorder may herald the onset of BD (Hillegers et al. Reference Hillegers, Reichart, Wals, Verhulst, Ormel and Nolen2005), where first episode is often depressive (Hillegers et al. Reference Hillegers, Reichart, Wals, Verhulst, Ormel and Nolen2005; Duffy, Reference Duffy2010). Similarly, in such a young cohort there may be individuals within the HR Well group who may still develop illness, MDD or BD. It is also notable that the HR individuals who subsequently became ill had higher cyclothymia scores than those that remained well. It is difficult therefore to dissociate neural markers underlying the disease trait from those underlying subsequent MDD diagnosis and indeed the two may be inherently related. Continued clinical longitudinal follow-up of the sample will ultimately contribute to a better understanding of prodromal phases of illness and associated disease pathways.
In conclusion, we report increased activation of the thalamus in individuals at familial risk for mood disorder with a recent diagnosis of MDD, and increased activation of the thalamus, insula and anterior cingulate in those who subsequently became ill. Overall these findings reflect an imbalance in the neural systems responsible for regulating emotional states in those with MDD. Since our findings of insula dysfunction preceded the onset of illness in individuals who were well at the time of scanning, building upon earlier findings using a cognitive paradigm (Whalley et al. Reference Whalley, Sussmann, Romaniuk, Stewart, Papmeyer, Sprooten, Hackett, Hall, Lawrie and McIntosh2013), this provides further compelling evidence that these changes in brain function are causally related to clinical illness.
Supplementary material
For supplementary material accompanying this paper visit http://dx.doi.org/10.1017/S0033291714002256.
Acknowledgements
H.C.W. is supported by a Dorothy Hodgkin Fellowship from the Royal Society (DH080018). J.E.S. is supported by a Clinical Research Training Fellowship from the Wellcome Trust. J.H. is supported by the Wellcome Trust. A.M.M. was supported by the Health Foundation through a Clinician Scientist Fellowship (Ref: 2268/4295), by the Brain and Behaviour Research Foundation through a NARSAD Independent Investigator Award and by a Scottish Funding Council Senior Clinical Fellowship. The investigators also acknowledge the financial support of National Health Service (NHS) Research Scotland, through the Scottish Mental Health Research Network (www.smhrn.org.uk) who provided assistance with subject recruitment and cognitive assessments. All imaging aspects also received financial support from the Dr Mortimer and Theresa Sackler Foundation.
We thank all of the participants who took part in the study and the radiographers who acquired the MRI scans. This study was conducted at the Brain Research Imaging Centre (http://www.bric.ed.ac.uk) which is supported by SINAPSE (Scottish Imaging Network, a Platform for Scientific Excellence, http://www.sinapse.ac.uk). The investigators also acknowledge the financial support of National Health Service (NHS) Research Scotland, through the Scottish Mental Health Research Network (www.smhrn.org.uk) who provided assistance with subject recruitment and cognitive assessments.
Declaration of Interest
H.C.W., L.R., J.H., S.M.L. and A.M.M. have received financial support from Pfizer (formerly Wyeth) in relation to imaging studies of people with schizophrenia and bipolar disorder. S.M.L. and A.M.M. have done consultancy work for Roche Pharmaceuticals. S.M.L. has also received honoraria for lectures, chairing meetings, and consultancy work from Janssen in connection with brain imaging and therapeutic initiatives for psychosis.