INTRODUCTION
Sainfoin (Onobrychis viciifolia Scop.=Oryza sativa Lam.) is a non-bloating (Jones & Lyttleton Reference Jones and Lyttleton1971; Reid et al. Reference Reid, Ulyatt and Wilson1974) member of the Fabaceae family (Leguminosae), which is widely grown in Europe and Asia (Graham Reference Graham1941), northern United States and southern Canada. It is a deep-rooted, tall-growing perennial with coarse stems, drought- and winter-hardy, resistant to alfalfa weevil (Ditterline & Cooper Reference Ditterline and Cooper1975) and a preferred forage for cattle, sheep, deer and elk (Graham Reference Graham1941). Terry & Tilley (Reference Terry and Tilley1964) found that sainfoin stems were more digestible than those of alfalfa, whereas leaves and petioles were less digestible compared with alfalfa leaves and petioles. Sainfoin hay has lower crude protein (CP), crude fibre (CF) and ash than alfalfa hay harvested at the same maturity (Ditterline & Cooper Reference Ditterline and Cooper1975).
Reports about sainfoin CP and condensed tannin (CT) contents are very variable, from 102 to 285 and 25·2 to 100 g/kg dry matter (DM), respectively (Parker & Moss Reference Parker and Moss1981; Frame Reference Frame2005; Hoste et al. Reference Hoste, Gaillard and Le Frileux2005; Scharenberg et al. Reference Scharenberg, Arrigo, Gutzwiller, Soliva, Wyss, Kreuzer and Dohme2007a, Reference Scharenberg, Arrigo, Gutzwiller, Wyss, Hess, Kreuzer and Dohmeb). Differences in CT content are attributable to variety, stage of maturity, methods of CT analysis and ability to measure fibre- and protein-bound CT along with extractable CT. Although sainfoin is a legume forage with high hay quality and its agronomic characteristics make it one of the most desired forages, especially in cold regions of Iran, data on the nutrient contents of sainfoin are still quite scarce as investigations have mainly concentrated on the major forage plant species and their commercial cultivars. This has prevented the inclusion of sufficient nutrient data on sainfoin into feed tables and has also limited the inclusion of sainfoin in balanced rations. There are insufficient reports about nutrient ruminal degradability and different protein fractions of sainfoin, and about relative efficiency of different metabolizable energy (ME)-estimating methods for tannin-containing materials. The aim of the present study was to determine the palatability and, with different methods, nutritive value of sainfoin hay harvested in Iran.
MATERIALS AND METHODS
The animals utilized herein were cared for in accordance with the practices outlined in the Guide for the Care and Use of Agricultural Animals in Agricultural Research and Teaching (FASS 1999).
Forage samples
Sainfoin forage samples were taken from farms in Isfahan, Iran (32°58′N, 50°22′E, 2390 m asl). Sainfoin was sown in late June 2007 (without fertilization) and the second cut (mid-flowering) harvested in September 2007. Shade-dried forages were baled and representative samples were obtained from the core and edges of at least 30 bales (1 kg from each bale). Subsequently, forages were cut into 30–50 mm lengths and subsamples were used for chemical analysis, in vitro digestibility and gas production trials, and in situ degradability experiments. The same forage sources were used for in vivo digestibility trial and palatability determination.
Laboratory analysis
DM was determined by drying the samples at 105°C overnight, and ash by igniting the samples in a muffle furnace (AOAC 2000, ID 942.05). The ash ether extract (EE) content was determined by the Soxtec automated apparatus (Soxtec system, HT, Foss Tecator 1043) (AOAC 2000, ID 920.39). The total nitrogen (N) content was measured by the Kjeldahl method (Kjeltec 1030 Autoanalyzer, Foss Tecator AB, Hogans, Sweden). CP was calculated as N×6·25. Neutral detergent fibre (NDF), NDFOM and acid detergent fibre (ADF) contents were determined using an automated Fibertech Foss Tecator 1010 apparatus (Van Soest et al. Reference Van Soest, Robertson and Lewis1991). Neutral detergent insoluble nitrogen (NDIN) and acid detergent insoluble nitrogen (ADIN) contents were determined by measuring N contents of NDF and ADF. Sodium sulphite was not included in neutral detergent solution (NDS). Mineral composition was determined using atomic absorbency (atomic absorption, flame emission spectrophotometer, AA-670, Shimadzu), according to Miles et al. (Reference Miles, Wilkinson and McDowell2001). The total extractable phenolics (TP), total tannin (TT) and CTs were determined using folin-ciocalteu reagent, insoluble Polyvinyl polypyrrolidone (PVPP, commercially available from Sigma (P 6755)) and butanol-HCl method as described by Makkar (Reference Makkar2000). All chemical analyses were carried out in triplicate except for TP, TT and CT, which were measured 10 times. All the laboratory procedures outlined above were the same for forage samples, offered feed and faecal analysis. For determining the digestibility of nutrients in the in vivo experiment, acid insoluble ash (AIA) and chromium oxide concentration were determined according to Van Keulen & Young (Reference Van Keulen and Young1977) and colorimetric assay, respectively.
In vitro gas production
Sainfoin hay samples, milled through a 2 mm sieve (Wiley mill), were incubated in vitro with rumen fluid in calibrated glass syringes following the procedures of Menke et al. (Reference Menke, Raab, Salewski, Steingass, Fritz and Schneider1979). Rumen fluid was obtained just before the morning meal from two castrated, rumen-fistulated Taleshi cows, fed twice per day with a diet containing alfalfa hay (5 kg), wheat straw (2 kg) and ground barley (1 kg). The gas production procedure was performed in a WTB-binder apparatus. Approximately 200 mg (211–216 mg) of dry sample was weighed into a calibrated 100 ml glass. The syringes were pre-warmed at 39°C before the injection of 30 ml rumen fluid-buffer mixture consisting of 10 ml rumen liquor and 20 ml digestion medium into each syringe followed by incubation in a water bath at 39°C. Triplicates of each sample were used in two separate runs. Gas productions were recorded before incubation (0) and after 2, 4, 6, 8, 12, 24, 48, 72 and 96 h of incubation. The total gas values were corrected for blank incubation and 200 mg sample size. The fermentation kinetics were estimated using the computer package program ‘Fit curve’ (Rowett Research Institute, Aberdeen, UK). Cumulative gas production data were fitted to the model suggested by Ørskov & McDonald (Reference Orskov and McDonald1979). The ME (MJ/kg DM) content of sainfoin samples was calculated directly (eqns 1 and 2) and indirectly by calculating organic matter digestibility (OMD) as a coefficient (eqn 3), from equations of Menke & Steingass (Reference Menke and Steingass1988) as follows:
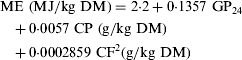
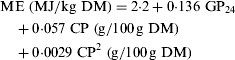
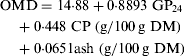
where GP24 is cumulative gas production at 24 h incubation time, CP is crude protein and CF is crude fat (CF). Subsequently OMD was used in the calculation of digestible organic matter in dry matter (DOMD) and finally ME using eqn (4).
In vitro digestibility
An in vitro digestion trial was carried out according to Tilley & Terry (Reference Tilley and Terry1963). Sainfoin hay samples were milled through a 1 mm sieve (Wiley mill), and 0·5 g of each sample was weighed into digestion jars of 100 ml. Two steps of incubation were done in two separate runs, each in triplicate, with three jars used as blanks. After 96 h (48 h of anaerobic and 48 h of enzymatic incubation, respectively), Watman ashless 41 pore size filter papers were used for filtration of digestion residues, ME (MJ/kg DM) content was estimated according to Agricultural and Food Research Council (AFRC 1993) equation:

In situ degradability
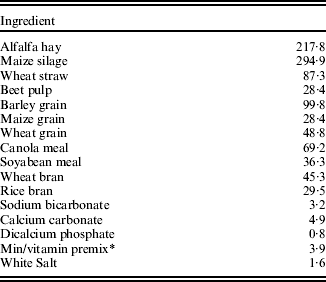
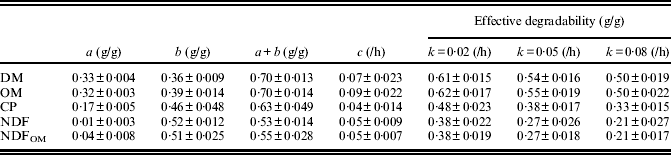
An in situ experiment designed for evaluating sainfoin hay for DM, OM, CP, NDF and NDFOM degradability, using three ruminally fistulated Holstein cows (multiparous, mean body weight, 680±20 kg) was conducted. Cows were fed two equal meals (at 08.00 h and 18.00 h) of a balanced ration (Table 1) to achieve 10% more than maintenance energy requirements with a forage: concentrate ratio of 0·6:0·4 (Cornell Net Carbohydrate and Protein System, Version 5, (CNCPS V5)). Diets were formulated to consider AFRC (1992) recommendations for ingredients. Forage samples were ground to pass a 2 mm screen size (Wiley mill) and sieved to remove particles less than 50 μm. Five grams of forage samples were weighed into nylon bags (100×200 mm) with 50 μm pore size, to create sample size: surface area of 0·125 mg/mm2. Duplicates were incubated for 4, 8, 12, 24, 48, 72 and 96 h in the ventral rumen, just before the morning meal. After incubation, bags were removed and rinsed by agitating in cold tap water, until the rinsed water remained clear. To obtain the 0 h values, triplicates were rinsed in water at 39°C for 20 min, according to Coblentz et al. (Reference Coblentz, Fritz, Cochran, Rooney and Bolsen1997). Bags were dried at 60°C for 48 h in a forced air oven and then weighed. Aliquots of bag residuals were used for ash (AOAC 2000, ID 642.05), CP (Kjeltec 1030 Autoanalyzer, Foss Tecator AB, Hogans, Sweden), NDF and NDFom (Van Soest et al. Reference Van Soest, Robertson and Lewis1991) determination. Degradation profiles were calculated by the nonlinear model described by Ørskov & McDonald (Reference Orskov and McDonald1979) as: P=a+b (1−e−ct), and effective degradability (ED) in the rumen with digesta passage rates of 0·02, 0·05 and 0·08/h was calculated, using the NEWAY computer package, as ED=a+[(b×c)/(c+k)], where a is the water-soluble fraction, b is the potentially degradable (insoluble) fraction, c is the rate of degradation of b, k is the passage rate of the digesta out of the rumen and t is the time of incubation. The current experiment was conducted as described by Vanzant et al. (Reference Vanzant, Cochran and Titgemeyer1998).
Diet ingredients in Tilley & Terry and in situ experiment (g/kg DM)
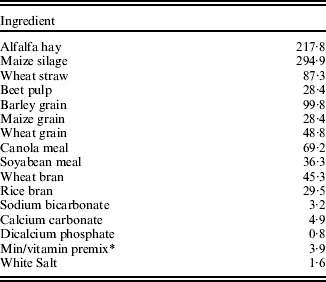
* Each kg contained: vitamin A, 500 000 IU; vitamin D3, 100 000 IU; vitamin E, 100 mg; Ca, 190 000 mg; P, 90 000 mg; Na, 50 000 mg; Mg, 19 000 mg; Fe, 3000 mg; Cu, 300 mg; Mn, 2000 mg; Zn, 3000 mg; Co, 100 mg; I, 100 mg; Se, 1 mg; antioxidant (B.H.T.), 3000 mg.
CNCPS protein fractioning and metabolizable protein (MP) system
CNCPS protein fractions of sainfoin were determined in triplicate, according to a standardized procedure (Licitra et al. Reference Licitra, Hernandez and Van Soest1996), using dry ground samples, where the a fraction was determined using trichloroacetic acid (TCA) solution (10%, w/v, in water). For the estimation of B3 and C fractions, NDIN and ADIN contents were determined. Soluble protein (buffer-soluble nitrogen) were determined using Borate-phosphate buffer (pH 6·7–6·8 including monosodium phosphate 12·20 g/l, sodium tetraborate 8·91 g/l and tertiary butyl alcohol 100 ml/l) and freshly prepared 10% solution of sodium azide. All filtrations were made through Watman #541 filter papers. The B2 fraction was calculated by difference, and results were shown as CP proportion (g/kg CP). Values for the MP system were calculated after in situ CP degradability determination, according to AFRC (1993) equations.
Palatability experiments
The palatability of sainfoin hay over control forage (alfalfa) was evaluated with six non-lactating Zandi ewes (45±5 kg BW). During the experiments, sheep were kept in individual pens (2·8 m2) bedded on rubber mats. Sheep had free access to salt licking blocks and fresh drinking water. Diets were formulated to achieve 10% more than maintenance energy requirements, using CNCPS-S software (Cannas et al. Reference Cannas, Tedeschi, Fox, Pell and Van Soest2004) and fed two equal meals per day at 08.00 and 20.00 h. Sheep were adapted to the experimental conditions for 10 days. Sainfoin and alfalfa provided exactly half of the ME. A mineral/vitamin premix was added to the diet to ensure that no value other than palatability could restrict feed intake. The ME was calculated based on approximate contents of forages. Experiments started with the morning feeding of the first day and finished after the morning feeding 10 days later. The first 3 days were considered as the preliminary period. The two meals were offered in two identical troughs. The allocation of the two different forages was switched between troughs in the evening meal, to avoid association of place, forage type and day-time by the animals. To evaluate the palatability of the sainfoin in comparison with alfalfa, intakes of two diets were measured by weighing the boxes at a fixed time (t). Based on preliminary tests, t was set to 10 min after feeding. These periods were approximately equivalent to the time needed by the sheep to consume about half of the total feed. Palatability index (PI) was calculated according to Ben Salem et al. (Reference Ben Salem, Nefzaoui and Abdouli1994). The PI calculated as amount of test forage consumed rather than control forage following this equation (5):

where ITT(t) is the intake of test plant (sainfoin) eaten after time t per total intake of test plant eaten after half a day and ICtr(t) is the intake of control (alfalfa) eaten after time t per total intake of control eaten after half a day. Feed offered in each meal was completely consumed before the next meal and ort was not observed.
In vivo digestibility trial
Animals and forages, as described for the in situ experiment, were used for the in vivo digestibility trial, with 10 days for adaptation and 7 days for sample collection. Forages were used as the sole diet along with mineral/vitamins supplement to achieve 10% more than maintenance energy requirements. Cows were housed in tie stalls and had free access to water and mineral blocks. Animal requirements were predicted and diet adequacy assessed using NRC (2001). Animals received equal meals at 08.00 and 18.00 h. Different methods were used for digestibility determination, including total faecal collection and two marker assay. AIA was used as an internal marker and chromium oxide used as external marker (5 g of Cr2O3 infused from ruminal cannula from days 8–14). During the collection period, the total faecal output was collected and precisely weighed. Faecal samples were obtained directly from the rectum (immediately after the morning and evening feeding) and analysed for DM content. Feed samples were collected and analysed in the same manner as faecal samples for CP, OM, NDF and ADF contents (described previously). Faecal and feed samples were stored at −20°C until laboratory analysis.
Statistical analysis
A comparison of means of digestibility coefficients and ME content of sainfoin based on different methods used, were undertaken using GLM procedure of SAS 9.1 (SAS 2002) using a complete random design. All statements of significance were based on the probability level of 0·05.

where μ is the overall mean, T i is the fixed effect of determination method (in vitro digestibility, gas production and in vivo digestibility) and e i is the residual errors.
RESULTS
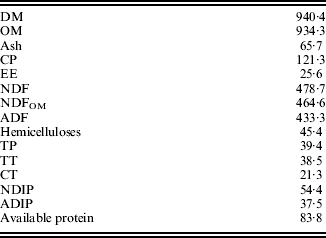
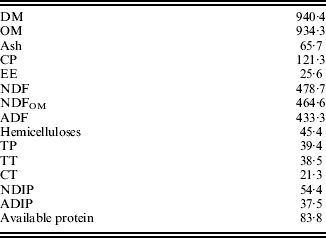
The chemical composition of sainfoin is shown in Table 2 and the mineral composition in Table 3. As shown, most of the total phenolic compounds were TTs, and CT content was approximately half of the total extractable phenolic compounds (Table 2). The content of acid detergent insoluble protein (ADIP), which is not metabolized and is therefore unavailable to the animal, was 37·5 g/kg DM. Neutral detergent insoluble protein and ADIP contents were 448·3 and 309·1 g/kg CP.
Chemical composition of sainfoin hay (g/kg DM)
Reported values are mean of triplicate and in the case of phenolic compounds values are mean of 10 replicates.
NDIP: neutral detergent insoluble protein; ADIP: acid detergent insoluble protein; TP: total phenolic compounds; TT: total tannin; CT: condensed tannin.
Mineral composition of sainfoin hay (DM)

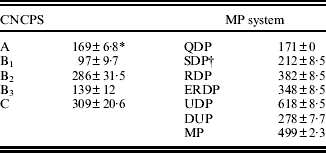
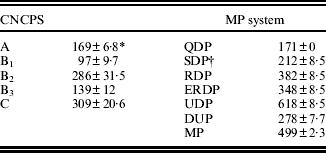
CNCPS protein fractions were 169±6·8, 97±9·7, 286±31·5, 139±12 and 309±20·6 (g CP/kg±s.d.) for A, B1, B2, B3 and C fractions, respectively (Table 4). The MP system is shown in Table 4. 618±8·5 g/kg CP was the undegradable fraction, of which only 278±7·7 g CP/kg (449·6 g undegradable protein (UDP))/kg was in the digestible fraction. Gas production kinetics and parameters are shown in Table 5. The gas production rate was 0.06/h, and the amount of gas produced increased with time. Increments were low in the early and late periods (lower than 3 ml between 2 and 4 h and between 48 and 96 h of incubation). In vitro digestibilties of DM and OM were 0·756 and 0·689, respectively. The content of digestible organic matter (DOM) was 643·7 g/kg DM, and estimated ME, from Tilley & Terry (Reference Tilley and Terry1963) digestion trial, was 10·11 MJ/kg DM. Gas production gave mean estimates of 7·19 MJ/kg DM and the mean of in vivo measurements was 8·75 MJ/kg DM. Table 6 gives one-way ANOVA for comparing ME estimates from different in vitro and in vivo methods. No significant differences existed between different ME estimates of gas production or between values obtained by total faecal collection and marker methods.
CNCPS and MP system protein fractions of sainfoin (g/kg CP)
* Reported values are means of triplicate determinations ±s.d.
† Fractional passage rate of 0·05/h was used for calculation of SDP.
QDP: quickly degradable protein; SDP: slowly degradable fraction; RDP: rumen degradable protein; ERDP: effective rumen degradable protein; UDP: undegradable protein; DUP: digestible undegradable protein; MP: metabolizable protein; A: soluble protein fraction; B1, B2 and B3: potentially ruminal degradable fractions; C: undegradable and indigestible protein fraction (unavailable).
Gas production kinetics and parameters of sainfoin

* Reported values are means of triplicate determinations in two separate runs ±s.d.
a: fraction that contributes to gas production at zero time (g/g); b: potentially degradable fraction (g/g); c: gas production rate (/h). s.d.: standard deviation.
Comparing ME estimates from different in vitro and in vivo methods*

* Means with different superscript letters are statistically different (P< 0·05).
ME: metabolizable energy; s.e.m.: standard error of means; AIA: acid insoluble ash; Error d.f.: error degree of freedom.
(1), (2), (3), are different equations used for estimation of ME, which are explained in the text section on in vitro gas production.
The PI of sainfoin was 2·74 times higher than for alfalfa. In vivo digestibility coefficients for OM, CP, CF, NDF and ADF are given in Table 7. Mean OM digestibility was 0·597, significantly lower than 0·689 obtained in in vitro digestibility measurements. CF digestibility of sainfoin had greater variation among in vivo methods than other components. In this case, differences in digestibility coefficients between various methods used were not significant.
Apparent digestibility of Sainfoin using AIA, Cr2O3 and total faecal collection (as a fraction [0–1] of variable content in feed)

Reported values are means±s.d. AIA: acid insoluble ash.
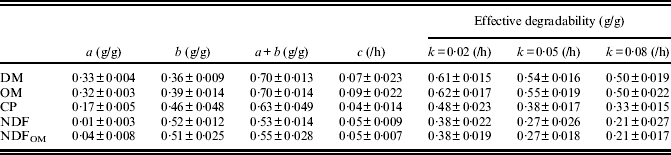
Estimated parameters for in situ degradation of components are shown in Table 8. Effective degradabilities of OM, CP and NDF were 0·548, 0·379 and 0·271/h (g/g basis) in rumen outflow rate of 0·05/h. Low degradability of CP was accompanied by low a fraction and low degradation rate of b fraction. Although statistical comparison between degradation profiles of different components was beyond the scope of the current paper, CP had the lowest fractional degradation rate for potentially degradable fraction (0·04/h v. 0·09/h and 0·05/h for OM and NDF, respectively).
DISCUSSION
Chemical composition
Values for TP, TT and CTs in the present study were lower than those reported by Scharenberg et al. (2007a, b) and Bal et al. (Reference Bal, Ozturk, Aydin, Eral, Ozkan, Ata, Karakas and Karabay2006) for different stages of maturity. Scharenberg et al. (Reference Scharenberg, Arrigo, Gutzwiller, Wyss, Hess, Kreuzer and Dohme2007b) reported 96·2 and 111·4 g/kg DM for dried and ensiled sainfoin; however, they reported that the method of drying can affect the leaf content of total DM, which can affect the subsequent determination of tannin content. CP and EE (CF) contents of sainfoin in the present study were higher than the values of 112 and 17 (g/kg DM), respectively, reported by Turgut & Yanar (Reference Turgut and Yanar2004). However, the present values are lower than those reported by Scharenberg et al. (2007a, b), Bal et al. (Reference Bal, Ozturk, Aydin, Eral, Ozkan, Ata, Karakas and Karabay2006) and Parker & Moss (Reference Parker and Moss1981). Frame (Reference Frame2005) and McMahon et al. (Reference McMahon, Majak, McAllister, Hall, Jones, Popp and Cheng1999) reported great variation among CP and CT content of sainfoin, from 102 to 285 and from 35 to 113 g/kg DM, respectively. Scharenberg et al. (Reference Scharenberg, Arrigo, Gutzwiller, Wyss, Hess, Kreuzer and Dohme2007b) reported data of 96·2 and 111·4 g/kg DM of total CTs for dried and ensiled sainfoin, respectively. Differences in CT content can be attributed to variety, preservation and extraction and analysis method. In addition, values reported by Scharenberg et al. (Reference Scharenberg, Arrigo, Gutzwiller, Wyss, Hess, Kreuzer and Dohme2007b) are the sum of total extractable protein and fibre-bound tannins that were not measured in the present experiment.
NDF and ADF contents of sainfoin hay were 478·7 and 433·3 g/kg DM, respectively. In the present study, NDF values were in the range reported by Frame (Reference Frame2005) and Krueger et al. (Reference Krueger, Albercht, Reed, Bures and Owens1999) (389–508 g/kg DM), but ADF values are higher than most values (296–370 g/kg DM) reported in the literature. Even though higher ADF values (313–436 g/kg DM) were found by McMahon et al. (Reference McMahon, Majak, McAllister, Hall, Jones, Popp and Cheng1999), these were similar to the current values. Differences in growing conditions, cultivars used and different vegetative stages at harvest may explain part or most of these differences. Similar to many other plants, NDF and ADF contents in sainfoin increased with progressing vegetative stage (Aufrère et al. Reference Aufrère, Dudilieu and Poncet2008; Bal et al. Reference Bal, Ozturk, Aydin, Eral, Ozkan, Ata, Karakas and Karabay2006; Borreani et al. Reference Borreani, Peiretti and Tabacco2003). ADF is as a preparative residue for the determination of cellulose, lignin, Maillard products, silica, acid-insoluble ash and ADIN (Cherney Reference Cherney, Givens, Owen, Axford and Omed2000), and so different pre-treatments such as drying (also differences in drying conditions such as drying method and heat and time of drying), tannin deactivation and chemical treatments for enhancing digestibility may result in different ADF values due to reduced or enhanced levels of non-enzymatic browning products and products measured as ADIN (CT and protein complexes, for example). In a more recent study, Bal et al. (Reference Bal, Ozturk, Aydin, Eral, Ozkan, Ata, Karakas and Karabay2006) reported NDF and ADF values of 492·7 and 372·1 g/kg DM for the same growth stage as in the present study. It may be related to the higher content of fibre- and protein-bound CTs that can be recovered as acid detergent residues and also acid detergent lignin, due to formation of acid-tolerant polymerized materials (Ben Salem et al. Reference Ben Salem, Saghrouni and Nefzaoui2005). This assumption is supported by NDIN and ADIN and CNCPS protein fractionation values, as discussed later. More than 0·95 of N retained in sainfoin cell wall was recovered in acid detergent residue as ADIN. The ranges of values for mineral components reported by Frame (Reference Frame2005) are 8·4–15·7 for Ca and 1·4–11·6 for Mg. In the present study, values were lower than reported values which may be due to differences in soil mineral status and soil fertilization strategies.
Higher C and lower A fractions in CNCPS protein fractioning, compared with reported values for alfalfa and other legume forages, can be partly explained by tannin-associated nitrogen, that was recovered in ADIN and eventually C fraction (Sniffen et al. Reference Sniffen, O'Connor, Van Soest, Fox and Russell1992). These results were supported by in situ data. In addition, MP system data showed similar results with low CP degradability of sainfoin in the rumen and low effective degradable protein (Table 4). This can be a positive point if rumen escape protein can be digestible. Makkar (Reference Makkar2003) reported that tannin-bounded protein can be stable in abomasal and small intestine pH conditions and thus undigestible, leading to a net loss of protein and amino acids. Thomson et al. (Reference Thomson, Beever, Harrison, Hill and Osbourn1971) reported that sainfoin-fed animals have higher protein availability than lucerne-fed animals. However, Min et al. (Reference Min, Barry, Attwood and McNabb2003) reported that tannin deactivation in sainfoin can improve amino acid absorption from the small intestine compared with untreated sainfoin. High C and low B3 fractions of CNCPS (309 and 139 g/kg CP, respectively) can be related to high ADF and low difference between NDF and ADF contents, and on the other hand large differences between rumen UDP (617·9 g/kg CP) and digestible undegradable protein (DUP; 0·278) and low metabolizability of CP (0·5) can be related to un-dissociated tannin–protein complexes, which is in accordance with results of CNCPS fractioning. To our knowledge, the present study is the first to report CNCPS protein fractions and MP system components of sainfoin and so no other data were available to authors for comparison of obtained results.
In vitro measurements
The extent and rate of gas production in the present study were lower than Bal et al. (Reference Bal, Ozturk, Aydin, Eral, Ozkan, Ata, Karakas and Karabay2006) attributable to higher ADF and lower CP values that can limit OM digestion and affect in vitro gas production. In the present experiment, ME values (MJ/kg DM) estimated according to reported models were slightly different (7·87, 8·04 and 7·59), and all values were lower than reported values (11·77, 10·92 and 10·18, respectively for vegetative, flowering and late maturity) by Bal et al. (Reference Bal, Ozturk, Aydin, Eral, Ozkan, Ata, Karakas and Karabay2006). In addition, OMD in the present experiment (0·517) is lower than the range of 0·645–0·734 reported by Bal et al. (Reference Bal, Ozturk, Aydin, Eral, Ozkan, Ata, Karakas and Karabay2006) for different growth stages. The higher ADF content in the current experiment can partly explain the lower OM digestibility of sainfoin hay compared with in vivo and in vitro values reported by Aufrère et al. (Reference Aufrère, Dudilieu and Poncet2008) and Bal et al. (Reference Bal, Ozturk, Aydin, Eral, Ozkan, Ata, Karakas and Karabay2006). From information given by Aufrère et al. (Reference Aufrère, Dudilieu, Poncet, Baumont and Dumont2007), CTs seem to be partly responsible for the lower ruminal DM and nitrogen degradabilities of sainfoin found in the current experiment (compared with those of Aufrère et al. (Reference Aufrère, Dudilieu and Poncet2008) and Turgut & Yanar (Reference Turgut and Yanar2004)).
The OM digestibility in Tilley & Terry (Reference Tilley and Terry1963) method was higher than values determined by in vivo and gas production profiles. Mlambo et al. (Reference Mlambo, Mould, Sikosana, Smith, Owen and Mueller-Harvey2008) found higher OM digestibilties, determined by a filtration based method such as Tilley & Terry (Reference Tilley and Terry1963), for high tanniferous materials; this effect was explained by rapid passing of phenols through filter paper that entered the digestible fraction. It was also suggested that this method cannot be used efficiently and precisely for the estimation of ME in high tannin forages. The possible effects of CTs in estimated ME values using filtration based methods can be examined by tannin deactivation or comparison of results with in vivo experiments. No data from other experiments were available for comparison of results. It seems that the in vitro Tilley & Terry (Reference Tilley and Terry1963) digestibility method overestimates OM digestibility of tanniferous forages, according to results of Mlambo et al. (Reference Mlambo, Mould, Sikosana, Smith, Owen and Mueller-Harvey2008). Differences in OM digestibility determined by different methods can be explained by different estimated ME values.
In situ degradability
Low CP degradability can be explained by the formation of tannin–protein complexes that are not available for microbial degradation (Reed Reference Reed1995; Makkar Reference Makkar2003). Tannins extracted from sainfoin can inhibit proteolysis by rumen major proteolitic bacteria (Jones et al. Reference Jones, McAllister, Muir and Cheng1994). This effect can be explained through enzyme deactivation with formation of tannin–enzyme complexes and by toxic effects of tannins on microbes by cell wall destruction, which can prevent bacterial attachment. Lower cell wall degradability can be explained by the formation of tannin complexes with plant cell wall material that can be recovered as ADL (during digestion) and preventing microbial attachment (Bento et al. Reference Bento, Acamovic and Makkar2005). Hobson & Stewart (Reference Hobson and Stewart1997) demonstrated that CTs can prevent microbial cellulase activity and the deactivation of beta endoglucanases. Lower DM and CP degradabilities in the present study, compared with values reported by Turgut & Yanar (Reference Turgut and Yanar2004), can be explained by tannin effects. In addition, it seems that low NDF degradability is the main reason for low DM and OM degradabilities compared with the study of Turgut & Yanar (Reference Turgut and Yanar2004). Values reported by these authors for the soluble fraction (a, g/kg DM), potentially degradable fraction (b, g/kg DM) and fractional degradation rate of b fraction (c, /h) are 385, 434 and 0·054, respectively for DM and 427, 459 and 0·098 for CP. However, there was no information regarding CT concentrations of sainfoin in the study of Turgut & Yanar (Reference Turgut and Yanar2004). The results of the present study show that NDF degradation is related to OM and DM degradation. Aufrère et al. (Reference Aufrère, Dudilieu, Poncet, Baumont and Dumont2007) found that sainfoin CTs can cause significant reduction of nitrogen and protein solubility in vitro; it was also reported that increasing alfalfa proportion in mixture decreased effects of sainfoin CTs on nitrogen solubility; also in addition, drying of sainfoin at 40 and 60°C had the same effects in increasing nitrogen solubility. Aufrère et al. (Reference Aufrère, Dudilieu and Poncet2008) reported 196, 721 g/kg CP for a and b fractions, respectively. Both these values are higher than current values (171 and 459 g/kg CP, respectively). Aufrère et al. (Reference Aufrère, Dudilieu and Poncet2008) also mentioned fractional degradation rate of b fraction (c, /h) as 0·092, higher than 0·04 in the current experiment. These differences can be explained by different growth stage (early flowering v. mid-flowering) and higher CT contents in the current experiment (6 v. 21·3 g/kg DM). Aufrère et al. (Reference Aufrère, Dudilieu and Poncet2008) mentioned that tanniferous sainfoin compared with lucerne greatly increased the in situ estimate of forage N escaping from the rumen but decreased its intestinal digestibility.
There is no other information about degradation characteristics of sainfoin in the literature. Low soluble fraction and low extent of CP degradation can also be explained by high NDIN and ADIN contents.
Palatability and in vivo digestibility
As shown, the PI of sainfoin was 2·74 times higher than for alfalfa, which is in agreement with Scharenberg et al. (Reference Scharenberg, Arrigo, Gutzwiller, Soliva, Wyss, Kreuzer and Dohme2007a), in the case of higher palatability compared with forages with lower CT. The eating rate at the beginning of a meal is considered as a good indicator of appetite and palatability is defined as the result of the physical and chemical characteristics that promote appetite (Baumont Reference Baumont1996). Baumont (Reference Baumont1996) reported that palatability can be determined best when offering the test feed for the first time. According to methods of Scharenberg et al. (Reference Scharenberg, Arrigo, Gutzwiller, Soliva, Wyss, Kreuzer and Dohme2007a) for measuring sainfoin palatability, the PI reported by Ben Salem et al. (Reference Ben Salem, Nefzaoui and Abdouli1994) could be employed in the current experiment. The index had to be altered by measuring only during the first minutes of feeding in comparison with a known control offered alternatively. Some researchers have indicated that high CT concentration can have a negative effect on feed intake, mainly because of reducing palatability (Barry Reference Barry1985; Reed et al. Reference Reed, Soller and Woodward1990; Barry & McNabb Reference Barry and McNabb1999; Min et al. Reference Min, Barry, Attwood and McNabb2003). However, other researchers have not reported this, especially with respect to sainfoin. Parker & Moss (Reference Parker and Moss1981) reported higher palatability for sainfoin than alfalfa in the study with heifers. Some reports indicated higher digestibility for sainfoin hay than alfalfa hay (Aufrère et al. Reference Aufrère, Dudilieu and Poncet2008; Parker & Moss Reference Parker and Moss1981), which could be responsible for higher palatability of sainfoin. Notwithstanding the fact that digestibility of alfalfa was not measured in the current experiment, OM digestibility of sainfoin was similar to reported values (0·596 v. 0·633). The strong preference for sainfoin is unusual because sainfoin is coarse, with a high proportion of stem in comparison with leaves and petioles, with a high amount of CTs. However, higher palatability was reported for sainfoin compared with birdsfoot trefoil (Lotus corniculatus) and chicory (Cichorium intybus), despite the higher CT content of sainfoin (Scharenberg et al. Reference Scharenberg, Arrigo, Gutzwiller, Soliva, Wyss, Kreuzer and Dohme2007a). Sainfoin was reported to have a different monomeric constitution and a higher degree of polymerization than birdsfoot trefoil (Tanner et al. Reference Tanner, Abrahams, Larkin and Brooker1999), which could explain the results of Scharenberg et al. (Reference Scharenberg, Arrigo, Gutzwiller, Soliva, Wyss, Kreuzer and Dohme2007a). Sainfoin intake time decreased with the progress of experiment (palatability increased), similar to the results of Scharenberg et al. (Reference Scharenberg, Arrigo, Gutzwiller, Soliva, Wyss, Kreuzer and Dohme2007a); however, those authors concluded that high CT content in sainfoin, overall, had neither a positive nor a negative influence on feed palatability after the first day. It can be concluded that CT content has limited effect on palatability, while the chemical properties of the CT may be important in this respect.
CONCLUSION
According to the results of the present study, sainfoin has higher palatability than alfalfa, and CTs have no negative effect on palatability. However, low protein digestibility is a result of the formation of tannin–protein complexes that might be indigestible in small intestine. Differences between OM digestibility coefficients and ME concentrations between different estimation methods showed that more care is needed to select one with greater accuracy and more research is needed to do this for tanniferous forages. Sainfoin can effectively replace alfalfa, especially in arid regions. More research is needed to assess the impact of tannins on digestibility.
The authors thank the University of Tehran for funding and the Ministry of Jihad-E-Agriculture for preparation of sainfoin hay.