



%20--%3e%3c!DOCTYPE%20svg%20PUBLIC%20'-//W3C//DTD%20SVG%201.0//EN'%20'http://www.w3.org/TR/2001/REC-SVG-20010904/DTD/svg10.dtd'%3e%3csvg%20version='1.0'%20id='Layer_1'%20xmlns='http://www.w3.org/2000/svg'%20xmlns:xlink='http://www.w3.org/1999/xlink'%20x='0px'%20y='0px'%20width='64px'%20height='64px'%20viewBox='5.5%20-3.5%2064%2064'%20enable-background='new%205.5%20-3.5%2064%2064'%20xml:space='preserve'%3e%3cg%3e%3ccircle%20fill='%23FFFFFF'%20fill-opacity='0'%20cx='37.785'%20cy='28.501'%20r='28.836'/%3e%3cpath%20fill='%23595959'%20d='M37.441-3.5c8.951,0,16.572,3.125,22.857,9.372c3.008,3.009,5.295,6.448,6.857,10.314%20c1.561,3.867,2.344,7.971,2.344,12.314c0,4.381-0.773,8.486-2.314,12.313c-1.543,3.828-3.82,7.21-6.828,10.143%20c-3.123,3.085-6.666,5.448-10.629,7.086c-3.961,1.638-8.057,2.457-12.285,2.457s-8.276-0.808-12.143-2.429%20c-3.866-1.618-7.333-3.961-10.4-7.027c-3.067-3.066-5.4-6.524-7-10.372S5.5,32.767,5.5,28.5c0-4.229,0.809-8.295,2.428-12.2%20c1.619-3.905,3.972-7.4,7.057-10.486C21.08-0.394,28.565-3.5,37.441-3.5z%20M37.557,2.272c-7.314,0-13.467,2.553-18.458,7.657%20c-2.515,2.553-4.448,5.419-5.8,8.6c-1.354,3.181-2.029,6.505-2.029,9.972c0,3.429,0.675,6.734,2.029,9.913%20c1.353,3.183,3.285,6.021,5.8,8.516c2.514,2.496,5.351,4.399,8.515,5.715c3.161,1.314,6.476,1.971,9.943,1.971%20c3.428,0,6.75-0.665,9.973-1.999c3.219-1.335,6.121-3.257,8.713-5.771c4.99-4.876,7.484-10.99,7.484-18.344%20c0-3.543-0.648-6.895-1.943-10.057c-1.293-3.162-3.18-5.98-5.654-8.458C50.984,4.844,44.795,2.272,37.557,2.272z%20M37.156,23.187%20l-4.287,2.229c-0.458-0.951-1.019-1.619-1.685-2c-0.667-0.38-1.286-0.571-1.858-0.571c-2.856,0-4.286,1.885-4.286,5.657%20c0,1.714,0.362,3.084,1.085,4.113c0.724,1.029,1.791,1.544,3.201,1.544c1.867,0,3.181-0.915,3.944-2.743l3.942,2%20c-0.838,1.563-2,2.791-3.486,3.686c-1.484,0.896-3.123,1.343-4.914,1.343c-2.857,0-5.163-0.875-6.915-2.629%20c-1.752-1.752-2.628-4.19-2.628-7.313c0-3.048,0.886-5.466,2.657-7.257c1.771-1.79,4.009-2.686,6.715-2.686%20C32.604,18.558,35.441,20.101,37.156,23.187z%20M55.613,23.187l-4.229,2.229c-0.457-0.951-1.02-1.619-1.686-2%20c-0.668-0.38-1.307-0.571-1.914-0.571c-2.857,0-4.287,1.885-4.287,5.657c0,1.714,0.363,3.084,1.086,4.113%20c0.723,1.029,1.789,1.544,3.201,1.544c1.865,0,3.18-0.915,3.941-2.743l4,2c-0.875,1.563-2.057,2.791-3.541,3.686%20c-1.486,0.896-3.105,1.343-4.857,1.343c-2.896,0-5.209-0.875-6.941-2.629c-1.736-1.752-2.602-4.19-2.602-7.313%20c0-3.048,0.885-5.466,2.658-7.257c1.77-1.79,4.008-2.686,6.713-2.686C51.117,18.558,53.938,20.101,55.613,23.187z'/%3e%3c/g%3e%3c/svg%3e)
%20--%3e%3c!DOCTYPE%20svg%20PUBLIC%20'-//W3C//DTD%20SVG%201.0//EN'%20'http://www.w3.org/TR/2001/REC-SVG-20010904/DTD/svg10.dtd'%3e%3csvg%20version='1.0'%20id='Layer_1'%20xmlns='http://www.w3.org/2000/svg'%20xmlns:xlink='http://www.w3.org/1999/xlink'%20x='0px'%20y='0px'%20width='64px'%20height='64px'%20viewBox='5.5%20-3.5%2064%2064'%20enable-background='new%205.5%20-3.5%2064%2064'%20xml:space='preserve'%3e%3cg%3e%3ccircle%20fill='%23FFFFFF'%20fill-opacity='0'%20cx='37.637'%20cy='28.806'%20r='28.276'/%3e%3cg%3e%3cpath%20fill='%23595959'%20d='M37.443-3.5c8.988,0,16.57,3.085,22.742,9.257C66.393,11.967,69.5,19.548,69.5,28.5c0,8.991-3.049,16.476-9.145,22.456%20C53.879,57.319,46.242,60.5,37.443,60.5c-8.649,0-16.153-3.144-22.514-9.43C8.644,44.784,5.5,37.262,5.5,28.5%20c0-8.761,3.144-16.342,9.429-22.742C21.101-0.415,28.604-3.5,37.443-3.5z%20M37.557,2.272c-7.276,0-13.428,2.553-18.457,7.657%20c-5.22,5.334-7.829,11.525-7.829,18.572c0,7.086,2.59,13.22,7.77,18.398c5.181,5.182,11.352,7.771,18.514,7.771%20c7.123,0,13.334-2.607,18.629-7.828c5.029-4.838,7.543-10.952,7.543-18.343c0-7.276-2.553-13.465-7.656-18.571%20C50.967,4.824,44.795,2.272,37.557,2.272z%20M46.129,20.557v13.085h-3.656v15.542h-9.944V33.643h-3.656V20.557%20c0-0.572,0.2-1.057,0.599-1.457c0.401-0.399,0.887-0.6,1.457-0.6h13.144c0.533,0,1.01,0.2,1.428,0.6%20C45.918,19.5,46.129,19.986,46.129,20.557z%20M33.042,12.329c0-3.008,1.485-4.514,4.458-4.514s4.457,1.504,4.457,4.514%20c0,2.971-1.486,4.457-4.457,4.457S33.042,15.3,33.042,12.329z'/%3e%3c/g%3e%3c/g%3e%3c/svg%3e)
Introduction
Poverty and early-life adversity (e.g., physical and emotional abuse, neglect, household dysfunction) have been consistently linked to morbidity and premature mortality (Grummit et al., Reference Grummitt, Kreski, Kim, Platt, Keyes and McLaughlin2021; Hughes et al., Reference Hughes, Bellis, Hardcastle, Sethi, Butchart, Mikton and Dunne2017). These associations may reflect, in part, early-life adversity and socioeconomic disadvantage-related shifts in the pace of biological maturation or aging, which have been observed across neural, pubertal, and cellular measures (Colich et al., Reference Colich, Rosen, Williams and McLaughlin2020; Miller et al., Reference Miller, López, Buthmann, Garcia and Gotlib2022, Reference Miller, Gluckman, Fortier, Chong, Meaney, Tan and Gotlib2024; Raffington et al., Reference Raffington, Belsky, Kothari, Malanchini, Tucker-Drob and Harden2021; Rakesh et al., Reference Rakesh, Whittle, Sheridan and McLaughlin2023).
There are several influential theoretical frameworks focused on alterations in pace of maturation or aging under different environmental conditions (Belsky, Reference Belsky2019; Callaghan & Tottenham, Reference Callaghan and Tottenham2016; Ellis et al., Reference Ellis, Figueredo, Brumbach and Schlomer2009; Roubinov et al., Reference Roubinov, Meaney and Boyce2021; Tooley et al., Reference Tooley, Bassett and Mackey2021). For example, Life History Theory (Ellis et al., Reference Ellis, Figueredo, Brumbach and Schlomer2009) posits that humans calibrate developmental trajectories along a slow-fast continuum in response to environmental conditions, shaping morphology, physiological function, and behavior to optimize survival and reproduction. In safe, supportive, and well-resourced contexts, a slow developmental strategy characterized by prolonged maturation may be adaptive. Conversely, in harsh environments, faster or delayed developmental strategies may be adaptive depending on the underlying harshness dimensions, but also carry trade-offs in terms of costs to health (Belsky, Reference Belsky2019; Callaghan & Tottenham, Reference Callaghan and Tottenham2016; Ellis et al., Reference Ellis, Figueredo, Brumbach and Schlomer2009; Roubinov et al., Reference Roubinov, Meaney and Boyce2021). It is important to point out, however, that pace of maturation or aging does not appear to be a single process, as different measures of biological aging are often uncorrelated (Belsky et al., Reference Belsky, Moffitt, Cohen, Corcoran, Levine, Prinz and Caspi2018; Belsky, Reference Belsky2019; Miller et al., Reference Miller, Ho, Humphreys, King, Foland-Ross, Colich and Gotlib2020). In addition, poverty and early-life adversity, although frequently co-occurring and often aggregated in research, may show distinct patterns of association with biological aging (Colich et al., Reference Colich, Rosen, Williams and McLaughlin2020; Gur et al., Reference Gur, Moore, Rosen, Barzilay, Roalf, Calkins and Gur2019; Roubinov et al., Reference Roubinov, Meaney and Boyce2021; Vannucci et al., Reference Vannucci, Fields, Hansen, Katz, Kerwin, Tachida and Tottenham2023). Distinguishing these exposures may therefore be important for understanding whether their associations are unique or differ across different measures of biological aging.
One mechanism through which poverty and early-life adversity become biologically embedded is through epigenetic modification, including changes in DNA methylation (DNAm). Epigenetic aging represents one downstream consequence of this process, providing a potential marker of calibration to environmental conditions by quantifying the discrepancy between biological and chronological age at the cellular level. This discrepancy is thought to indicate whether an individual appears biologically older or younger than expected for their chronological age. Epigenetic clock measures are derived from DNAm profiles and estimate epigenetic age based on methylation patterns at specific cytosine-phosphate-guanine (CpG) sites in the genome, either to predict chronological age or age-related phenotypes (e.g., physiological markers, mortality risk). The number and subset of these CpG sites vary depending on the specific clock measure (Bell et al., Reference Bell, Lowe, Adams, Baccarelli, Beck, Bell and Rakyan2019; Faul et al., Reference Faul, Kim, Levine, Thyagarajan, Weir and Crimmins2023; López-Otín et al., Reference López-Otín, Blasco, Partridge, Serrano and Kroemer2013; Jones et al., Reference Jones, Goodman and Kobor2015). In interpreting these clocks, it is important to distinguish between aging and development. Within geroscience, aging is understood as the progressive loss of integrity and function in cells, tissues, and organs due to the accumulation of molecular damage and declining repair capacity (López-Otín et al., Reference López-Otín, Blasco, Partridge, Serrano and Kroemer2013). Development, by contrast, refers to changes in biological and behavioral systems that characterize growth, maturation, and, in psychology, the acquisition and refinement of competencies. This distinction is reflected in the design and interpretation of different epigenetic clocks: some clocks primarily capture health-relevant aspects of biological aging, whereas others are designed to index developmental timing or chronological age.
Most early research relied on the Hannum blood-based clock and the pan-tissue Horvath clock, both trained on chronological age (Hannum et al., Reference Hannum, Guinney, Zhao, Zhang, Hughes, Sadda and Zhang2013; Horvath, Reference Horvath2013). These first-generation clocks, while highly accurate across tissues and age ranges in adults, have generally shown low correlation with clinical features and limited ability to predict health outcomes (Horvath & Raj, Reference Horvath and Raj2018). Their applicability may be particularly limited in children and adolescents, as DNAm is more dynamic during early life, making age inference less precise (McEwen et al., Reference McEwen, O’Donnell, McGill, Edgar, Jones, MacIsaac and Kobor2020). To overcome this limitation, pediatric-specific clocks have been developed, such as the Pediatric-Buccal-Epigenetic (PedBE) clock, which uses buccal DNAm from individuals aged 0–20 years to characterize age-related variation in pediatric samples more accurately (McEwen et al., Reference McEwen, O’Donnell, McGill, Edgar, Jones, MacIsaac and Kobor2020). Beyond these chronological-age-trained clocks, other measures have been developed to capture morbidity and mortality risk rather than purely chronological age. DNAm PhenoAge estimates biological age from DNAm patterns that proxy multiple clinical biomarkers; PhenoAge is associated with 10- and 20-year mortality risk and behavioral and lifestyle factors (Levine et al., Reference Levine, Lu, Quach, Chen, Assimes, Bandinelli and Horvath2018). GrimAge combines DNAm-based estimates of seven plasma proteins with cumulative smoking exposure, and predicts morbidity and mortality (Lu et al., Reference Lu, Quach, Wilson, Reiner, Aviv, Raj and Horvath2019). DunedinPACE (formerly DunedinPoAm) takes a different approach by estimating the pace of biological aging over time and is designed to reflect the rate at which aging-related physiological changes accumulate (Belsky et al., Reference Belsky, Caspi, Corcoran, Sugden, Poulton, Arseneault and Moffitt2022). Critically, these clocks differ not only in the tissue and population used for their development, but also in the strength of evidence supporting their validity as indices of health-relevant biological aging. GrimAge and DunedinPACE, and to a somewhat lesser extent PhenoAge, have been repeatedly shown to predict morbidity, mortality, and health span in adults, and have demonstrated sensitivity to social and environmental adversity across both adult and pediatric samples (Belsky et al., Reference Belsky, Caspi, Corcoran, Sugden, Poulton, Arseneault and Moffitt2022; Lu et al., Reference Lu, Quach, Wilson, Reiner, Aviv, Raj and Horvath2019; Raffington et al., Reference Raffington, Belsky, Kothari, Malanchini, Tucker-Drob and Harden2021). By contrast, first-generation clocks trained to predict chronological age rather than health outcomes show less evidence of association with clinical outcomes or social exposures (Horvath & Raj, Reference Horvath and Raj2018). The PedBE clock, though specifically developed and validated for pediatric buccal tissue and therefore offering better developmental and tissue fit than the adult-blood-derived clocks (McEwen et al., Reference McEwen, O’Donnell, McGill, Edgar, Jones, MacIsaac and Kobor2020), has also not accumulated the same degree of evidence for health and mortality prediction as clocks such as GrimAge and DunedinPACE. Accordingly, differences across clocks should not necessarily be interpreted as inconsistent estimates of a single underlying aging process.
A growing body of research has demonstrated that early-life adversity and poverty are associated with epigenetic clock measures, but the findings have been mixed. Several studies have shown that exposure to early-life adversity is associated with accelerated epigenetic aging across multiple clocks (e.g., Jovanovic et al., Reference Jovanovic, Vance, Cross, Knight, Kilaru, Michopoulos and Smith2017; Lawn et al., Reference Lawn, Anderson, Suderman, Simpkin, Gaunt, Teschendorff and Howe2018; Marini et al., Reference Marini, Davis, Soare, Zhu, Suderman, Simpkin and Dunn2020; Sumner et al., Reference Sumner, Colich, Uddin, Armstrong and McLaughlin2019; Tang et al., Reference Tang, Howe, Suderman, Relton, Crawford and Houtepen2020). Early life poverty, independent of current socioeconomic circumstances, has also been associated with accelerated epigenetic aging (Austin et al., Reference Austin, Chen, Ross, McEwen, Maclsaac, Kobor and Miller2018). One interpretation is that accelerated aging is related to increased allostatic load, or cumulative physiological wear, in the context of early-life adversity and poverty. However, some recent findings are inconsistent with this interpretation. Several studies have reported epigenetic age deceleration among individuals exposed to early-life adversity (Meier et al., Reference Meier, Kantelhardt, Gurri, Stadler, Schmid, Clemens and Unternaehrer2024; Rampersaud et al., Reference Rampersaud, Protsenko, Yang, Reus, Hammamieh, Wu and Wolkowitz2022), and others have not found statistically significant associations (Etzel et al., Reference Etzel, Hastings, Hall, Heim, Meaney, Noll and Shalev2022; Lim et al., Reference Lim, Nzegwu and Wright2022). These inconsistencies may stem from various methodological differences; the choice of epigenetic clock, with its distinct algorithm and targeted CpG sites, as well as the age of participants and the type of biological tissue sampled (e.g., blood or buccal cells), could influence the accuracy and relevance of epigenetic age estimates in relation to environmental risk factors (Heijmans & Mill, Reference Heijmans and Mill2012). Importantly, these methodological differences also reflect a deeper conceptual distinction between aging and development. Although distinct, these processes are not mutually exclusive: environmental exposures such as poverty and adversity may influence both the pace of developmental maturation and health-relevant biological aging, and different epigenetic clocks may capture different aspects of this overlap.
The Future of Families and Child Wellbeing Study (FFCWS) has provided a useful resource for examining associations between socioeconomic disadvantage, adversity, and epigenetic clocks (e.g., Chang et al., Reference Chang, Meier, Maguire-Jack, Davis-Kean and Mitchell2024; Hogan et al., Reference Hogan, Merrill, Valencia, McHayle, Sisitsky, McDermott and Parent2025; Martz et al., Reference Martz, Benner, Goosby, Mitchell and Gaydosh2024; Metrailer et al., 2026). Prior FFCWS studies have examined poverty or adversity in different ways, with some analyses focusing primarily on one of these exposures. For example, across a series of analyses, Assari and colleagues (Reference Assari, Dezfuli, Peyrovinasab and Zare2024a, Reference Assari and Zare2024b, Reference Assari and Zare2024c) found poverty at birth to be associated with accelerated epigenetic aging at age 15 as indexed by GrimAge. These analyses adjusted for several family and demographic characteristics but did not account for early-life adversity. Other FFCWS analyses examining adversity and epigenetic clocks have controlled for poverty while focusing on specific types or dimensions of adversity (Chang et al., Reference Chang, Meier, Maguire-Jack, Davis-Kean and Mitchell2024; DiMarzio et al., Reference DiMarzio, Rojo-Wissar, Hernandez Valencia, Ver Pault, Denherder, Lopez and Parent2025; Hogan et al., Reference Hogan, Merrill, Valencia, McHayle, Sisitsky, McDermott and Parent2025). Taken together, prior FFCWS studies have generally not examined poverty and broad early-life adversity as distinct, focal predictors of epigenetic aging. Poverty and adversity (e.g., neglect, physical abuse), although correlated, are separate aspects of children’s environments (Masarik & Conger, Reference Masarik and Conger2017; Rakesh et al., Reference Rakesh, Whittle, Sheridan and McLaughlin2023) and exhibit unique, and in some cases, opposite associations with developmental and aging-related outcomes (Gur et al., Reference Gur, Moore, Rosen, Barzilay, Roalf, Calkins and Gur2019; Roubinov et al., Reference Roubinov, Meaney and Boyce2021; Vannucci et al., Reference Vannucci, Fields, Hansen, Katz, Kerwin, Tachida and Tottenham2023). Examining poverty and broad early-life adversity as separate predictors may therefore help clarify whether their associations are shared, unique, or potentially divergent across different epigenetic clocks.
Prior studies in both FFCWS and the broader literature have largely emphasized risk factors in relation to biological aging. Far less attention has been given to positive developmental capacities that may either offset these effects or be disrupted by poverty or adversity and thereby serve as a potential mediator. The development of social competence, for example, may serve as a resilience factor implicated in healthier aging given well-documented associations with personal well-being (Hastings, Reference Hastings, Bornstein and Shah2025; Kubzansky et al., Reference Kubzansky, Kim, Boehm, Davidson, Huffman, Loucks and Moskowitz2023; Layous et al., Reference Layous, Nelson, Oberle, Schonert-Reichl and Lyubomirsky2012). Social competence encompasses a range of capacities, including empathy, prosocial behavior, communication, and emotional regulation, which are essential for successfully navigating social interactions and forming and maintaining supportive interpersonal relationships (Cacioppo, Reference Cacioppo2002; Segrin & Taylor, Reference Segrin and Taylor2007). Salubrious effects of social competence may be related to stronger social support networks (Ong et al., Reference Ong, Dejonckheere and Ram2025), but some research suggests that certain social competencies, such as prosociality, are intrinsically tied to healthier physiological functioning and positive emotions (Aknin et al., Reference Aknin, Dunn and Norton2012; Miller et al., Reference Miller, Kahle and Hastings2015). A small body of research has specifically examined positive social attributes and experiences in relation to epigenetic aging. For example, youth who are more prone to prosocial emotions like empathy and compassion tend to show slower epigenetic aging on the GrimAge (Espinoza et al., Reference Espinoza, Goering, Dahlman, Patki, Tiwari, Richter and Mrug2025; Goering et al., Reference Goering, Moore, Barker-Kamps, Patki, Tiwari and Mrug2025) and PhenoAge clocks (Dobewall et al., Reference Dobewall, Keltikangas-Järvinen, Marttila, Mishra, Saarinen, Cloninger and Hintsanen2023). However, most research in this area has focused on adults and, to our knowledge, has not considered the development of social competencies across childhood. Early social competencies may be a particularly important resilience factor in the context of early-life adversity and socioeconomic disadvantage (Armstrong-Carter et al., Reference Armstrong-Carter, Miller, Hill and Domingue2021; Mastromatteo et al., Reference Mastromatteo, Helm and Miller2025). At the same time, the development of these competencies may also be related to poverty and early-life adversity (Kahhale et al., Reference Kahhale, Byrd and Hanson2025; Malti & Speidel, Reference Malti and Speidel2024). Thus, disrupted social development may play a role in compounding or mediating the effects of environmental risk on pace of maturation or aging. Epigenetic aging studies have yet to test these possibilities.
The present study aimed to build on prior FFCWS research by testing and comparing poverty, early-life adversity, and the development of social competencies in relation to epigenetic aging in late childhood across different epigenetic clock measures. First, we examined poverty at birth and early-life adversity at age 3 as prospective predictors to clarify their potentially unique associations with epigenetic clock measures at age 9. Stress acceleration perspectives predict that poverty and early-life adversity would be associated with high epigenetic clock scores (Belsky, Reference Belsky2019), whereas other theoretical models posit that pace may be accelerated or decelerated depending on the nature of the exposure (Roubinov et al., Reference Roubinov, Meaney and Boyce2021). We therefore examined whether poverty and early-life adversity associations were consistent with these prevailing theoretical frameworks. Second, we used data-driven analyses to identify clusters of social skills trajectories across childhood and then tested whether different patterns of social development were associated with epigenetic clock measures. Given evidence linking social competence with reduced morbidity (Hastings, Reference Hastings, Bornstein and Shah2025; Kubzansky et al., Reference Kubzansky, Kim, Boehm, Davidson, Huffman, Loucks and Moskowitz2023), we expected clusters characterized by increased social competencies across childhood to show associations with epigenetic measures that were opposite to early-life adversity and poverty effects. We also identified clusters of psychopathology symptom trajectories to test the specificity of associations with social skills. Third, we examined whether social skills statistically mediated the associations of poverty and early-life adversity with epigenetic aging. Given that poverty and adversity have each been independently linked to disruptions in children’s social–emotional development (Kahhale et al., Reference Kahhale, Byrd and Hanson2025; Malti & Speidel, Reference Malti and Speidel2024), we tested these pathways both separately and simultaneously to determine whether disrupted social skills may represent a mechanism specific to poverty, specific to adversity, or common to both environmental risk factors. Lastly, we examined whether the findings at age 9 were evident using epigenetic measures assessed at age 15.
Method
Participants
Data used in the present analyses were drawn from the FFCWS, a longitudinal birth cohort study tracking children born in 20 major U.S. cities between 1998 and 2000. The original FFCWS sample included 4,898 families (Reichman et al., Reference Reichman, Teitler, Garfinkel and McLanahan2001). The study oversampled nonmarital births at a 3:1 ratio compared to marital births to better understand “fragile families” in the U.S. Mothers and, when applicable, fathers were interviewed within 48 hours of birth, typically in the hospital. Follow-up assessments were conducted through in-person or telephone interviews when the child was approximately 1, 3, 5, 9, and 15 years of age. A detailed description of the sample and study design is provided by Reichman and colleagues (Reference Reichman, Teitler, Garfinkel and McLanahan2001).
For our analyses, we used baseline data (i.e., at childbirth) to assess child sex, maternal educational attainment, and poverty-to-income ratio. Exposure to early life adversity was measured using primary caregiver reports at the age 3 assessment. Social skills were measured using primary caregiver reports at ages 3, 5, and 9. Epigenetic age acceleration was assessed at age 9. For sensitivity analyses, we used the age 15 epigenetic data to test whether findings replicated in adolescence.
For the present analyses, the final analytical sample varied depending on the specific analysis due to missing data across waves and measures. To conduct the cluster analysis on social skills, we included participants who had complete observations at ages 3, 5, and 9, resulting in a final sample of 1,899 participants. Children included in the cluster analysis did not differ from those who were missing or who had incomplete social competencies data in terms of sex and all epigenetic measures (all ps > .07). Families who were included in the cluster analysis (i.e., those with complete social competencies data) had higher maternal education (t = −5.66, p < .001) and higher income (t = −3.38, p < .001). Further, 211 participants were excluded due to missing data on adversity; this led to a sample of 1,688 participants for analyses focused on testing the effect of exposure to adversity at age 3 on social skills cluster membership.
For our analysis focused on examining the unique effects of social skills cluster membership, psychopathology cluster membership, early adversity exposure, and poverty on epigenetic clock measures at age 9 (and replication at age 15 in sensitivity analyses), we excluded participants with incomplete data, leading to 863 participants for this analysis. Compared to families excluded from this analysis (N = 4,035), those included in the final analytic sample had significantly higher maternal education at baseline (M = 2.17, SD = 0.82 vs. M = 1.97, SD = 0.83; p < .001) and significantly lower poverty scores at baseline (M = 2.71, SD = 1.41 vs. M = 3.00, SD = 1.40; p < .001). Included versus excluded participants did not differ on sex (p = .602).
Measures
Adversity exposure at age 3
Adopting a cumulative risk approach, we assessed five categories of childhood adversity at age 3: physical neglect, emotional abuse, physical abuse, parental involvement with the criminal justice system, and maternal substance abuse. To measure physical abuse, physical neglect, and emotional abuse, mothers completed the Parent–Child Conflict Tactics Scale (CTS-PC; Straus et al., Reference Straus, Hamby, Finkelhor, Moore and Runyan1998). Each CTS-PC item was rated on a scale: (0) never happened, (1) once, (2) twice, (3–5 times), (4) 6–10 times, (5) 11–20 times, (6) more than 20 times, (7) Yes, but not in the past year. Following Sosnowski et al. (Reference Sosnowski, Musci and Johnson2021), responses ranging from 3 to 6 were coded as 1, while all others were coded as 0. Parental involvement with the criminal justice system was assessed through two dichotomous items, asking mothers whether they had ever been booked or charged with breaking the law and whether the biological father had spent time in jail. Maternal substance abuse was measured using nine dichotomous questions regarding the use of various substances, including sedatives, tranquilizers, amphetamines, analgesics, inhalants, marijuana, cocaine, LSD, and heroin. For each adversity category at age 3, item responses were scaled and summed to create indicators of exposure. A detailed list of items for each adversity type is available in the Supplement (Table S1).
Income-to-poverty ratio
The income-to-poverty ratio was calculated as total household income divided by the official U.S. Census poverty threshold, which varies by year and household composition (i.e., number of adults and children). Thresholds from the prior year were used for each interview year. Primary caregivers (PCGs) reported household income either as an exact amount or within a range (e.g., $10,000–$15,000). For responses provided as a range – or an amount within a bracket – dollar values were imputed to obtain a more complete measure of household income. If income was not reported in either form, it was imputed using Stata’s regression-based impute command, with covariates including city, age, education, race/ethnicity, earnings, immigrant status, employment in the past year, hours worked, number of adults in the household, welfare receipt, and marital status. For non-biological PCGs, race/ethnicity, immigrant status, and marital status were set to missing. In the present study, we recoded this variable so that higher scores indicate greater poverty at baseline (i.e., lower socioeconomic status) and lower scores indicate higher SES.
Social skills
At ages 3, 5, and 9, PCGs completed six items from the Adaptive Social Behavior Inventory (ASBI; Hogan et al., Reference Hogan, Scott and Bauer1992) to assess children’s social skills. Caregivers rated each item on a 3-point scale ranging from 1 (“Not true”) to 3 (“Very true or often true”) indicating how true each statement was for their child (e.g., “He/She understands others’ feelings, like when they are happy, sad or mad.” and “He/She is sympathetic toward other children’s distress, tries to comfort others when they are upset”). To ensure consistency and comparability across time points, we selected only the six items that were administered at all three waves. This approach allowed us to construct a coherent measure of social skills and to track changes over time. Each item was recoded to match the original ASBI scoring system (0–2), and the resulting scores were averaged to generate a composite index of social skills at each time point.
Psychopathology symptoms
We included children’s psychopathology symptoms at ages 3, 5, and 9 using the Child Behavior Checklist 2/3 (CBCL; Achenbach, Reference Achenbach1992), based on primary caregiver reports. Caregivers rated each item on a 3-point scale indicating whether the statement was not true (0), somewhat or sometimes true (1), or very true or often true (2) of their child. The CBCL subscales included Social Withdrawal (e.g., “Child avoids looking others in the eye”), Anxiety/Depression (e.g., “Child’s feelings are easily hurt”), Delinquent Behavior (available from age 5 onward, e.g., “Child sets fires”), and Aggressive Behavior (e.g., “Child is defiant”). At each time point, subscale scores were calculated and then standardized (z-scores). The standardized subscale scores were subsequently averaged to create an overall index of children’s psychopathology at ages 3, 5, and 9, respectively.
Epigenetic clocks
Saliva samples were collected at the age 9- and 15-year assessments (Oragene DNA Self-Collection kits; DNA Genotek), and available samples were assayed using methylation arrays (Illumina Infinium HumanMethylation450K or the Illumina Infinium Methylation EPIC arrays). Further details about the collection and processing of these saliva samples are available on the FFCWS portal (https://ffcws.princeton.edu). We focused our analyses on a set of widely used epigenetic clocks that capture different dimensions of biological aging. Specifically, we included four age-trained clocks: the Horvath’s Skin & Blood clock (Horvath et al., Reference Horvath, Oshima, Martin, Lu, Quach, Cohen and Raj2018), the Hannum Blood-based clock (Hannum et al., Reference Hannum, Guinney, Zhao, Zhang, Hughes, Sadda and Zhang2013), Horvath pan-tissue clock (Horvath et al., Reference Horvath2013), a cross-tissue age predictor, and the Pediatric-Buccal-Epigenetic (PedBE) clock (McEwen et al., Reference McEwen, O’Donnell, McGill, Edgar, Jones, MacIsaac and Kobor2020), a buccal tissue–based predictor specifically validated for children. We also considered two health-related second-generation clocks: GrimAge (Lu et al., Reference Lu, Quach, Wilson, Reiner, Aviv, Raj and Horvath2019) and PhenoAge (Levine et al., Reference Levine, Lu, Quach, Chen, Assimes, Bandinelli and Horvath2018), and DunedinPACE (formerly PoAm45; Belsky et al., Reference Belsky, Caspi, Corcoran, Sugden, Poulton, Arseneault and Moffitt2022), a third-generation pace-of-aging measure.
Epigenetic age measures at age 9 were winsorized at the 5th and 95th percentiles to reduce the influence of extreme outliers using the Winsorize function from the DescTools package in R. Winsorization is a common data transformation technique used to limit the impact of potentially spurious or extreme values, which may arise due to technical variability or measurement error, particularly in biological data such as DNAm.
In addition, for each clock expressed in age units, we calculated an age-gap measure as the difference between the clock-estimated age and chronological age at the corresponding assessment. To account for cellular heterogeneity in saliva, age-gap measures were residualized against the estimated epithelial-cell proportion obtained from the FFCWS saliva methylation data. Specifically, for each clock, we fit a linear regression model in which the age gap was regressed on the estimated epithelial-cell proportion. The residuals from these models were then standardized within the analytic sample using the sample-specific mean and standard deviation. Positive values indicate relatively older epigenetic age after accounting for chronological age and epithelial-cell proportion, whereas negative values indicate relatively younger epigenetic age. DunedinPACE was treated separately because it is a pace-of-aging measure rather than an age estimate expressed in years. Its score was therefore not converted into an age gap by subtracting chronological age. Instead, DunedinPACE was residualized against epithelial-cell proportion and standardized using the same procedure. These standardized residuals were used as the primary clock outcomes in subsequent regression analyses, allowing effect sizes to be compared across clocks with different original scales.
Covariates
We controlled for child sex at birth (male = 0, female = 1) and mother’s education at baseline assessment. We recoded maternal education into three categories: “less than high school” (reference level), “high school or equivalent,” and “greater than high school.” In the model with epigenetic data as the outcome, we also controlled for chronological age at the time of biospecimen collection.
Analytical plan
We conducted all analyses in R Studio version 4.2.0 (R Core Team, Reference Core Team2022). We used k-means clustering to identify patterns of social skills development across ages 3, 5, and 9. Specifically, we employed the kml package to perform clustering based on the trajectories of social skills. We tested solutions ranging from 2 to 6 clusters and selected the optimal number of clusters based on the Calinski–Harabasz Index (Caliński & Harabasz, Reference Caliński and Harabasz1974), a proximity metric defined as the ratio of between-cluster variance to within-cluster variance. The optimal solution corresponds to the highest value of this index. Using the same procedure, we also identified trajectories of psychopathology symptoms across ages 3, 5, and 9. Psychopathology clusters were derived using the kml package, testing solutions ranging from 2 to 6 clusters and selecting the optimal solution based on the Calinski–Harabasz Index. As the kml algorithm requires data from at least three time points to estimate trajectories, children with missing social skills or psychopathology data at any of the assessments were excluded from the clustering analysis.
After identifying clusters of social competence development and clusters of psychopathology symptom development, we conducted descriptive statistics and zero-order correlations among all study variables. We then tested two models for our primary analyses. First, we ran linear regression models to test whether exposure to poverty, adversity, social skills clusters, and psychopathology clusters were associated with epigenetic age measures at age 9. Cluster membership variables were entered as categorical predictors in the regression models and were dummy-coded, with the most adaptive (or highest-functioning) trajectory group serving as the reference category. Epigenetic age outcomes were analyzed separately for each epigenetic clock. All predictors were entered simultaneously to estimate their unique associations with epigenetic age while adjusting for the other predictors and covariates. As a sensitivity analysis, we repeated these models by replacing the cumulative adversity score with individual adversity indicators assessed at age 3 (i.e., physical neglect, emotional abuse, physical abuse, parental incarceration, and maternal substance use) to determine whether specific forms of adversity differentially predicted social skills cluster membership. In a supplemental analysis, we tested whether findings for epigenetic age measures at age 9 replicated for measures at age 15. Second, we conducted a generalized linear regression to examine whether exposure to adversity and poverty were associated with membership in distinct social skills trajectory clusters (e.g., high vs. low social skills across ages 3, 5, and 9), adjusting for covariates.
Next, when epigenetic clock measures showed associations with both environmental risks and social development, we conducted a series of path analyses testing whether social skills cluster membership mediated the associations between early adversity, poverty, and epigenetic aging. These path analysis mediation models were conducted using the lavaan package in R (Rosseel, Reference Rosseel2012). Models were estimated using full-information maximum likelihood to handle missing data, allowing all participants with complete social skills cluster data to be retained in the analytic sample, regardless of missingness on other model variables. We first tested adversity exposure at age 3 and poverty at baseline as separate predictors of epigenetic age, with social skills cluster membership modeled as the mediating variable. We then estimated a simultaneous mediation model including both adversity and poverty as predictors of social skills cluster membership and epigenetic age, to examine whether each predictor retained a unique indirect effect when accounting for shared variance between poverty and adversity. Finally, we estimated a fully adjusted model that additionally included relevant covariates to test whether the direct and indirect effects of poverty and adversity on epigenetic age remained robust after accounting for these covariates. In the fully adjusted models, covariances were specified between cumulative adversity and poverty, maternal education and cumulative adversity, and maternal education and poverty. As a sensitivity analysis, we re-estimated all four mediation models using a bootstrapped resampling approach (N = 1,000) to obtain more robust standard errors and confidence intervals for indirect effects, given the binary nature of the mediator; full results are reported in the Supplement. In a further supplemental analysis, we tested whether the pattern of findings replicated when epigenetic age was assessed at age 15 instead of age 9.
Results
K-means analysis for social skills
A cluster analysis was performed to evaluate different patterns of social skills development over the course of childhood (age 3, 5 and 9). Based on the Calinski–Harabasz criterion to determine the number of clusters, the best partition for the cluster analysis was a two-cluster solution (for more details, see Figure 1).
Trajectories of social skills.
Note: The bold lines represent mean trends for each cluster.

Figure 1. Long description
A line graph showing social skills on the vertical axis and Time on the horizontal axis, with assessments at Age 3, Age 5, and Age 9. The horizontal axis is Time, with Age 3, Age 5, and Age 9; the vertical axis is Social Skills. Faint semi-transparent lines represent individual children’s trajectories. Bold colored lines represent the mean trajectory for each cluster. The High Social Skills cluster is shown by the salmon line, which is the upper line at all three assessments. The Low Social Skills cluster is shown by the teal line, which is the lower line at all assessments. The High Social Skills cluster remains relatively stable, whereas the Low Social Skills cluster is stable from Age 3 to Age 5 and declines markedly by Age 9
Of the 1,899 children included in the cluster analysis, 62.6% of children were assigned to cluster A, characterized by higher social skills across time (“high social skills group”). The other 37.4% of children were assigned to cluster B, characterized by lower social skills across time (“low social skills group”). The two clusters differed significantly in levels of social skills at each assessment wave (ages 3, 5, and 9), with the high social skills cluster consistently exhibiting higher scores than the lower social skills cluster. The clusters also showed distinct average trajectories of social skills. In the high social skills cluster, social skills increased from age 3 to 5 (t = 3.94, p < .001, d = 0.13, 95% CI [0.07, 0.23]) before declining from age 5 to 9 (t = −4.60, p < .001, d = −0.19, 95% CI [−0.27, −0.11]). In contrast, the low social skills cluster showed stable levels from age 3 to 5 (p = .347), followed by a strong decrease from ages 5 to age 9 (t = −28.77, p < .001, d = −1.59, 95% CI [−1.47, −1.71]).
K-means analysis for psychopathology symptoms
A cluster analysis was performed to evaluate different patterns of psychopathology symptoms over the course of childhood (age 3, 5 and 9). Based on the Calinski–Harabasz criterion to determine the number of clusters, the best partition for the cluster analysis was a two-cluster solution (for more details, see Figure 2).
Trajectories of psychopathology symptoms.
Note: The bold lines represent mean trends for each cluster.

Figure 2. Long description
A line graph showing psychopathology scores on the vertical axis and Time on the horizontal axis, with assessments at Age 3, Age 5, and Age 9. The horizontal axis is Time, with Age 3, Age 5, and Age 9; the vertical axis is Psychopathology. Faint semi-transparent lines represent individual children’s trajectories. Bold colored lines represent the mean trajectory for each cluster. The Low Psychopathology cluster is shown by the salmon line, which is the lower line at all assessments. The High Psychopathology cluster is shown by the teal line, which is the upper line at all assessments. Thus, the low-symptom cluster remains below zero with a small increase at Age 9, whereas the high-symptom cluster remains above zero and is relatively stable across childhood.
Of the 1,337 children included in the cluster analysis, 67.3% of children were assigned to cluster A, characterized by low levels of psychopathology across time (“low psychopathology group”). The other 32.7% of children were assigned to cluster B, characterized by higher levels of psychopathology across time (“high psychopathology group”). The two clusters differed significantly in levels of psychopathology symptoms at each assessment wave (ages 3, 5, and 9), with the high psychopathology cluster consistently showing higher scores across time. The clusters also showed distinct average trajectories of symptoms. In the low psychopathology group, symptoms were stable from age 3 to 5 (p = .221) before slightly increasing at age 9 (t = 3.32, p = .001 d = 0.14, 95% CI [0.06, 0.22]). In contrast, the high psychopathology group showed stable and high symptom levels across all ages (all ps > .398).
Descriptive statistics and correlations
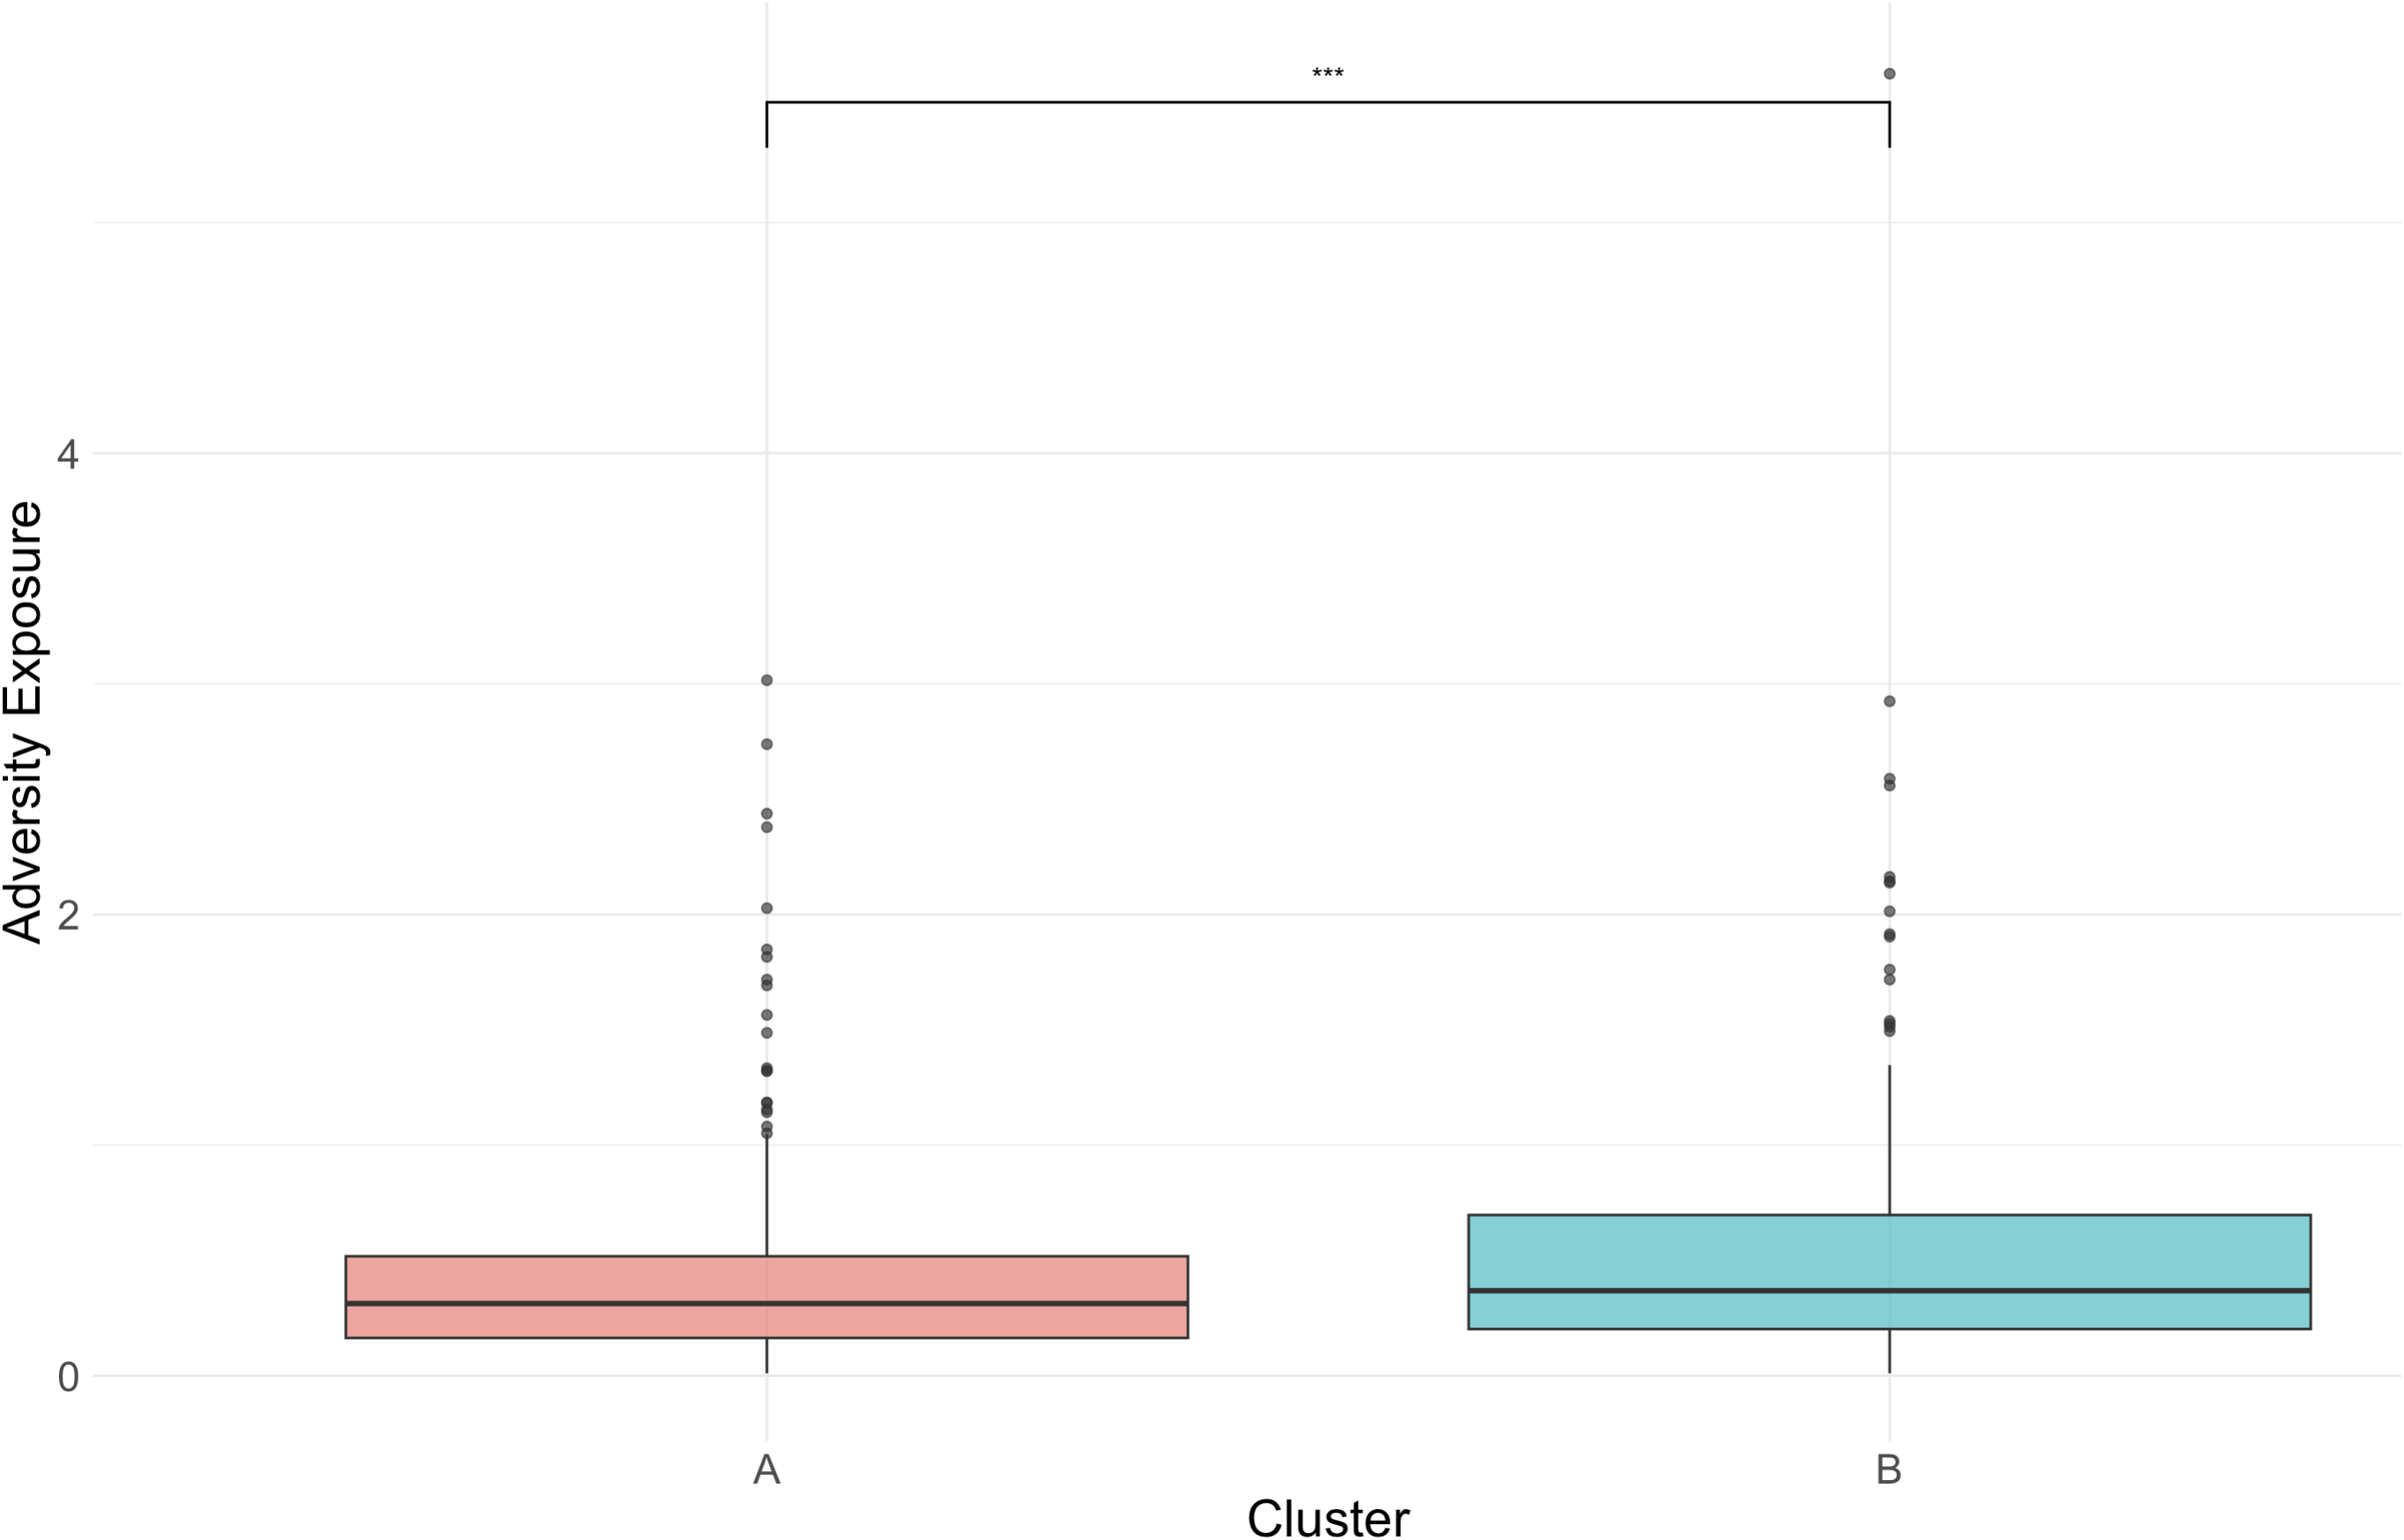
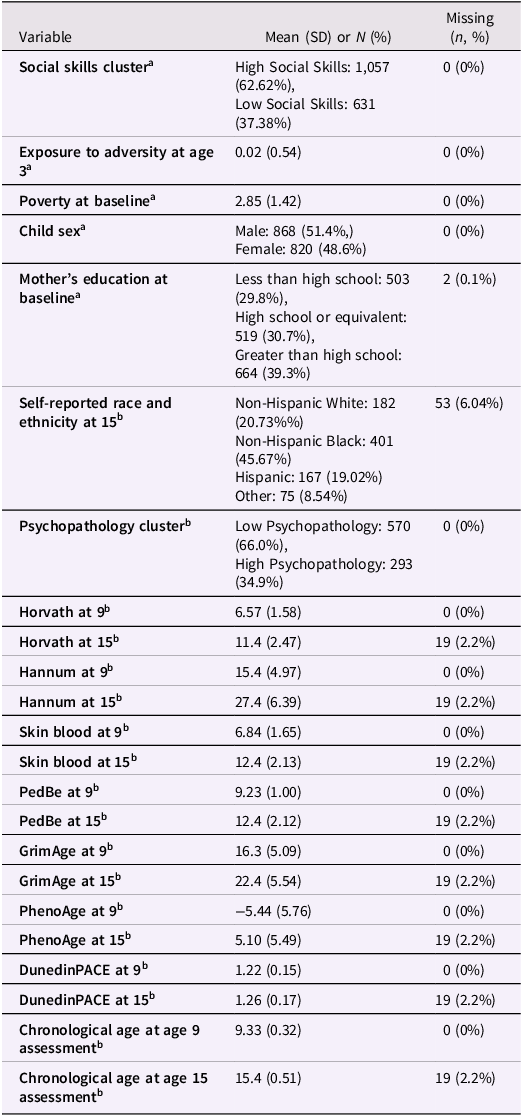
Descriptive statistics, including frequencies (percentages) and means (standard deviations), are reported in Table 1. Figure 3 and Figure 4 illustrate the differences between clusters in adversity exposure at age 3 and in epigenetic aging measures at ages 9, respectively. Table S2 presents the descriptive analysis of the cohort, stratified by cluster.
Box plots depicting cluster differences in adversity exposure at age 3.
Note: A = High Social Skills; B = Low Social Skills; *** p < .001.

Figure 3. Long description
A box plot compares Adversity Exposure at Age 3 between two social skills clusters. The horizontal axis shows Cluster A on the left and Cluster B on the right; the vertical axis shows Adversity Exposure. Cluster A is represented by the salmon box plot on the left and corresponds to the High Social Skills cluster. Cluster B is represented by the teal box plot on the right and corresponds to the Low Social Skills cluster. Both clusters have low median adversity exposure, but the median and upper distribution are higher for Cluster B than Cluster A. A horizontal bracket above the boxes, marked with three asterisks, indicates a statistically significant difference between clusters, p <.001. Several high-value outliers are visible in both clusters.
Box plots depicting cluster differences in epigenetic aging measures at age 9.
Note: A = High Social Skills; B = Low Social Skills; ** p < .01; * p < .05.

Figure 4. Long description
A seven-panel figure of box plots compares epigenetic aging measures at Age 9 between social skills clusters. The panels are arranged from left to right across the top row as Horvath, Hannum, Skin Blood, and PedBE, and across the bottom row as GrimAge, PhenoAge, and DunedinPACE. In each panel, Cluster A is the salmon box plot on the left and corresponds to the High Social Skills cluster; Cluster B is the teal box plot on the right and corresponds to the Low Social Skills cluster. The Horvath, Hannum, PedBE, PhenoAge, and DunedinPACE panels show broadly overlapping distributions for the two clusters. In the Skin Blood panel, the salmon Cluster A box plot is higher than the teal Cluster B box plot; a bracket marked with one asterisk indicates a statistically significant difference, p < .05. In the GrimAge panel, the teal Cluster B box plot is higher than the salmon Cluster A box plot; a bracket marked with two asterisks indicates a statistically significant difference, p<.01.
Descriptive statistics

Table 1. Long description
A table with 23 rows and 3 columns. The columns are labelled “Variable,” “Mean (SD) or N (%),” and “Missing (n, %).” The table reports descriptive statistics for social skills and psychopathology cluster membership, adversity exposure at age 3, poverty at baseline, child sex, maternal education, self-reported race and ethnicity at age 15, seven epigenetic aging measures at ages 9 and 15, and chronological age at the age-9 and age-15 assessments. Variables labelled with superscript “a” are based on the full analytic sample of N = 1,688; variables labelled with superscript “b” are based on the epigenetic-data subsample of N = 863. Categorical variables are reported as frequencies and percentages, whereas continuous variables are reported as means and standard deviations. The final column reports the number and percentage of missing observations for each variable.
Note: a N = 1688; b N = 863.
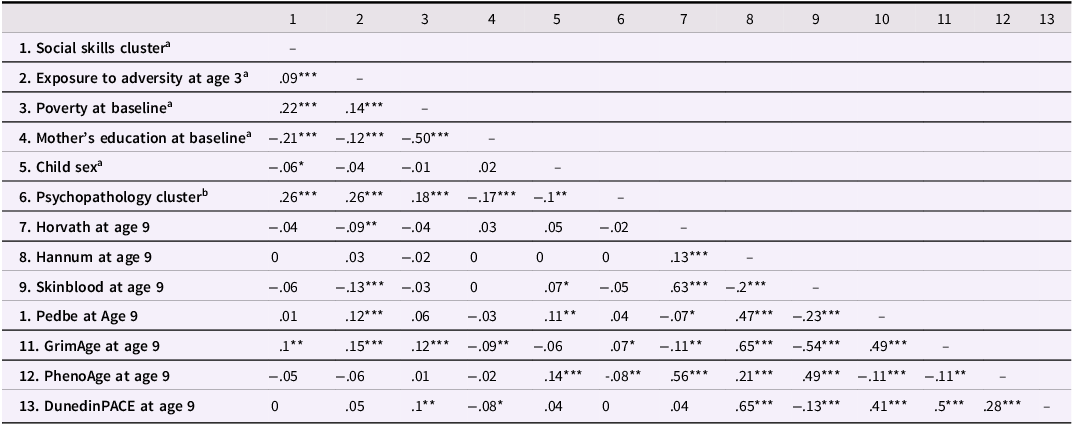
Bivariate analyses were performed using Pearson correlation tests (see Table 2).
Correlations among main study variables

Table 2. Long description
A lower-triangular Pearson correlation matrix with 13 rows and columns. Rows and columns contain Social Skills Cluster, Adversity Exposure at Age 3, Poverty at Baseline, Mother’s Education, Child Sex, Psychopathology Cluster, and seven epigenetic aging measures at age 9: Horvath, Hannum, Skin Blood, PedBE, GrimAge, PhenoAge, and DunedinPACE. Correlations involving social skills, adversity, poverty, maternal education, and sex used the full sample (N = 1,688); those involving psychopathology and epigenetic measures used the epigenetic-data subsample (N = 863). Sex was coded 0 = male and 1 = female; Social Skills Cluster, 0 = High and 1 = Low; Psychopathology Cluster, 0 = Low and 1 = High. Statistical significance is indicated by *p < .05, **p < .01, and ***p < .001.
Note: ***p < .001; **p < .01; *p < .05. Male = 0 and Female = 1 for Child Sex; Social Skills Cluster: 0 = High Social Skills; 1 = Low Social Skills; Psychopathology Cluster: 0 = Low Psychopathology; 1 = High Psychopathology. Correlations among Social Skills Cluster, child sex at birth, adversities and socioeconomic variables were calculated in the full analytic sample (aN = 1,688). Correlations involving Psychopathology Cluster and epigenetic measures were calculated in the subsample with available epigenetic data (bN = 863). The number of observations may vary slightly across individual correlations because of variable-specific missingness.
The social skills cluster was positively correlated with exposure to adversity at age 3 (r = .09, p < .001), indicating that children belonging to the lower social competencies group had parents who reported higher adversity exposure for the child at age 3. Children in the low social skills cluster were also more likely to live in households with higher levels of poverty (r = .22, p < .001), had mothers with lower maternal education (r = −.21, p < .001), were more likely to be male (r = −.06, p = .010), and had higher GrimAge clock at Age 9 (r = .10, p < .001). Exposure to adversity at age 3 was positively correlated with living below the poverty line (r = .14, p < .001) and lower maternal education (r = –.12, p < .001). Additionally, poverty and maternal education were negatively correlated (r = −.50, p < .001), as expected.
Exposure to adversity at age 3 was positively correlated with higher Pedbe (r = .12, p < .001) and GrimAge (r = .15, p < .001) values but negatively correlated with Horvath (r = −.09 p = .006) and Skin & Blood (r = −.13, p < .001) values, at age 9. Poverty at baseline was also correlated with higher GrimAge (r = .12, p < .001), and DunedinPACE (r = .10, p = .002) values at age 9. Associations with other clocks were non-significant. Associations with age 15 epigenetic age measures are presented in Table S3 in the supplement.
Epigenetic clocks at age 9 showed heterogeneous intercorrelations: some clocks were positively correlated (e.g.; Hannum and GrimAge, r = .65, p < .001; Hannum with DunedinPACE, r = .65, p < .001), others were negatively correlated (e.g., GrimAge with PhenoAge, r = −.11, p < .001; Skin & Blood and PedBe, r = −.23, p < .001), and some showed weak or non-significant associations (e.g., Horvath and DunedinPACE, p = .158) (see Table S3 for correlations at age 15).
Early adversity, poverty, social skills, and psychopathology in relation to epigenetic aging at age 9
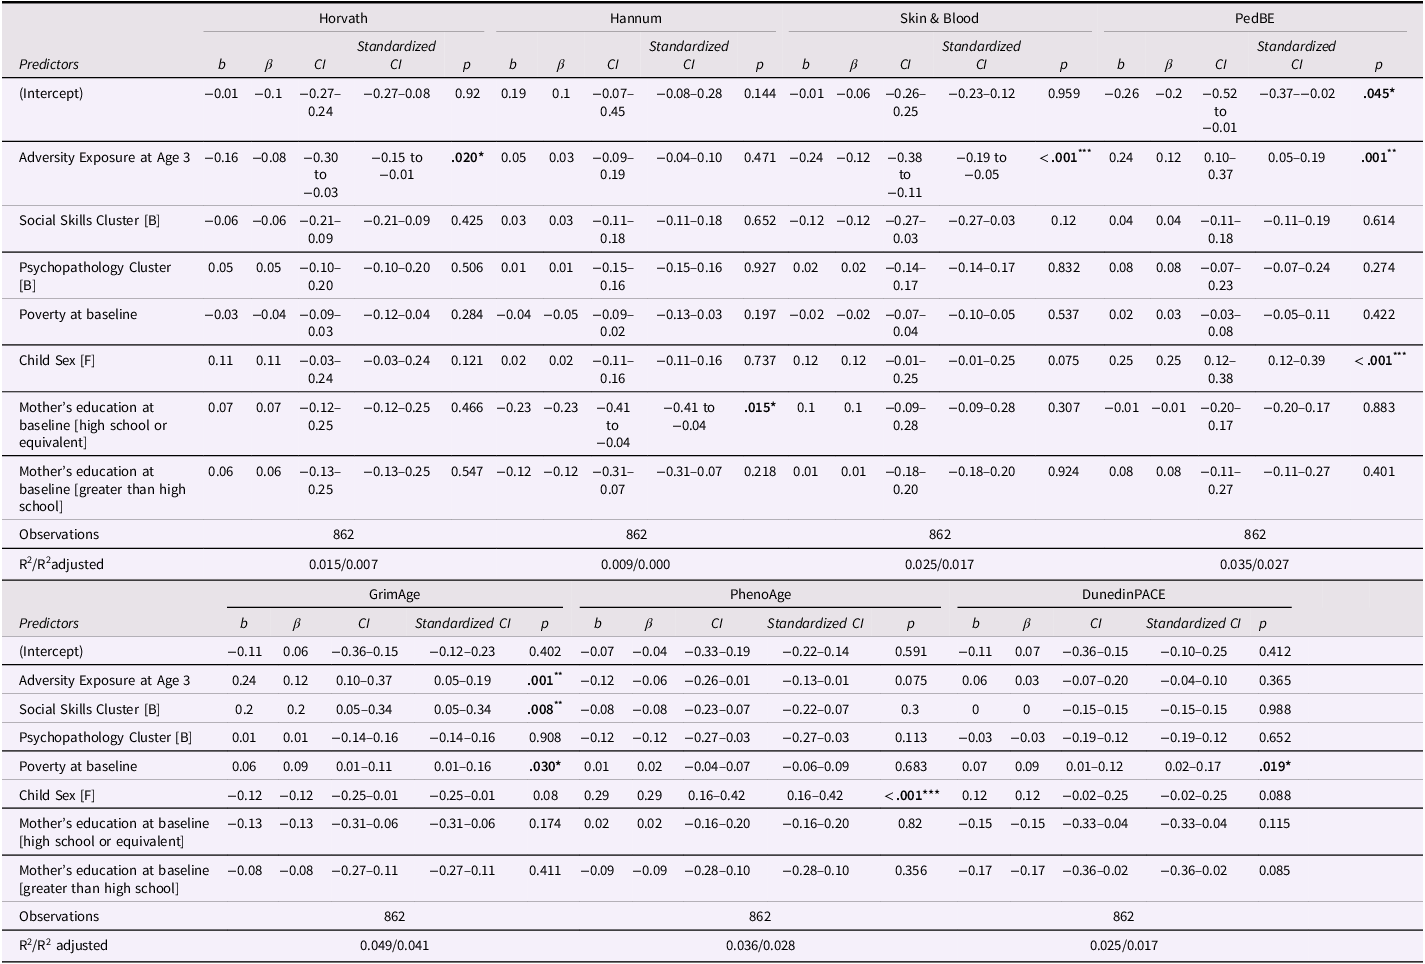
Early adversity at age 3 was significantly associated with several epigenetic measures at age 9, although the direction and magnitude of associations varied across measures (see Table 3). Specifically, greater adversity exposure was associated with higher GrimAge (β = 0.12, 95% CI [0.05, 0.19], p = .001) and higher PedBE (β = 0.12, 95% CI [0.05, 0.19], p = .001) values, whereas it was associated with lower Horvath (β = −0.08, 95% CI [−0.30, −0.03], p = .020) and lower Skin & Blood (β = −0.12, 95% CI [−0.19, −0.05], p < .001) values, and showed a marginal association with lower PhenoAge values (β = −0.06, 95% CI [−0.13, 0.01], p = .075). No significant associations emerged with Hannum or DunedinPACE (all ps > .365) clocks.
Regression models for epigenetic age acceleration at age 9

Table 3. Long description
The table presents linear regression models testing associations of adversity, social skills and psychopathology clusters, poverty, sex, and maternal education with seven epigenetic aging measures at age 9. It has two panels. Panel 1 includes Horvath, Hannum, Skin Blood, and PedBE; Panel 2 includes GrimAge, PhenoAge, and DunedinPACE. Each outcome block has columns for unstandardized coefficient b, standardized coefficient beta, 95% confidence interval, standardized confidence interval, and p value. Rows are Intercept; Adversity Exposure at Age 3; Social Skills Cluster; Psychopathology Cluster; Poverty at Baseline; female sex; maternal education, high school or equivalent and greater than high school; observations; and R-squared and adjusted R-squared. All models use 862 observations. Social Skills Cluster A is High and B is Low; Psychopathology Cluster A is Low and B is High. Sex is coded 0 = male and 1 = female. Statistical significance is indicated by *p < .05, **p < .01, and ***p < .001.
Note: ***p < .001; **p < .01; *p < .05. Male = 0 and Female = 1 for Child Sex; Social Skills Cluster: A = High Social Skills; B = Low Social Skills.; Psychopathology Cluster: A = Low Psychopathology; B = High Psychopathology.
Poverty at birth was associated with higher GrimAge (β = 0.09, 95% CI [0.01, 0.17], p = .022) and higher DunedinPACE (β = 0.09, 95% CI [0.01, 0.17], p = .020) values, but not with the other clocks.
Social skills and psychopathology clusters showed more limited associations. Belonging to the lower social skills cluster was associated with higher GrimAge (β = 0.09, 95% CI [0.01, 0.16], p = .030) values, but no other clocks. The psychopathology cluster was not significantly associated with any clock measure.
Child sex (female) was associated with higher PedBE (β = 0.25, 95% CI [0.12, 0.39], p < .001) and PhenoAge (β = 0.29, 95% CI [0.16, 0.42], p < .001) values. Mother’s education was not significantly associated with most clocks, except for those children of mothers with a high school diploma (compared to those whose mothers did not have one) who showed lower Hannum values (β = −0.23, 95% CI [−0.41, −0.04], p = .015).
We conducted a supplementary analysis to examine the effects of early adversity (age 3), baseline poverty, social skills, and psychopathology cluster membership on epigenetic age across multiple clocks at age 15, controlling for maternal education at childbirth and chronological age at biospecimen collection (see Table S4 in the Supplement). For GrimAge, we replicated our main findings: early adversity at age 3 was associated with higher GrimAge (β = 0.12, 95% CI [0.05, 0.19], p = .001), and belonging to the lower social skills cluster was again linked to higher GrimAge (β = 0.18, 95% CI [0.03, 0.31], p = .019). These findings were partially in line with those from our primary analysis, with greater adversity exposure associated with lower Skin & Blood (β = −0.12, 95% CI [ − 0.19, −0.05], p < .001) and marginally higher PedBE values (β = 0.07, 95% CI [0.00, 0.16], p = .050). In contrast to the results from analyses focused on epigenetic clocks at age 9, early adversity at age 3 was linked to lower PhenoAge (β = −0.10, 95% CI [−0.17, −0.03], p = .006) at age 15, and no significant associations were observed with the Horvath clock (p = .187).
Testing associations of early adversity and poverty with social skills cluster membership
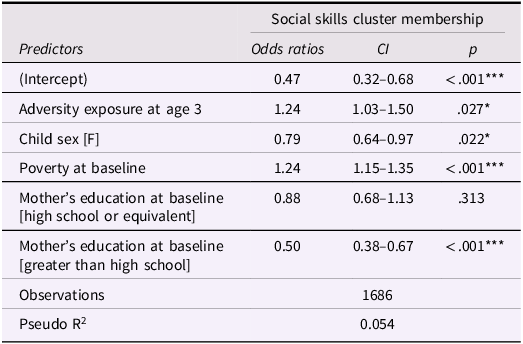
Results from the logistic regression model (see Table 4) indicated that, holding all other variables constant, each additional adversity experienced at age 3 was associated with a 24% increase in the odds of being classified into the low social skills cluster (OR = 1.24, 95% CI = [1.03, 1.50], p = .027). Increase in poverty was also associated with an increase in the odds of being classified into the low social skills cluster (OR = 1.24, 95% CI = [1.15, 1.35], p < .001). Female sex and higher maternal education were associated with a decrease in the odds of being in the low social skills cluster.
Logistic regression to test factors influencing cluster membership

Table 4. Long description
The table presents a logistic regression model examining the associations of adversity exposure at age 3, child sex, poverty at baseline, and maternal education with Social Skills Cluster membership. The outcome is coded as 0 = High Social Skills and 1 = Low Social Skills. The table has four columns: Predictors, Odds Ratios, 95% Confidence Intervals (CIs), and p-values. The rows report the intercept; Adversity Exposure at Age 3; Child Sex, female; Poverty at Baseline; Mother’s Education at Baseline. Each predictor row includes the odds ratio, its corresponding 95% confidence interval, and the p-value. The model is based on 1,686 observations. Maternal education categories are compared with less than high school as the reference category. Child sex is coded as 0 = male and 1 = female. Statistical significance is indicated by *p < .05, **p < .01, and ***p < .001.
Note: ***p < .001; **p < .01; *p < .05. Male = 0 and Female = 1 for Child Sex; Social Skills Cluster: 0 = High Social Skills; 1 = Low Social Skills. The pseudo-R2 for the binomial regression model was calculated as:.
 $1-\,\,{\text{deviance}\,\,of\,\,the\,\,\text{fitted}\,\,\text{model} \over \text{deviance}\,\,of\,\,the\,\,null\,\,\text{model}}$
. Where: deviance of the fitted model refers to the deviance (a measure of model fit) of the model with predictors included. Deviance of the null model refers to the deviance of the model without any predictors (only an intercept).
As a sensitivity analysis, we examined the individual effects of each adversity experienced at age 3 – specifically, physical neglect, emotional abuse, physical abuse, parental incarceration, and maternal substance use – on social skills cluster membership, rather than relying on the cumulative adversity score. Statistical results are reported in the Supplement (see Table S5). Physical neglect at Age 3 was the only adversity that significantly predicted cluster membership, with children who experienced physical neglect being more likely to belong to the low social skills cluster (OR = 1.18, 95% CI = [1.04, 1.36], p = .017).
Social skills cluster as a pathway linking adversity and poverty to epigenetic aging
We next tested whether social skills cluster membership mediated the associations between early adversity, poverty, and GrimAge. When tested separately, both adversity exposure at age 3 and poverty at baseline showed significant indirect effects on GrimAge through social skills cluster membership, alongside significant direct effects, indicating partial mediation for each predictor individually. Specifically, greater adversity exposure was associated with the Low Social Skills cluster (β = 0.09, SE = 0.02, p < .001), which in turn predicted higher GrimAge values (β = 0.12, SE = 0.04, p = .002), yielding a significant indirect effect (β = 0.01, SE = 0.005, p = .016) above and beyond a significant direct effect of adversity on GrimAge (β = 0.13, SE = 0.04, p = .001, see Table S6). Similarly, greater baseline poverty predicted Low Social Skills cluster membership (β = 0.22, SE = 0.02, p < .001), which was associated with higher GrimAge (β = 0.11, SE = 0.04, p = .007), producing a significant indirect effect (β = 0.02, SE = 0.01, p = .009) alongside a significant direct effect of poverty on GrimAge (β = 0.12, SE = 0.04, p = .003, see Table S7).
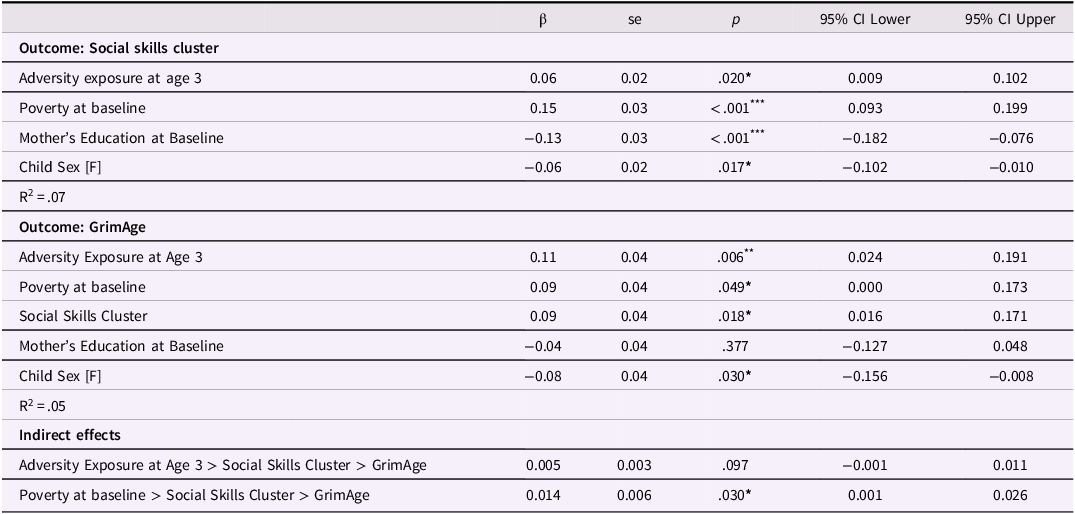
When adversity and poverty were entered simultaneously as predictors of social skills cluster membership and GrimAge, the indirect effect of poverty through social skills remained significant (β = 0.02, SE = 0.008, 95% CI [0.004, 0.038], p = .014), whereas the indirect effect of adversity was attenuated to non-significance (β = 0.006, SE = 0.003, 95% CI [−0.000, 0.013], p = .063), suggesting that the pathway through social skills is more robustly attributable to poverty than to adversity exposure once shared variance is accounted for. Both predictors retained significant direct effects on GrimAge in this simultaneous model (see Table S8). Notably, once relevant covariates were included in the fully adjusted model, the indirect effect of poverty through social skills cluster membership remained significant (β = 0.014, SE = 0.006, 95% CI [0.001, 0.026], p = .030; see Table 5). In contrast, despite a significant direct effect, the indirect effect of adversity through social skills cluster membership remained non-significant (p = .097), suggesting no evidence of mediation for adversity once covariates were accounted for. The fully adjusted model showed excellent fit to the data (χ 2(2) = 3.54, p = .316, CFI = .999, TLI = .996, RMSEA = .010).
Simultaneous mediation model examining the indirect associations of baseline poverty and adversity with GrimAge through the social skills cluster adjusting for covariates

Table 5. Long description
The table presents mediation analyses examining whether Social Skills Cluster membership mediates the associations of adversity exposure at age 3 and baseline poverty with GrimAge. It includes three sections: Outcome: Social Skills Cluster, Outcome: GrimAge, and Indirect Effects. For each predictor and indirect effect, beta coefficients, standard errors, p-values, and 95% confidence intervals are reported. The first section examines predictors of Social Skills Cluster membership, while the second examines predictors of GrimAge, including Social Skills Cluster membership. The third reports the indirect effects of adversity exposure and poverty on GrimAge through Social Skills Cluster membership. Social Skills Cluster is coded 0 = High Social Skills and 1 = Low Social Skills. Child sex is coded 0 = male and 1 = female. Statistical significance is indicated by *p < .05, **p < .01, and ***p < .001.
Note: *** p < .001; ** p < .01; * p < .05; Social Skills Cluster: 0 = High Social Skills; 1 = Low Social Skills; Psychopathology Cluster: 0 = Low Psychopathology; 1 = High Psychopathology.
As a sensitivity analysis, we re-estimated all four mediation models using a bootstrapped approach to derive more robust standard errors and confidence intervals for indirect effects, given the binary nature of the mediator. Full results are reported in the Supplement (Tables S9–S12). Overall, findings were largely consistent with the primary models, with two notable differences. First, the indirect effect of adversity exposure through social skills cluster membership, which was significant in the primary models, was no longer significant under the bootstrapped approach across all specifications, including the adversity-only model (β = 0.009, SE = 0.006, 95% CI [−0.001, 0.020], p = .085; Table S9). Second, the indirect effect of poverty through social skills cluster membership was more robust, remaining significant both in the poverty-only model (β = 0.02, SE = 0.007, 95% CI [0.003, 0.034], p = .019; Table S10) and the simultaneous model (β = 0.017, SE = 0.008, 95% CI [0.002, 0.032], p = .029; Table S11), though it was no longer significant in the fully adjusted model that included covariates (β = 0.011, SE = 0.006, 95% CI [−0.001, 0.024], p = .069; Table S12). The fully adjusted bootstrapped model also showed excellent fit to the data (χ 2(2) = 2.82, p = .420, CFI = 1.00, TLI = 1.00, RMSEA = .000). Together, these sensitivity analyses suggest that the indirect pathway from poverty to GrimAge through social skills was more robust across estimation approaches than the corresponding pathway for adversity, though the poverty-related indirect effect did not survive the most conservative, fully adjusted bootstrapped model.
To examine whether these mediation pathways extended into adolescence, we replicated all four models using GrimAge at age 15, with full results (including bootstrapped estimates) reported in the Supplement (Tables S13–S16). Overall, findings closely paralleled the age 9 results, with the same general pattern of partial mediation for both adversity and poverty in the separate models, attenuation of the adversity indirect effect once poverty was accounted for in the simultaneous model, and further attenuation of both indirect effects once covariates were included.
Discussion
In a large, socioeconomically diverse birth cohort, we examined how early environments and social development relate to multiple epigenetic aging measures in late childhood. In summary, our results suggest that early adversity and poverty show divergent, clock-specific associations with epigenetic age. In contrast, children with higher and more stable social skills trajectories showed lower GrimAge, suggesting that positive social development is implicated in reduced health-related biological aging. However, this pattern of social development was less prevalent in the context of poverty and adversity. Our findings further suggest that declining social skills across childhood may serve as a pathway between poverty and accelerated GrimAge, although the robustness of this finding varied across analyses.
Clock-specific patterns of adversity and poverty. Early adversity showed heterogeneous associations across epigenetic measures, with higher adversities associated with higher GrimAge and PedBE values, but lower Horvath and skin-and-blood values. Thus, adversity was associated with both older- and younger-than expected epigenetic age, depending on the clock measure. GrimAge incorporates DNA methylation estimates of plasma proteins linked to mortality risk, including markers of inflammation (Lu et al., Reference Lu, Quach, Wilson, Reiner, Aviv, Raj and Horvath2019), while PedBE was developed specifically for pediatric populations using buccal tissue to predict chronological age (McEwen et al., Reference McEwen, O’Donnell, McGill, Edgar, Jones, MacIsaac and Kobor2020). In contrast to GrimAge and PedBE, adversity exposure was associated with lower scores on age-trained clocks that are not specific to childhood and trained on different tissues (i.e., Skin & Blood and Horvath), suggesting a modest deceleration on these measures. These findings are consistent with research demonstrating that early-life adversity, including abuse, neglect, and household dysfunction, is associated with shifts in biological aging (Marini et al., Reference Marini, Davis, Soare, Zhu, Suderman, Simpkin and Dunn2020; Sumner et al., Reference Sumner, Colich, Uddin, Armstrong and McLaughlin2019), while also highlighting that such associations are not uniform across epigenetic measures. Poverty, however, showed a more consistent pattern; higher poverty at birth was associated with higher GrimAge and DunedinPACE at age 9, and these associations replicated at age 15, whereas poverty was not associated with Horvath, Hannum, or Skin & Blood. The specificity of poverty associations with mortality-linked clocks is consistent with the perspective that poverty represents a chronic physiological stressor that contributes to allostatic load (Evans & Kim, Reference Evans and Kim2012). Thus, although adversity and poverty are correlated risk factors, they show distinct patterns of association across clocks.
These divergent patterns likely reflect differences in what epigenetic measures capture. Epigenetic clocks differ in their training samples, CpG sites, tissues, and outcomes they are designed to predict, and therefore may index distinct dimensions of biological aging and maturation rather than a single, unified “pace of aging” (Belsky et al., Reference Belsky, Moffitt, Cohen, Corcoran, Levine, Prinz and Caspi2018). Clocks may respond differently to environmental risks because they are calibrated to different underlying biological processes. This distinction may be particularly important in childhood, when biological systems undergo substantial development, are particularly sensitive to environmental influence, and when processes reflecting disease risk and aging-related physiological burden may be distinct from those reflecting maturation. This possibility may explain why environmental risk factors have been associated with indicators of faster and slower developmental pace across different studies and biological systems (Boyce et al., Reference Boyce, Den Besten, Stamperdahl, Zhan, Jiang, Adler and Featherstone2010; Moore et al., Reference Moore, McEwen, Quirt, Morin, Mah, Barr and Kobor2017; Rakesh et al., Reference Rakesh, Whittle, Sheridan and McLaughlin2023). At the same time, findings from some clocks should be interpreted cautiously given that the populations and tissues in which they were developed are different from how they are applied here. Specifically, several clocks were developed in adult blood samples, and their validity as indicators of health-related aging or development in children and in saliva is less established.
Social skills as a correlate and potential mediator. In a second set of analyses, we examined whether developmental trajectories of social skills were associated with epigenetic measures, and whether they could offset or mediate the biological impacts of adversity and poverty. Indeed, prior research suggests that social competence is linked to greater personal well-being (Hastings, Reference Hastings, Bornstein and Shah2025; Kubzansky et al., Reference Kubzansky, Kim, Boehm, Davidson, Huffman, Loucks and Moskowitz2023; Layous et al., Reference Layous, Nelson, Oberle, Schonert-Reichl and Lyubomirsky2012) and reduced illness and mortality (Holt-Lunstad et al., Reference Holt-Lunstad, Smith and Layton2010; Pressman & Cohen, Reference Pressman and Cohen2005). Our findings suggest that children characterized by higher and relatively stable social skills across childhood had lower GrimAge values at age 9, and this association was also observed in analyses of GrimAge at age 15. In contrast, the development of psychopathology symptoms was not associated with any clock, suggesting that these findings were specific to social competence. Our findings are consistent with emerging evidence linking positive social characteristics with more decelerated epigenetic aging profiles in adults (Dobewall et al., Reference Dobewall, Keltikangas-Järvinen, Marttila, Mishra, Saarinen, Cloninger and Hintsanen2023; Espinoza et al., Reference Espinoza, Goering, Dahlman, Patki, Tiwari, Richter and Mrug2025; Goering et al., Reference Goering, Moore, Barker-Kamps, Patki, Tiwari and Mrug2025) and with broader evidence connecting positive social functioning to health and well-being (Hastings, Reference Hastings, Bornstein and Shah2025; Kubzansky et al., Reference Kubzansky, Kim, Boehm, Davidson, Huffman, Loucks and Moskowitz2023).
The development of social skills may serve to compensate for some of the effects of poverty and early life adversity on GrimAge, whereas relatively low social skills appear to be an additional risk factor for accelerated GrimAge. However, it is important to note that social skills across childhood may represent, in part, a downstream consequence of early environmental conditions rather than solely serving as an independent resilience factor (Kahhale et al., Reference Kahhale, Byrd and Hanson2025). Indeed, we found that both exposure to poverty and adversity, particularly physical neglect (see Supplement), to be associated with lower odds of high social skills trajectory membership, consistent with theories proposing that early stressors often constrain the development of complex social competencies (Malti & Speidel, Reference Malti and Speidel2024). Although the associations of adversity and poverty with social skills trajectory membership were modest, the accumulation and co-occurrence of these risk factors may produce compounding increases in risk. Thus, children exposed to multiple forms of adversity and extreme poverty appear to be more likely to show declining social skills across childhood, a pattern that is also linked to increased epigenetic age. Mediation models provided some evidence for this as a mechanistic pathway. When adversity and poverty were examined separately, both showed significant indirect associations with GrimAge through social-skills cluster membership. When modeled simultaneously, the indirect association for poverty remained statistically significant but was attenuated for adversity. However, the poverty pathway was no longer statistically significant in the fully adjusted, bootstrapped model. Together, these results offer suggestive, but not definitive, evidence that disrupted social development represents one pathway linking socioeconomic disadvantage to accelerated health-relevant epigenetic aging.
Several limitations should be considered when interpreting these findings. First, all psychosocial variables relied on caregiver reports, which may introduce bias and limit detection of child-reported experiences or peer- or teacher-recognized competencies. Second, FFCWS oversampled nonmarital births and lower-income families, which may limit generalizability to other populations. In contrast, our cluster analysis relied on participants with complete social skills data across ages 3, 5, and 9, and this analytic sample had significantly higher maternal education and income than excluded families. Thus, our cluster analysis may underrepresent the most disadvantaged families. Third, biological samples were available for less than half the original cohort, potentially introducing selection bias, though minimal differences emerged on measured variables. Additionally, the modest R2 values across models (0.008–0.049 adjusted R2) indicate that early adversity, poverty, and social factors explain a small proportion of variation in epigenetic aging, reflecting its multifactorial nature and the potential contribution of biological (e.g., immune function, genetics), environmental (e.g., nutrition), and psychosocial factors (e.g., peer relationships, school engagement) that were not captured in our analysis. Future research should integrate more environmental and developmental factors in relation to multi-system biological measures to better capture and explain the complexity of maturation and aging processes.
Despite these limitations, our findings indicate that early adversity, poverty, and social development relate to biological aging in unique and sometimes divergent ways. We observed heterogeneity in the associations of early life adversity and poverty with epigenetic clocks, consistent with the emerging consensus that different clocks index distinct biological processes and aging dimensions, rather than a unified, single construct. Environmental risks act on multiple biological aging processes simultaneously, contributing to both faster and slower maturation or aging, depending on the specific clock measure and underlying biological mechanisms; this complexity is obscured when focusing on single-clock measures. By modeling poverty and adversity simultaneously and testing social skills as a mediating pathway, this study moves beyond documenting isolated associations toward clarifying how distinct but frequently co-occurring aspects of early environmental risk relate to biological aging processes. Our findings also highlight the importance of children’s social development, including empathy, prosocial behavior, effective communication, and emotion regulation. Positive social development may represent a compensatory factor for health-relevant epigenetic aging, but may also be disrupted by environmental risks, particularly poverty.
Supplementary material
The supplementary material for this article can be found at https://doi.org/10.1017/S0954579426102132.
Data availability statement
The data used in this study were obtained from the Future of Families and Child Wellbeing Study. The individual-level data are not publicly redistributable by the authors because they are subject to the study’s data-use restrictions. Eligible researchers may obtain access through the Future of Families and Child Wellbeing Study’s data-access procedures. Information about accessing the data is available at https://ffcws.princeton.edu. The R code used for data preparation and statistical analyses is available from the corresponding author upon reasonable request.
Acknowledgements
None.
Funding statement
The Future of Families and Child Wellbeing Study was supported by the Eunice Kennedy Shriver National Institute of Child Health and Human Development through grants R01HD36916, R01HD39135, and R01HD40421, as well as a consortium of private foundations.
Competing interests
The authors have no competing interests to declare.
Pre-registration statement
The study was not preregistered. It involves secondary analyses, including exploratory and data-driven analyses, of data collected from the Future of Families and Child Wellbeing Study.
Declaration of generative AI and AI-assisted technologies in the manuscript preparation process
During the preparation of this work the author(s) used ChatGPT in order to assist with language refinement. After using this tool/service, the author(s) reviewed and edited the content as needed and take full responsibility for the content of the published article.





 Open access

