




No CrossRef data available.
Costs of resistance in insect-parasite and insect-parasitoid interactions
Published online by Cambridge University Press: 29 May 2003
Abstract
Most, if not all, organisms face attack by natural enemies and will be selected to evolve some form of defence. Resistance may have costs as well as its obvious benefits. These costs may be associated with actual defence or with the maintenance of the defensive machinery irrespective of whether a challenge occurs. In this paper, the evidence for costs of resistance in insect-parasite and insect-parasitoid systems is reviewed, with emphasis on two host-parasitoid systems, based on Drosophila melanogaster and pea aphids as hosts. Data from true insect-parasite systems mainly concern the costs of actual defence; evidence for the costs of standing defences is mostly circumstantial. In pea aphids, the costs of standing defences have so far proved elusive. Resistance amongst clones is not correlated with life-time fecundity, whether measured on good or poor quality plants. Successful defence by a D. melanogaster larva results in a reduction in adult size and fecundity and an increased susceptibility to pupal parasitoids. Costs of standing defences are a reduction in larval competitive ability though these costs only become important when food is limited. It is concluded that costs of resistance can play a pivotal role in the evolutionary and population dynamic interactions between hosts and their parasites.
Information
- Type
- Research Article
- Information
- Copyright
- © 2002 Cambridge University Press
INTRODUCTION
Almost all organisms face attack by predators and parasites and will therefore be selected to evolve some sort of defence mechanism against these natural enemies. Especially in the last decade, it has become increasingly clear that resistance against pathogens and parasites can be a mixed blessing, as high levels of resistance have their costs. Costs of resistance to natural enemies have been identified in organisms as varied as Escherichia coli (Lenski, 1988), plants (Bergelson & Purrington, 1996), snails (Webster & Woolhouse, 1999; Rigby & Jokela, 2000) and birds (Sheldon & Verhulst, 1996; Verhulst, Dieleman & Parmentier, 1999). The rate and direction of the evolution of resistance will depend on the combination of the selection pressures exerted by natural enemies and the nature and magnitude of the costs of resistance.
It is important to distinguish between two types of costs of resistance. First, the costs of actual defence, which are borne after an individual is parasitised. These costs arise as a result of energy and other resources being used in the deployment of the immune system (and/or other defences) following parasitism. The other type of cost is that of standing defences. This type of cost is associated with investment in the immune system (or any other defence mechanism) in anticipation of potential future parasitism.
Costs of actual defence will influence the evolution of resistance. When successful defence has negative effects on other fitness parameters, the spread of resistance genes in a population will be slowed down. If costs are so high that parasitised individuals that have successfully defended themselves against the parasite do not leave any offspring, resistance cannot evolve at all. Resistance will also not evolve if the costs of actual defence are greater than the negative effect the parasite has on the host. The costs of standing defences can also influence whether resistance will evolve: if costs of standing defence are high and the probability of being parasitised is low, there will be selection for low levels or the absence of resistance. In a system in which the natural enemy obligatorily prevents its host from producing any offspring, costs of standing defence are the only type of costs that will influence the evolution of resistance.
We first give an overview of insect-parasite systems where costs, or indications of costs, have been found. Then we review in more detail our present state of knowledge of two well-studied insect-parasitoid systems, based on pea aphids and Drosophila melanogaster as hosts. Because parasitoids always kill their host, selection pressures on defence and counter-defence in host-parasitoid interactions are often stronger than in typical host-parasite systems.
Costs of actual defence
The clearest example that the employment of the immune system is costly comes from bumble bees (Bombus terrestris). Starved and non-starved bees were challenged with either lipopolysaccharides extracted from Escherichia coli or bacteria-sized latex beads. Lipopolysaccharides are cell-surface molecules used by the immune system to recognise bacteria; the reason behind injecting these or the latex beads was to challenge the immune system with substances that have no pathogenic effect per se. In the starved bees, the induction of the immune system led to a reduction in survival compared to non-starved bees (Moret & Schmid-Hempel, 2000). Limiting the resource uptake by starving the bees reveals that employing the immune system has costs. These costs remain hidden in bees that have abundant food and therefore do not need to partition limited resources between the immune system and somatic maintenance.
Often it is difficult to distinguish costs of actual defence from the negative effects of the parasite. Mosquitoes (Armigerus subalbatus) which have encapsulated filarial worms show reduced and delayed egg-laying (Ferdig et al. 1993), but it is unclear whether this is a cost of the encapsulation process itself or a pathogenic effect of the parasites, or even a combination of both. Bumble bee colonies, in which the workers received an immune challenge with lipopolysaccharides, had lower overall reproductive output and produced fewer queens (Moret & Schmid-Hempel, 2001). As lipopolysaccharides have no pathogenic effect themselves, this suggests a trade-off between actual defence and reproduction on a colony level.
A direct indication that resources involved in mounting an immune response are limiting within an individual comes from the damselfly, Mnais costalis. Phenoloxidase is a key enzyme in the immune system of many insects (Nappi, 1975; Lackie, 1988a). Siva-Jothy et al. (2001) injected nylon filaments into the haemolymph of field-caught adult damselflies. In individuals which received such an acute immune challenge, there was a negative correlation between phenoloxidase activity and eugregarine parasite burden in the midgut. No such correlation was found in individuals that did not receive an acute immune challenge. This suggests that maintaining high phenoloxidase levels in both parts of the organism (the haemolymph and the midgut) is costly. Bumble bee workers which have been challenged with lipopolysaccharides (which, as explained above, have no pathogenic effects themselves) show an increased antibacterial activity but a reduction in phenoloxidase activity (Moret & Schmid-Hempel, 2001). This is an indication of a trade-off between the two different immune responses.
Further indications that resisting parasites is costly come from observations that levels of immunity are reduced when the animal is concentrating resources in other activities. For instance, an increase in reproductive activity is correlated with a reduction in levels of defence, as measured by the immune response against an injected nylon filament in males and females of the damselfly, Matrona basilaris japonica, (Siva-Jothy, Tsubaki & Hooper, 1998) and against bacteria in D. melanogaster males (McKean & Nunney, 2001). An increase in foraging activity is correlated with a reduction in the immune response against an injected nylon filament in bumble bees (König & Schmid-Hempel, 1995; Doums & Schmid-Hempel, 2000).
Indication of a very different kind, that up-regulation of the immune system can be costly, comes from a genome-wide analysis (using oligonucleotide microarrays) of the immune response of D. melanogaster against infection with bacteria and entomopathogenic fungi (De Gregorio et al. 2001). Drosophila melanogaster adults which received a septic injury with a needle dipped in a culture of E. coli and Micrococcus luteus, or were infected with Beauvaria bassiana, showed increased expression of 230 genes. A discussion of these genes, and their role in the immune reaction, is beyond the scope of this paper, but the authors also found 170 genes which were down-regulated. Among these were genes that are involved in general metabolism. It is possible that the up-regulation of the many genes involved in the immune reaction, and the resources involved, requires a down-regulation of metabolic processes which are not immediately necessary, with potential consequences for other fitness parameters.
Costs of standing defences
The most powerful methods to identify trade-offs between resistance and other fitness parameters are quantitative genetic estimation of trait covariance and selection experiments (Reznick, 1985). Apart from the examples mentioned in the next section, very few data using one of these methodologies exist in the literature. Evolution of resistance against a granulosis virus is correlated with longer developmental time and reduction in egg viability in the Indian meal moth (Plodia interpunctella; Boots & Begon, 1993). A mosquito (Aedes aegypti) line resistant to the malaria parasite had smaller adult body size, lower fecundity and shorter longevity than a susceptible line (Yan, Severson & Christensen, 1997). A problem with both these studies, however, is a lack of replication across lines.
Phenotypic correlations between resistance and other traits can provide circumstantial evidence that resistance is costly, but the possibility that there is an unknown third variable underlying the correlation cannot be ruled out. Nevertheless, the results of a number of studies are consistent with resources being required for maintenance of a high level of standing defence.
Several insect species show phenotypic plasticity in a range of traits depending on population density. The best example of this ‘density-dependent phase polyphenism’ are desert locusts, Schistocerca gregaria (Pener & Yerushalmi, 1998). High-density forms are often darker and a potential explanation is that the cuticle is heavily melanised and hardened to resist parasite attack, which is more likely to occur in high density populations. Darker (gregarious) forms of Spodoptera spp. and Tenebrio molitor are indeed more resistant to pathogens and parasitoids (Reeson et al. 1998; Barnes & Siva-Jothy, 2000; Wilson et al. 2001). Phenoloxidase levels are also increased in gregarious forms (Reeson et al. 1998; Wilson et al. 2001). This again may be due to higher risks of infection. However, if cuticular melanisation had evolved for another reason, for example thermoregulation, and if cuticle hardening and the immune system shared metabolic pathways, as appears to be the case, then the marginal costs of maintaining high levels of immune function may be lower in gregarious forms and thus greater activity might be selected in the absence of a difference in risk of infection. Interestingly, when bumble bee workers were immunologically challenged by lipopolysaccharides, the males produced by these colonies show an increase in phenoloxidase activity (Moret & Schmid-Hempel, 2001). The physiological mechanism of this trans-generation transfer of increased immunity is unknown, but conceptually it is similar to what may be happening in phase-dependent polyphenic insects: costly up-regulation of the immune system only when there is an indication for an increased risk of infection.
Gender differences in investment in immune function are found in a handful of insect species (Kurtz et al. 2000 and references therein). In general, males have a lower level of immune function than females, which appears to result from a trade-off between investment in resistance and in sexual traits and activity. In several insect species, females prefer males exhibiting indications of higher immune function. Males of the damselfly, Calopteryx splendens xanthostoma, with darker wing spots are preferred by females and have higher resistance against eugregarine parasites (Siva-Jothy, 2000). Phenoloxidase is involved in the deposition of melanin in the wings (Siva-Jothy, 2000). It is hypothesised that individuals with a strong immune system are better able to provide dark wing spots (a revealing handicap) or that high quality males can afford to invest in both wing pigmentation and defence. Cricket (Acheta domesticus) females prefer males with more syllables per chirp in their song. There is a positive correlation between number of syllables per chirp and both haemocyte numbers and encapsulation ability in males (Ryder & Siva-Jothy, 2000).
COSTS OF RESISTANCE TO PARASITOIDS
Parasitoids are intermediate between true parasites and predators in that they are parasitic in their host as larvae, but at some point in their development kill their host and become free-living adults (Godfray, 1994). Because only one of the two combatants can survive parasitism, there is strong selection on hosts to be resistant, and on parasitoids to evolve counter-defence mechanisms. Unlike the case with true parasites, where the costs of actual defence may be greater than the harmful effect of the parasite, the costs of actual defence against parasitoids with always have to be paid, as the alternative for the host is death.
Apart from the two insect-parasitoid systems that we discuss below, there is little evidence on the nature and magnitude of the costs of resistance against parasitoids (the older literature is reviewed by Godfray, 1994, and Kraaijeveld, van Alphen & Godfray, 1998). In the pyralid, Corcyra cephalonica, attacked by the ichneumonid, Venturia canescens, the development time of surviving moths increases the more parasitoid eggs are encapsulated by the larva (Harvey, Thompson & Heyes, 1996). This may indeed be a cost of actual defence, but it is difficult to separate the effects of employing the immune system from the direct harm done to the host by the ovipositing parasitoid. Work by Zareh, Westoby & Pimentel (1980) hints at costs of standing defences in house flies (Musca domestica) against the pupal parasitoid, Nasonia vitripennis. Fly lines exposed to parasitism evolved heavier puparia and a shorter pupal stage duration. Presumably these trait changes are adaptations to reduce the risk of parasitism and can therefore be seen as resistance mechanisms. Zareh et al. (1980) found a reduction in female fecundity in the lines exposed to parasitoids, possibly a direct effect of the shorter pupal stage.
Pea aphids
Pea aphids (Acyrthosiphon pisum, Homoptera, Aphididae) are cyclical parthenogens that feed on a range of legume species. The two most common parasitoid species that attack pea aphids are the braconids, Aphidius ervi and A. eadyi. The former also attacks a number of related aphid species, while A. eadyi is a specialist on pea aphids (Starý, González & Hall, 1980; Müller et al. 1999). In addition, pea aphids are subject to infection by a number of fungi, of which Erynia neoaphidis (Entomophthorales, Entomophthoraceae) is the most common, at least in southern England.
How pea aphids defend themselves against parasitoids and fungi is unknown. What is clear, however, is that encapsulation, the prime cellular defence mechanism in insects, plays no role (Milner, 1982; Henter & Via, 1995). At single sites, there is substantial between-clone variation in resistance against A. ervi, A. eadyi and E. neoaphidis (Henter & Via, 1995; Ferrari et al. 2001). Among populations, the picture is complicated by the host plant specialisation of pea aphids. The species feeds on a wide range of legume species, but individual genotypes are very specialised on different plant species (Via, 1991a, b, 1999; Sandström, 1994; Sandström & Petterson, 1994; Via, Bouck & Skillman, 2000). In two separate areas of the United States, pea aphids specialised on Medicago sativa were more resistant to A. ervi than aphids from Trifolium pratense (Hufbauer & Via, 1999; Hufbauer, 2001).
Within one field of M. sativa, Henter & Via (1995) did not observe an increase in the frequency of resistant clones in a population over the course of a field season despite variation in resistance among clones and substantial rates of parasitism. One explanation for this is that costs of resistance are important. So far, however, the nature and magnitude of the costs of resistance in pea aphids has proved elusive. We measured the resistance of over 28 pea aphid clones to A. ervi, A. eadyi and E. neoaphidis and, for a subset of clones, life-time fecundity on good and poor quality plants (Ferrari et al. 2001). No correlation across clones between resistance to any of the three natural enemies and life-time fecundity was found (Fig. 1 shows the results for A. ervi).

Fig. 1. Correlation amongst Acyrthosiphon pisum clones between susceptibility to Aphidius ervi and offspring production on (a) good and (b) poor quality host plants. See Ferrari et al. (2001) for experimental details.
Across clones, resistance against A. ervi and A. eadyi is positively correlated (Ferrari et al. 2001). Some clones are almost completely susceptible to both species, while others are completely resistant. However, several clones are more resistant to the specialist A. eadyi than to the generalist A. ervi (Fig. 2a). These results were complicated by the observation that some clones which survived attack by A. eadyi (our definition of resistance) produced virtually no offspring after successful defence. Parasites and parasitoids often shut down host investment in reproduction which is wasteful from the parasite's point of view. This may be why some of the clones produced no offspring, even though they did defend themselves successfully against the parasitoid. Cross-resistance between parasitoids and the fungus, E. neoaphidis, is not significantly correlated, though there is a positive trend (Fig. 2b; Ferrari et al. 2001).

Fig. 2. Correlation amongst Acyrthosiphon pisum clones between susceptibility to Aphidius ervi and susceptibility to (a) A. eadyi or to (b) Erynia neoaphidis. The open circles in (a) are the clones that do not mummify after attack by A. eadyi which fail to reproduce. The susceptibility values to E. neoaphidis are an index. See Ferrari et al. (2001) for experimental details.
We have limited evidence that the relative resistance of different aphid clones remains the same when challenged by different parasitoid genotypes. Resistance of British pea aphid clones to a British strain of A. ervi was highly and positively correlated with resistance against an American strain (unpublished data). Furthermore, there is no evidence that parasitoids collected on different host plant species survived better on aphids from their own host plant species compared with aphids from other host plant species (Hufbauer, 2001).
Drosophila melanogaster
D. melanogaster is among the more common Drosophila species breeding in fermenting fruits. Its larvae are attacked by several parasitoid species, of which the most common in Europe are the braconid, Asobara tabida, and the figitids, Leptopilina heterotoma and L. boulardi (Carton et al. 1986). Like many insects and other invertebrates (Nappi, 1975; Lackie, 1988a, b), D. melanogaster larvae are able to mount a cellular immune response, called encapsulation, against parasitism (Nappi, 1975; Rizki & Rizki, 1984; Strand & Pech, 1995). First, the parasitoid egg is recognised as non-self and haemocytes (blood cells) aggregate around the egg, forming a multi-layered capsule. Cytokines and other proteins are thought to be involved in mediating haemocyte aggregation behaviour (Strand & Pech, 1995). The subsequent deposition of melanin around the haemocyte-egg aggregate involves crystal cells (a separate class of haemocytes) and enzymes of the phenoloxidase-cascade (Strand & Pech, 1995). If deposition of melanin leads to a closed, blackened capsule, the parasitoid egg dies, possibly as a result of starvation or asphyxiation, or possibly due to toxic substances emanating from the capsule (Nappi et al. 1995; Nappi & Vass, 1998). When the host survives, the encapsulated egg is usually visible in the abdomen as a black dot.
The parasitoid species attacking D. melanogaster have evolved different counter-defence mechanisms to avoid their eggs becoming encapsulated. The egg chorion of A. tabida has proteinaceous filaments, which cause the eggs to stick to and subsequently become hidden in host tissue, away from circulating haemocytes (Kraaijeveld & van Alphen, 1994; Eslin et al. 1996). In contrast to this passive counter-defence mechanism of A. tabida, the Leptopilina species actively suppress the host's immune system. Ovipositing females inject virus-like particles into the host (Rizki & Rizki, 1990; Dupas et al. 1996), which are believed to enter the host's haemocytes and cause apoptosis (Rizki & Rizki, 1990).
The encapsulation ability of D. melanogaster and the level of counter-defence of A. tabida shows considerable variation, both at a geographic level and within populations (reviewed in Kraaijeveld & Godfray, 1999). The evidence so far (based mostly on the interaction between D. melanogaster and A. tabida; Kraaijeveld & Godfray, 2001) does not indicate that this variation can be explained by local adaptation (where hosts are better adapted to sympatric than to allopatric parasitoids or vice versa; see Kaltz & Shykoff, 1998, for a review of local adaptation in host-parasite systems). There is also no evidence that specific genotypes of the host are resistant to specific genotypes of the parasitoid. Rather, it seems that both defence of D. melanogaster and counter-defence of A. tabida are traits analogous to the running speeds of a predator and its prey. The relative resistance of different host populations appears to be independent of the parasitoid population attacking them and, similarly, the relative counter-resistance of different parasitoid populations is independent of which host population they parasitise. Genotype-specificity might play a role, however, in the interaction between D. melanogaster and L. boulardi, as there is some evidence that L. boulardi survives better in sympatric than in allopatric host populations (Carton, 1984; but see Kraaijeveld et al. 1998).
The pupae of D. melanogaster are attacked by a small number of parasitoid species, of which the pteromalid, Pachycrepoideus vindemiae, is the commonest in Europe (Carton et al. 1986). P. vindemiae lays its eggs in the space between the actual pupa and the puparium. As such, it is an ectoparasitoid and its eggs do not come into contact with the host's immune system. However, the parasitoid has to drill through the puparial wall to lay its eggs. As in the house fly example mentioned above, the puparial wall is the main defence barrier of D. melanogaster pupae against pupal parasitoids.
Costs of actual defence
Oviposition of a parasitoid egg into a D. melanogaster larva leads to an increase in the number of circulating haemocytes, followed by the production of a melanised capsule (Carton & Kitano, 1979; Nappi, Carton & Frey, 1991). Whether capsule formation is successful or not, these activities are likely to require resources.
Carton & David (1983) showed that successful encapsulation of L. boulardi eggs by D. melanogaster leads to smaller adult flies and reduced female fecundity. Encapsulation of A. tabida eggs also results in a reduction of adult size and lower fecundity in females (Fellowes, Kraaijeveld & Godfray, 1999a). This study also looked at the costs of actual defence against A. tabida in males. When only given the opportunity to mate once, males which had successfully encapsulated a parasitoid egg obtained less offspring from this single mating than males which had not been parasitised. However, no difference was found when males were allowed to mate more than once with females. Hoang (2001) showed that flies which had successfully encapsulated an egg of A. tabida had reduced resistance to desiccation and starvation. Flies surviving parasitism lived 12% shorter than unparasitised control flies when they were maintained under desiccating conditions and 14% shorter when deprived of food. As stress resistance is correlated with body size in D. melanogaster (Djawdan et al. 1998), the decreased resistance to desiccation and starvation is likely to be an additional consequence of the reduction in body size of flies surviving parasitism.
Activation of the immune system after parasitism by A. tabida, whether successful in encapsulating the parasitoid egg or not, results in a reduction in larval feeding rate (Tiën et al. 2001). Feeding rate, the frequency of retractions of the cephalopharyngeal skeleton, is an important determinant of larval competitive ability (Joshi & Mueller, 1988, 1996). The reduction in feeding rate in D. melanogaster larvae after parasitism may result in parasitised larvae having a lower competitive ability than unparasitised larvae. We found no reduction in feeding rate when D. subobscura larvae were parasitised by A. tabida (Tiën et al. 2001). D. subobscura is one of the most common Drosophila species on fermenting fruits and has no immune response against parasitoids (Kraaijeveld & van der Wel, 1994). The lack of a reduction in feeding rate in parasitised larvae of this species indicates that parasitism per se does not reduce feeding rate. This observation increases the likelihood that the reduction of feeding rate in D. melanogaster after parasitism reflects a cost of actual defence.
A further indication that defence requires limiting resources comes from the observation that the probability of encapsulation of L. boulardi eggs by D. melanogaster larvae decreases with larval crowding (Wajnberg et al. 1990). A major consequence of crowding is increased competition for food amongst the larvae, and reduced food intake may mean less resources available for defence. However, an alternative explanation is that the increased build-up of waste products in crowded conditions harms the larvae and has a negative effect on their immune system. Encapsulation was not reduced in crowded larvae parasitised by A. tabida or L. heterotoma (Tiën et al. 2001). Whether this reflects a difference between the immune responses to L. boulardi and the other two species, or simply a difference in the design of the experiment, is not clear.
Apart from encapsulation, the phenoloxidase cascade is also involved in puparium formation and melanin-precursors are incorporated into the hardening puparial wall (Fraenkel & Rudall, 1947). We may therefore expect activation of the immune system to have an effect on puparium formation: resources used up by the immune system cannot be used again for puparium formation. Indeed, puparia of larvae which have successfully encapsulated A. tabida eggs have thinner walls than those of unparasitised larvae (Fellowes et al. 1998b). A thinner puparial wall is likely to lead to greater vulnerability to physical damage or desiccation, and also to increased susceptibility to the pupal parasitoid, P. vindemiae (Fellowes et al. 1998b).
Female flies can potentially detect whether a male has successfully encapsulated a parasitoid egg, as the capsule is visible through the abdominal wall. Should she discriminate between capsule-bearing and unparasitised males? On the one hand, capsule-bearing male flies advertise having genes for resistance against parasitoids, which would make them more attractive as mates. On the other hand, males with a capsule also advertise the fact that they failed to avoid parasitism in the first place, and they have reduced insemination capabilities (see above), which would make them less attractive mates. These two alternative predictions were tested in experiments where virgin females were released in cages with equal numbers of capsule-bearing and unparasitised males. Matings with both types of males occurred with equal frequencies, and hence there is no evidence that female flies choose for or against capsule-bearing male flies (Kraaijeveld, Emmett & Godfray, 1997).
Costs of standing defences
In order to measure the costs of standing defences, we selected replicate lines of D. melanogaster for increased resistance to A. tabida and, in a separate experiment, to L. boulardi. In five generations, encapsulation ability increased from 5% to 60% in the experiments with A. tabida, and from 0.5% to 45% in the experiments with L. boulardi (Kraaijeveld & Godfray, 1997; Fellowes, Kraaijeveld & Godfray, 1998a). We measured total haemocyte numbers in the A. tabida-selected lines and their controls and found that the increased resistance to A. tabida is associated with a doubling of the number of circulating haemocytes (Kraaijeveld, Limentani & Godfray, 2001b). This is consistent with the positive correlation that Eslin & Prévost (1998) found across species when they measured encapsulation ability and haemocyte numbers in D. melanogaster and five related species. Preliminary results (unpublished data) show no increase in phenoloxidase activity in the selected lines.
We tested whether there was a cost of standing defence by comparing selected and control lines for a number of life-history traits, ranging from egg viability to female fecundity (Kraaijeveld & Godfray, 1997). When flies were reared with excess larval food, we found no difference between control and selection lines in any of these traits. This was not unexpected as trade-offs are more likely to become manifest when organisms are stressed (Stearns, 1992; Bergelson & Purrington, 1996). As competition for food between larvae is important in natural Drosophila populations (Atkinson, 1979), we varied the level of larval competition and compared control and selection lines. Fixed numbers of larvae from either control or selection lines were placed on food patches of varying size together with a fixed number of larvae from a standard reference strain (in our case an eye-colour mutant). Fig. 3 shows the main result: at higher levels of competition, larvae from both the lines selected for resistance against A. tabida and against L. boulardi showed a reduced relative competitive ability compared to larvae from their respective control lines (Kraaijeveld & Godfray, 1997; Fellowes et al. 1998a). We found no significant differences between individuals from control and selection lines in development time, adult size or fluctuating asymmetry.

Fig. 3. Competitive ability (relative to a reference strain of fly) at different levels of larval competition of Drosophila melanogaster lines selected for resistance against parasitoids (hatched bars) and their respective control lines (white bars). Left panel shows results of selection experiments using Asobara tabida; right panel shows results using Leptopilina boulardi. Each bar is mean of four replicate lines±S.E.; competitive ability is calculated as ln(e/(r+1)), where e is the number of surviving experimental (control or selection) flies and r the number of surviving reference flies; ‘no’, ‘low’, ‘int’ and ‘high’ levels of competition refer to 30 larvae on, respectively, 0.4, 0.2, 0.1 and 0.05 ml of a yeast suspension. See Kraaijeveld & Godfray (1997) for experimental details.
As mentioned above, larval feeding rate is an important determinant of competitive ability. We measured feeding rates of larvae from the control and selection lines and found that the reduction in competitive ability of the lines selected for high resistance is associated with a decrease in larval feeding rate (Fellowes, Kraaijeveld & Godfray, 1999b). There were no differences between pupae from control and selection lines in fat reserves (measured by ether extraction; unpublished data). The difference in feeding rate between larvae from selected and control lines was much greater than that found between parasitised and unparasitised larvae from the same population (see above). To investigate further the trade-off between resistance and competitive ability, we are currently conducting replicated experiments in which larvae from a population with high resistance are reared in crowded and uncrowded conditions (A. Sanders, unpublished). If the trade-off between resistance and competitive ability is direct and symmetrical, it is expected that resistance will decrease in the crowded lines.
The reason for the negative association between haemocyte number and feeding rate is not clear at the moment. One possibility is that there is a switch in the general energy budget of a larva away from investment in a trophic function to investment in the immune system. An alternative, more specific, explanation involves the early development of the larva: the head musculature and the haemopoietic organ (where haemocytes are produced) both originate from the same part of the embryo (Fullilove, Jacobson & Turner, 1977; Tepass et al. 1994). Increased allocation of tissue to the future haemopoietic organ may be at the expense of future muscle tissue. A third potential explanation (suggested to us by M. Siva-Jothy) is that a doubling of the number of circulating haemocytes increases the viscosity of the haemolymph, leading to lower rates of resource supply (such as glucose) to working muscles.
Given that parasitoid species use a variety of counter-defence mechanisms, trade-offs between resistance to different parasitoid species might occur. We found no evidence for this kind of trade-off, however. Selection for increased resistance to A. tabida and L. boulardi both lead to increased resistance to L. heterotoma (Fellowes, Kraaijeveld & Godfray, 1999c). This is consistent with positive correlations that have been found amongst isofemale lines for resistance against L. boulardi and L. heterotoma (Boulétreau & Wajnberg, 1986; Delpuech, Frey & Carton, 1994).
Cross-resistance is not necessarily symmetric (Fig. 4): selection for increased resistance to A. tabida leads to a very small, non-significant increase in resistance to L. boulardi (left panel of Fig. 4). In contrast, lines selected for increased resistance to L. boulardi are as resistant against A. tabida as the lines that were actually selected for resistance against that species (right panel of Fig. 4; Fellowes et al. 1999c). This suggests that the immune system of D. melanogaster has two components: a general component, effective against parasitoids in general, and a specific component, required in addition for resistance against the more specialised parasitoid L. boulardi.

Fig. 4. Cross-resistance (measured by percentage encapsulation) by Drosophila melanogaster lines selected for resistance against either Asobara tabida or Leptopilina boulardi (S, hatched bars) and their respective control lines (C, white bars). Left panel shows results of selection experiments using A. tabida; right panel shows results using L. boulardi. Within each panel, the left pair of bars shows encapsulation of the parasitoid species used in the selection experiment itself (A.t. in the case of the A. tabida-selected lines, L.b. in the case of the L. boulardi-selected lines), the right pair of bars shows encapsulation of the other parasitoid species. Each bar is mean of four replicate lines±S.E. See Fellowes et al. (1999c) for experimental details.
As mentioned above, encapsulation and puparium formation share a common pool of resources. Therefore, selection for increased encapsulation ability could have an effect on puparium formation and thus on resistance to pupal parasitoids. However, Green (2000) found no difference in the thickness of the puparial wall of the lines selected for increased resistance against A. tabida and their controls (Fig. 5a). He also directly examined the susceptibility of the two classes of hosts to parasitoid attack by offering females of the pupal parasitoid P. vindemiae a choice between pupae from the control and selection lines. Survival of flies after exposure to parasitoids did not differ between control and selection lines (Fig. 5b), confirming equal susceptibility. These results are consistent with the lack of correlation amongst isofemale lines for resistance to larval and pupal parasitoids (Delpuech et al. 1994).

Fig. 5. (a) Puparium thickness (determined by dividing the weight of empty puparia by their surface area, assuming puparia to be ellipsoid) of Drosophila melanogaster lines selected for resistance against Asobara tabida (S, hatched bar) and control lines (C, white bar). Each bar shows mean of four replicate lines±S.E. See Green (2000) for experimental details. (b) Survival of Drosophila melanogaster lines selected for resistance against Asobara tabida (S, hatched bar) and control lines (C, white bar) after exposure of pupae to Pachycrepoideus vindemiae. Each bar shows mean of four replicate lines±S.E. See Green (2000) for experimental details.
CONCLUSION
Studies on a range of insect-parasite interactions have shown that resistance to parasites has costs. These costs can be associated with maintaining the machinery of an immune system and/or actually using it. Details of the nature and magnitude of these costs vary from system to system. Different life stages may also differ in the costs of resistance they experience. In D. melanogaster resistance against parasitoids, the costs of maintenance are mainly expressed in the larva (reduced competitive ability), whereas the costs of actual defence are most apparent in the adult (reduced size and fecundity) and pupa (thinner puparial wall and increased susceptibility to pupal parasitoids), and to a lesser extent in the larva (possibly reduced competitive ability).
In none of the insect-parasite systems studied so far have trade-offs been found between resistance to different natural enemies, such as found in the snail Lymnaea stagnalis (Rigby & Jokela, 2000): correlations were either positive or absent. In both insect-parasitoid systems we have studied, a high level of resistance against one parasitoid species does not necessarily guarantee a high level of resistance against the other. Interestingly, in D. melanogaster, it was the more specialist parasitoid that appeared harder to evolve resistance to, while with the pea aphid fewer clones were resistant to the more generalist species. So far the available evidence from insect-parasitoid systems suggests resistance and counter-resistance are graded traits without local interactions between host and parasitoid genotypes. This question has been little studied in insect-parasitoid interactions, though specificity at a genetic level in resistance against parasites has been found in, for instance, snails (Lively, 1999) and Daphnia (Carius, Little & Ebert, 2001).
Higher resistance in the host will lead to selection for increased levels of counter-defence in the parasite. Like defence, counter-defence may be costly. Very few studies have looked at this aspect of the reciprocal evolution of defence and counter-defence. In the bacteriophage T7, adaptation to a resistant strain of the bacterium E. coli led to reduced competitive ability (Chao, Levin & Stewart, 1977). In A. tabida, selection for increased ability to prevent encapsulation by D. melanogaster resulted in the parasitoid eggs becoming more embedded in host tissue, away from circulating haemocytes. Eggs of parasitoids from the selection lines hatched, on average, two and a half hours later than those of the control lines (Kraaijeveld et al. 2001a), presumably a result of lower rates of nutrients and oxygen reaching the embryo in the embedded egg. The delay in egg hatching may disadvantage the parasitoid larva if it has to compete for the host with other parasitoid larvae, of the same or a different species.
Although more studies are needed to confirm its generality, a tentative conclusion that emerges from insect-parasite systems is that costs of resistance only become apparent in situations of resource limitation, as has been found more commonly in plants (Bazzaz et al. 1987; Herms & Mattson, 1992; Bergelson & Purrington, 1996). The extent of competition for resources will often be linked to population density. Thus, density-dependent costs of defence and counter-defence directly link population dynamics and evolutionary dynamics (Hochberg & Holt, 1995; Doebeli, 1997; Sasaki & Godfray, 1999; Fellowes & Travis, 2000). Costs of defence and counter-defence are likely to play to pivotal role in the interaction between organisms and their natural enemies.
ACKNOWLEDGEMENTS
We are grateful to Mark Fellowes, Pete Futerman, Darren Green, Jens Rolff, Amy Sanders and Mike Siva-Jothy for valuable discussion.
References
ATKINSON, W. D. (1979). A field investigation of larval competition in domestic Drosophila. Journal of Animal Ecology 48, 91–102.CrossRefGoogle Scholar
BARNES, A. I. & SIVA-JOTHY, M. T. (2000). Density-dependent prophylaxis in the mealworm beetle Tenebrio molitor L. (Coleoptera: Tenebrionidae): cuticular melanization is an indicator of investment in immunity. Proceedings of the Royal Society London B 267, 177–182.Google Scholar
BAZZAZ, F. A., CHIARIELLO, N. R., COLEY, P. D. & PITELKA, L. F. (1987). Allocating resources to reproduction and defense. BioScience 37, 58–67.CrossRefGoogle Scholar
BERGELSON, J. & PURRINGTON, C. B. (1996). Surveying patterns in the cost of resistance in plants. American Naturalist 148, 536–558.CrossRefGoogle Scholar
BOOTS, M. & BEGON, M. (1993). Trade-offs with resistance to a granulosis virus in the Indian meal moth, examined by a laboratory evolution experiment. Functional Ecology 7, 528–534.CrossRefGoogle Scholar
BOULÉTREAU, M. & WAJNBERG, E. (1986). Comparative responses of two sympatric parasitoid cynipids to the genetic and epigenetic variations of the larvae of their host, Drosophila melanogaster. Entomologia Experimentalis et Applicata 41, 107–114.CrossRefGoogle Scholar
CARIUS, H. J., LITTLE, T. J. & EBERT, D. (2001). Genetic variation in a host-parasite association: potential for coevolution and frequency-dependent selection. Evolution 55, 1136–1145.CrossRefGoogle Scholar
CARTON, Y. (1984). Analyse expérimentale de trois niveaux d'interaction entre Drosophila melanogaster et le parasite Leptopilina boulardi (sympatrie, allopatrie, xénopatrie). Génétique, Sélection, Evolution 16, 417–430.CrossRefGoogle Scholar
CARTON, Y., BOULÉTREAU,
M., VAN ALPHEN, J. J. M. &
VANLENTEREN, J. C. (1986).
The Drosophila parasitic wasps. In The Genetics and Biology of
Drosophila. Volume 3e (ed. ASHBURNER, M.
CARSON, L. & THOMPSON, J. N.),
pp. 347–394. London, Academic Press.
CARTON, Y. & DAVID, J. R. (1983). Reduction of fitness in Drosophila adults surviving parasitization by a cynipid wasp. Experientia 39, 231–233.CrossRefGoogle Scholar
CARTON, Y. & KITANO, H. (1979). Changes in the hemocyte population of Drosophila larvae after single and multiple parasitization by Cothonaspis (parasitic Cynipidae). Journal of Invertebrate Pathology 34, 88–89.CrossRefGoogle Scholar
CHAO, L., LEVIN, B. R. & STEWART, F. M. (1977). A complex community in a simple habitat: experimental study with bacteria and phage. Ecology 58, 369–378.CrossRefGoogle Scholar
DE GREGORIO, E., SPELLMAN, P. T., RUBIN, G. M. & LEMAITRE, B. (2001). Genome-wide analysis of the Drosophila immune response by using oligonucleotide microarrays. Proceedings of the National Academy of Sciences, USA 98, 12590–12595.CrossRefGoogle Scholar
DELPUECH, J. M., FREY, E. & CARTON, Y. (1994). Genetic and epigenetic variation in suitability of a Drosophila host to three parasitoid species. Canadian Journal of Zoology 72, 1940–1944.CrossRefGoogle Scholar
DJAWDAN, M., CHIPPINDALE, A. K., ROSE, M. R. & BRADLEY, T. J. (1998). Metabolic reserves and evolved stress resistance in Drosophila melanogaster. Physiological Zoology 71, 584–594.Google Scholar
DOEBELI, M. (1997). Genetic variation and the persistence of predator-prey interactions in the Nicholson-Bailey model. Journal of Theoretical Biology 188, 109–120.CrossRefGoogle Scholar
DOUMS, C. & SCHMID-HEMPEL, P. (2000). Immunocompetence in workers of a social insect, Bombus terrestris L., in relation to foraging activity and parasitic infection. Canadian Journal of Zoology 78, 1060–1066.Google Scholar
DUPAS, S., BREHÉLIN, M., FREY, D. F. & CARTON, Y. (1996). Immune suppressive virus-like particles in a Drosophila-parasitoid: significance of their intraspecific morphological variations. Parasitology 113, 207–212.CrossRefGoogle Scholar
ESLIN, P., GIORDANENGO, P., FOURDRAIN, Y. & PRÉVOST, G. (1996). Avoidance of encapsulation in the absence of VLP by a braconid parasitoid of Drosophila larvae: an ultrastructural study. Canadian Journal of Zoology 74, 2193–2198.CrossRefGoogle Scholar
ESLIN, P. & PRÉVOST, G. (1998). Haemocyte load and immune resistance to Asobara tabida are correlated in species of the Drosophila melanogaster subgroup. Journal of Insect Physiology 44, 807–816.CrossRefGoogle Scholar
FELLOWES, M. D. E., KRAAIJEVELD, A. R. & GODFRAY, H. C. J. (1998a). Trade-off associated with selection for increased ability to resist parasitoid attack in Drosophila melanogaster. Proceedings of the Royal Society London B 265, 1553–1558.Google Scholar
FELLOWES, M. D. E., KRAAIJEVELD, A. R. & GODFRAY, H. C. J. (1999a). The relative fitness of Drosophila melanogaster (Diptera, Drosophilidae) that have successfully defended themselves against the parasitoid Asobara tabida (Hymenoptera, Braconidae). Journal of Evolutionary Biology 12, 123–128.Google Scholar
FELLOWES, M. D. E., KRAAIJEVELD, A. R. & GODFRAY, H. C. J. (1998b). Association between feeding rate and defence against parasitoids in Drosophila melanogaster. Evolution 53, 1302–1305.Google Scholar
FELLOWES, M. D. E., KRAAIJEVELD, A. R. & GODFRAY, H. C. J. (1999c). Cross-resistance following artificial selection for increased defence against parasitoids in Drosophila melanogaster. Evolution 53, 966–972.Google Scholar
FELLOWES, M. D. E., MASNATTA, P., KRAAIJEVELD, A. R. & GODFRAY, H. C. J. (1998b). Pupal parasitoid attack influences the relative fitness of Drosophila that have encapsulated larval parasitoids. Ecological Entomology 23, 281–284.Google Scholar
FELLOWES, M. D. E. & TRAVIS, J. M. J. (2000). Linking the coevolutionary and population dynamics of host-parasitoid interactions. Population Ecology 42, 195–203.CrossRefGoogle Scholar
FERDIG, M. T., BEERNTSEN, B. T., SPRAY, F. J., LI, J. & CHRISTENSEN, B. M. (1993). Reproductive costs associated with resistance in a mosquito-filarial worm system. American Journal of Tropical Medicine and Hygiene 49, 756–762.CrossRefGoogle Scholar
FERRARI, J., MÜLLER, C. B., KRAAIJEVELD, A. R. & GODFRAY, H. C. J. (2001). Clonal variation and covariation in aphid resistance to parasitoids and a pathogen. Evolution 55, 1805–1814.CrossRefGoogle Scholar
FRAENKEL, G. & RUDALL, K. M. (1947). The structure of insect cuticles. Proceedings of the Royal Society London B 134, 111–143.CrossRefGoogle Scholar
FULLILOVE, S. L., JACOBSON,
A. G. & TURNER, F. R.
(1977). Embryonic development: descriptive.
In The Genetics and Biology of Drosophila. Volume 2c
(ed. ASHBURNER, M. & WRIGHT,
T. R. F.),
pp. 106–209. London, Academic Press.
GODFRAY, H. C. J.
(1994). Parasitoids, Behavioral and Evolutionary
Ecology. Princeton, New Jersey,
Princeton University Press.
GREEN, D. M. (2000).
Coevolutionary dynamics in a parasitoid-host system.
University of London
HARVEY, J. A., THOMPSON, D. J. & HEYES, T. J. (1996). Reciprocal influences and costs of parasitism on the development of Corcyra cephalonica and its endoparasitoid Venturia canescens. Entomologia Experimentalis et Applicata 81, 39–45.CrossRefGoogle Scholar
HENTER, H. J. & VIA, S. (1995). The potential for coevolution in a host-parasitoid system. 1. Genetic variation within an aphid population in susceptibility to a parasitic wasp. Evolution 49, 427–438.Google Scholar
HERMS, D. A. & MATTSON, W. J. (1992). The dilemma of plants: to grow or defend. Quarterly Review of Biology 67, 283–335.CrossRefGoogle Scholar
HOANG, A. (2001). Immune response to parasitism reduces resistance of Drosophila melanogaster to desiccation and starvation. Evolution 55, 2353–2358.CrossRefGoogle Scholar
HOCHBERG, M. E. & HOLT, R. D. (1995). Refuge evolution and the population dynamics of coupled host-parasitoid associations. Evolutionary Ecology 9, 633–661.CrossRefGoogle Scholar
HUFBAUER, R. A. (2001). Pea aphid-parasitoid interactions: have parasitoids adapted to differential resistance? Ecology 82, 717–725.Google Scholar
HUFBAUER, R. A. & VIA, S. (1999). Evolution of an aphid-parasitoid interaction: variation in resistance to parasitism among aphid populations specialized on different plants. Evolution 53, 1435–1445.CrossRefGoogle Scholar
JOSHI, A. & MUELLER, L. D. (1988). Evolution of higher feeding rate in Drosophila due to density-dependent natural selection. Evolution 42, 1090–1093.CrossRefGoogle Scholar
JOSHI, A. & MUELLER, L. D. (1996). Density-dependent natural selection in Drosophila: trade-offs between larval food acquisition and utilization. Evolutionary Ecology 10, 463–474.CrossRefGoogle Scholar
KALTZ, O. & SHYKOFF, J. A. (1998). Local adaptation in host-parasite systems. Heredity 81, 361–370.CrossRefGoogle Scholar
KÖNIG, C. & SCHMID-HEMPEL, P. (1995). Foraging activity and immunocompetence in workers of the bumble bee, Bombus terrestris L. Proceedings of the Royal Society London B 260, 225–227.CrossRefGoogle Scholar
KRAAIJEVELD, A. R., EMMETT, D. A. & GODFRAY, H. C. J. (1997). Absence of direct sexual selection for parasitoid encapsulation in Drosophila melanogaster. Journal of Evolutionary Biology 10, 337–342.CrossRefGoogle Scholar
KRAAIJEVELD, A. R. & GODFRAY, H. C. J. (1997). Trade-off between parasitoid resistance and larval competitive ability in Drosophila melanogaster. Nature 389, 278–280.CrossRefGoogle Scholar
KRAAIJEVELD, A. R. & GODFRAY, H. C. J. (1999). Geographic patterns in the evolution of resistance and virulence in Drosophila and its parasitoids. American Naturalist 153, S61–S74.CrossRefGoogle Scholar
KRAAIJEVELD, A. R. & GODFRAY, H. C. J. (2001). Is there local adaptation in Drosophila-parasitoid interactions? Evolutionary Ecology Research 3, 107–116.Google Scholar
KRAAIJEVELD, A. R., HUTCHESON, K. A., LIMENTANI, E. C. & GODFRAY, H. C. J. (2001a). Costs of counterdefences to host resistance in a parasitoid of Drosophila. Evolution 55, 1815–1821.Google Scholar
KRAAIJEVELD, A. R., LIMENTANI, E. C. & GODFRAY, H. C. J. (2001b). Basis of the trade-off between parasitoid resistance and larval competitive ability in Drosophila melanogaster. Proceedings of the Royal Society London B 268, 259–261.Google Scholar
KRAAIJEVELD, A. R. & VAN ALPHEN, J. J. M. (1994). Geographical variation in resistance of the parasitoid Asobara tabida against encapsulation by Drosophila melanogaster larvae: the mechanism explored. Physiological Entomology 19, 9–14.CrossRefGoogle Scholar
KRAAIJEVELD, A. R., VAN ALPHEN, J. J. M. & GODFRAY, H. C. J. (1998). The coevolution of host resistance and parasitoid virulence. Parasitology 116 (Suppl.), S29–S45.CrossRefGoogle Scholar
KRAAIJEVELD, A. R. & VAN DER WEL, N. N. (1994). Geographic variation in reproductive success of the parasitoid Asobara tabida in larvae of several Drosophila species. Ecological Entomology 19, 221–229.CrossRefGoogle Scholar
KURTZ, J., WIESNER, A., GÖTZ, P. & SAUER, K. P. (2000). Gender differences and individual variation in the immune system of the scorpionfly Panorpa vulgaris (Insecta: Mecoptera). Developmental and Comparative Immunology 24, 1–12.CrossRefGoogle Scholar
LENSKI, R. E. (1988). Experimental studies of pleiotropy and epistasis in Escherichia coli. I. Variation in competitive fitness among mutants resistant to virus T4. Evolution 42, 425–432.Google Scholar
LIVELY, C. M. (1999). Migration, virulence and the geographic mosaic of adaptation by parasites. American Naturalist 153, S34–S47.CrossRefGoogle Scholar
MCKEAN, K. A. & NUNNEY, L. (2001). Increased sexual activity reduces male immune function in Drosophila melanogaster. Proceedings of the National Academy of Sciences, USA 98, 7904–7909.CrossRefGoogle Scholar
MILNER, R. J. (1982). On the occurrence of pea aphids, Acyrthosiphon pisum, resistant to isolates of the fungal pathogen Erynia neoaphidis. Entomologia Experimentalis et Applicata 32, 23–27.CrossRefGoogle Scholar
MORET, Y. & SCHMID-HEMPEL, P. (2000). Survival for immunity: the price of immune activation for bumblebee workers. Science 290, 1166–1168.CrossRefGoogle Scholar
MORET, Y. & SCHMID-HEMPEL, P. (2001). Immune defence in bumble-bee offspring. Nature 414, 506.CrossRefGoogle Scholar
MÜLLER, C. B., ADRIAANSE, I. C. T., BELSHAW, R. & GODFRAY, H. C. J. (1999). The structure of an aphid-parasitoid community. Journal of Animal Ecology 68, 346–370.CrossRefGoogle Scholar
NAPPI, A. (1975).
Parasite encapsulation in insects. In Invertebrate Immunity
(ed. MARAMOROSCH, K. & SHOPE, R.),
pp. 293–326. New York, Academic Press.CrossRef
NAPPI, A. J., CARTON, Y. & FREY, F. (1991). Parasite-induced enhancement of hemolymph tyrosine activity in a selected immune reactive strain of Drosophila melanogaster. Archives of Insect Biochemistry and Physiology 18, 159–168.CrossRefGoogle Scholar
NAPPI, A. & VASS, E. (1998). Hydrogen peroxide production in immune-reactive Drosophila melanogaster. Journal of Parasitology 84, 1150–1157.CrossRefGoogle Scholar
NAPPI, A., VASS, E., FREY, F. & CARTON, Y. (1995). Superoxide anion generation in Drosophila during melanotic encapsulation of parasites. European Journal of Cell Biology 68, 450–458.Google Scholar
PENER, M. & YERUSHALMI, Y. (1998). The physiology of locust phase polymorphism: an update. Journal of Insect Physiology 44, 365–377.CrossRefGoogle Scholar
REESON, A. F., WILSON, K., GUNN, A., HAILS, R. S. & GOULSON, D. (1998). Baculovirus resistance in the noctuid Spodoptera exempta is phenotypically plastic and responds to population density. Proceedings of the Royal Society London B 265, 1787–1791.CrossRefGoogle Scholar
REZNICK, D. (1985). Cost of reproduction: an evaluation of the empirical evidence. Oikos 44, 257–267.CrossRefGoogle Scholar
RIGBY, M. C. & JOKELA, J. (2000). Predator avoidance and immune defence: costs and trade-offs in snails. Proceedings of the Royal Society London B 267, 171–176.CrossRefGoogle Scholar
RIZKI, R. M. & RIZKI, T. M. (1990). Parasitoid virus-like particles destroy Drosophila cellular immunity. Proceedings of the National Academy of Sciences, USA 87, 8388–8392.CrossRefGoogle Scholar
RIZKI, T. M. & RIZKI,
R. M. (1984).
The cellular defence system of Drosophila melanogaster.
In Insect Ultrastructure (ed. KING, R. C.
& AKAI, H.),
pp. 579–603. New York, Plenum Press.CrossRef
RYDER, J. J. & SIVA-JOTHY, M. T. (2000). Male calling song provides a reliable signal of immune function in a cricket. Proceedings of the Royal Society London B 267, 1171–1175.CrossRefGoogle Scholar
SANDSTRÖM, J. (1994). High variation in host adaptation among clones of the pea aphid, Acyrthosiphon pisum on peas, Pisum sativum. Entomologia Experimentalis et Applicata 71, 245–256.CrossRefGoogle Scholar
SANDSTRÖM, J. & PETTERSON, J. (1994). Amino acid composition of phloem sap and the relation to interspecific variation in pea aphid (Acyrthosiphon pisum) performance. Journal of Insect Physiology 38, 93–99.Google Scholar
SASAKI, A. & GODFRAY, H. C. J. (1999). A model for the coevolution of resistance and virulence in coupled host-parasitoid interactions. Proceedings of the Royal Society London B 266, 455–463.CrossRefGoogle Scholar
SHELDON, B. & VERHULST, S. (1996). Ecological immunity: costly parasite defences and trade-offs in evolutionary ecology. Trends in Ecology and Evolution 11, 317–321.CrossRefGoogle Scholar
SIVA-JOTHY, M. T. (2000). A mechanistic link between parasite resistance and expression of a sexually selected trait in a damselfly. Proceedings of the Royal Society London B 267, 2523–2527.CrossRefGoogle Scholar
SIVA-JOTHY, M. T., TSUBAKI, Y. & HOOPER, R. E. (1998). Decreased immune response as a proximate cost of copulation and oviposition in a damselfly. Physiological Entomology 23, 274–277.CrossRefGoogle Scholar
SIVA-JOTHY, M. T., TSUBAKI, Y., HOOPER, R. E. & PLAISTOW, S. J. (2001). Investment in immune function under chronic and acute immune challenge in an insect. Physiological Entomology 26, 1–5.Google Scholar
STARÝ, P., GONZÁLEZ, D. & HALL, J. C. (1980). Aphidius eadyi n. sp. (Hymenoptera: Aphidiidae), a widely distributed parasitoid of the pea aphid, Acyrtosiphon pisum (Harris) in the Palearctic. Entomologica Scandinavica 11, 473–480.Google Scholar
STEARNS, S. C. (1992).
The Evolution of Life Histories. Oxford, Oxford University
Press.
STRAND, M. R. & PECH, L. L. (1995). Immunological basis for compatibility in parasitoid-host relationships. Annual Review of Entomology 40, 31–56.CrossRefGoogle Scholar
TEPASS, U., FESSLER, L. I., AZIZ, A. & HARTENSTEIN, V. (1994). Embryonic origin of hemocytes and their relationship to cell death in Drosophila. Development 120, 1829–1837.Google Scholar
TIËN, N. S. H., BOYLE, D., KRAAIJEVELD, A. R. & GODFRAY, H. C. J. (2001). Competitive ability of parasitized Drosophila larvae. Evolutionary Ecology Research 3, 747–757.Google Scholar
VERHULST, S., DIELEMAN, S. J. & PARMENTIER, H. K. (1999). A trade-off between immunocompetence and sexual ornamentation in domestic fowl. Proceedings of the National Academy of Sciences, USA 96, 4478–4481.CrossRefGoogle Scholar
VIA, S. (1991a). The genetic structure of host plant adaptation in a spatial patchwork – demographic variability among reciprocally transplanted pea aphid clones. Evolution 45, 827–852.Google Scholar
VIA, S. (1991b). Specialized host plant performance of pea aphid clones is not altered by experience. Ecology 72, 1420–1427.Google Scholar
VIA, S. (1999). Reproductive isolation between sympatric races of pea aphids. I. Gene flow restriction and habitat choice. Evolution 53, 1446–1457.Google Scholar
VIA, S., BOUCK, A. C. & SKILLMAN, S. (2000). Reproductive isolation between divergent races of pea aphids on two hosts. II. Selection against migrants and hybrids in the parental environments. Evolution 54, 1626–1637.Google Scholar
WAJNBERG, E., BOULÉTREAU, M., PRÉVOST, G. & FOUILLET, P. (1990). Developmental relationships between Drosophila larvae and their endoparasitoid Leptopilina (Hymenoptera: Cynipidae) as affected by crowding. Archives of Insect Biochemistry and Physiology 13, 239–245.CrossRefGoogle Scholar
WEBSTER, J. P. & WOOLHOUSE, M. E. J. (1999). Cost of resistance: relationship between reduced fertility and increased resistance in a snail-schistosome host-parasite system. Proceedings of the Royal Society London B 266, 391–396.CrossRefGoogle Scholar
WILSON, K., COTTER, S. C., REESON, A. F. & PELL, J. K. (2001). Melanism and disease resistance in insects. Ecology Letters 4, 637–649.CrossRefGoogle Scholar
YAN, G., SEVERSON, D. W. & CHRISTENSEN, B. M. (1997). Costs and benefits of mosquito refractoriness to malaria parasites: implications for genetic variability of mosquitoes and genetic control of malaria. Evolution 51, 441–450.CrossRefGoogle Scholar
ZAREH, N., WESTOBY, M. & PIMENTEL, D. (1980). Evolution in a laboratory host-parasitoid system and its effects on population kinetics. Canadian Entomologist 112, 1049–1106.CrossRefGoogle Scholar

Fig. 1. Correlation amongst Acyrthosiphon pisum clones between susceptibility to Aphidius ervi and offspring production on (a) good and (b) poor quality host plants. See Ferrari et al. (2001) for experimental details.
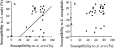
Fig. 2. Correlation amongst Acyrthosiphon pisum clones between susceptibility to Aphidius ervi and susceptibility to (a) A. eadyi or to (b) Erynia neoaphidis. The open circles in (a) are the clones that do not mummify after attack by A. eadyi which fail to reproduce. The susceptibility values to E. neoaphidis are an index. See Ferrari et al. (2001) for experimental details.

Fig. 3. Competitive ability (relative to a reference strain of fly) at different levels of larval competition of Drosophila melanogaster lines selected for resistance against parasitoids (hatched bars) and their respective control lines (white bars). Left panel shows results of selection experiments using Asobara tabida; right panel shows results using Leptopilina boulardi. Each bar is mean of four replicate lines±S.E.; competitive ability is calculated as ln(e/(r+1)), where e is the number of surviving experimental (control or selection) flies and r the number of surviving reference flies; ‘no’, ‘low’, ‘int’ and ‘high’ levels of competition refer to 30 larvae on, respectively, 0.4, 0.2, 0.1 and 0.05 ml of a yeast suspension. See Kraaijeveld & Godfray (1997) for experimental details.

Fig. 4. Cross-resistance (measured by percentage encapsulation) by Drosophila melanogaster lines selected for resistance against either Asobara tabida or Leptopilina boulardi (S, hatched bars) and their respective control lines (C, white bars). Left panel shows results of selection experiments using A. tabida; right panel shows results using L. boulardi. Within each panel, the left pair of bars shows encapsulation of the parasitoid species used in the selection experiment itself (A.t. in the case of the A. tabida-selected lines, L.b. in the case of the L. boulardi-selected lines), the right pair of bars shows encapsulation of the other parasitoid species. Each bar is mean of four replicate lines±S.E. See Fellowes et al. (1999c) for experimental details.

Fig. 5. (a) Puparium thickness (determined by dividing the weight of empty puparia by their surface area, assuming puparia to be ellipsoid) of Drosophila melanogaster lines selected for resistance against Asobara tabida (S, hatched bar) and control lines (C, white bar). Each bar shows mean of four replicate lines±S.E. See Green (2000) for experimental details. (b) Survival of Drosophila melanogaster lines selected for resistance against Asobara tabida (S, hatched bar) and control lines (C, white bar) after exposure of pupae to Pachycrepoideus vindemiae. Each bar shows mean of four replicate lines±S.E. See Green (2000) for experimental details.
 You have
Access
- 104
- Cited by