I. INTRODUCTION
Efficient production of H2 is proposed to be one of the ideal routes for development of sustainable and clean energy. However, about 95% of the hydrogen production nowadays is from fossil fuels such as natural gas and coal, mainly by steam reforming,Reference Balat and Kirtay1 which consumes large amounts of additional energy. One of the promising alternative routes of hydrogen generation from clean and renewable energy sources is the photocatalytic hydrogen production using semiconductor catalysts.
Among the semiconductor materials, TiO2 is one of the most commonly investigated metal oxides. Being cheap, innocuity, environmental friendly, TiO2 has been widely used as a pigment in sunscreens, paints, ointments, toothpaste, and catalysts.Reference Chen and Mao2 In the recent few decades, TiO2 as the most famous photocatalyst has received extensive attention. A great effort has been made to improve the photocatalytic H2 production activity on the TiO2-based materials, as it is still in a lower efficiency compared with traditional H2 production reactions.
It has been well demonstrated that the crystalline phase of TiO2 plays a significant role in catalytic reactions, especially in photocatalysis. It is commonly believed that anatase phase is more active than the rutile phase in photocatalytic reactions.Reference Chiarello, Di Paola, Palmisano and Selli3, Reference Tong, Zhang, Tian, Chen and He4 However, an interesting result is that the photocatalytic activity of TiO2 with mixed phase structure (e.g., P25) is more active than either of the individual phase.Reference Tanaka, Hisanaga and Rivera5–Reference Zhang, Chen and Li7 It is proposed that the formation of the surface phase junction between anatase and rutile is responsible for the enhanced photocatalytic activity, as this junction can facilitate the charge separation.Reference Zhang, Xu, Feng, Li and Li8 Therefore, the preparation of TiO2 with mixed phase structure remains an interesting topic.
TiO2 with different phase structure can be prepared via a calcination treatment of commercial TiO2 (P25) at different temperatures.Reference Xu, Ma, Zhang, Wang, Feng and Li9 Usually, the high temperature treatment is required for the semiconductor photocatalyst, which can enhance the activity of photocatalytic reactions due to the high crystallinity of the catalysts. However, the anatase phase will totally transform into rutile phase at high temperatures. Recently, we found that the addition of sulfate can inhibit the phase transformation of TiO2 and thus, different phase structures of TiO2 can be obtained at the same high temperatures with various amount of sulfate.Reference Ma, Xu, Zong, Wang, Wu, Wang and Li10 This catalysts can greatly enhance the H2 production activity via photocatalytic methanol reforming compared with P25. So, it is interesting to know whether other additives can affect the phase structure and/or the H2 production activity of TiO2. Therefore, in this work, we systematically investigated the effects of salt additives with various anions on the phase transformation of TiO2, and the photocatalytic H2 production activity has also been investigated.
II. EXPERIMENTAL SECTION
A. Catalyst preparation
All reagents used in the investigations are of analytical grade without further purification. TiO2 samples were prepared using an impregnation method. The commercially available TiO2 (Degussa P25) was dispersed uniformly in the aqueous solution containing NaNO3, NaHCO3, Na2SO4, Na3PO4, Na2SiO3, and Na2MoO4, respectively. The amount of the additives was 0.1 mmol per gram of TiO2. The formed slurry samples were left overnight and continuously stirred for sufficient impregnation before they were dried in the water bath. Then, the samples were kept in an oven at 80 °C for 3 h. After that, the samples were grounded and calcined in a muffle furnace at 700 °C for 3 h. The as-prepared samples are denoted as TiO2(A), where A indicates the corresponded additives. For the purpose of comparison, P25 was treated in deionized water instead of salt solution denoted as TiO2(H2O).
B. Photocatalytic activity test
Experiments on photocatalytic reaction were carried out in a Pyrex reaction cell, which was connected to a closed gas circulation and a vacuum system. A 300 W top-irradiated xenon lamp was used as a light source. Before illumination, the system was deaerated by evacuation to remove the air from the system. Typically, 0.1 g of catalyst was suspended in a 200 mL of methanol solution (20 vol%). 0.05 wt% Pt was loaded as a cocatalyst on TiO2 at the very beginning of the reaction by an in situ photodeposition method from the precursor H2PtCl6·6H2O solution (0.37 mg Pt/mL) under irradiation. The amount of the additives in the reaction solution was 0.01 mmol if necessary, which was equal to the amount of the additives in the preparation of TiO2(A). Hydrogen produced in the reaction was measured by a thermal conductivity detector on an online gas chromatography, and CO was detected by a flame ionization detector after it was converted into CH4 in a methanator. During the experiments, the sampling and online analyzing were performed once an hour.
C. Catalyst characterization
The phase compositions of the samples were characterized using x-ray diffraction (XRD), which were obtained on a Rigaku D/Max-2500/PC (Rigaku, Tokyo, Japan) powder diffraction system with a Cu Kα radiation source (40 kV and 100 mA) at room temperature. Diffraction patterns were collected from 20° to 80° at a rate of 5°/min. Transmission electron microscopy (TEM) images were obtained using a Tecnai G2 Spirit (FEI Company, Brno, Czech Republic) at an acceleration voltage of 120 kV. Infrared (IR) spectra of pyridine adsorption were measured with a resolution of 4 cm−1 and 16 scans on a Fourier transform IR spectrometer (Nicolet NEXUS 470, Thermo Nicolet, Madison, WI). The experiments were carried out in a special IR cell in conjunction with a water-cooling system and a vacuum system. There are several steps in the experimental procedure. The sample, typically 20 mg of titania, was first pressed into a self-supporting thin wafer (15 mm diameter) and then, it was moved into the sample holder of the IR cell. The wafer in the IR cell was evacuated at 573 K for 1 h to remove the impurities in the cell and then, the background spectrum of the sample was recorded. After introducing the pyridine vapor for 15 min, the wafer was degassed under vacuum conditions at 423 K for 30 min before the spectrum was recorded.
III. RESULTS AND DISCUSSION
A. Phase composition and morphology of the TiO2
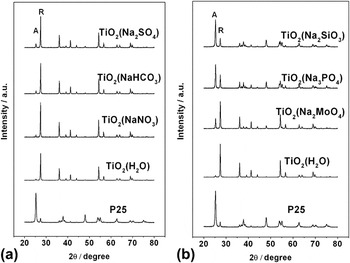
Figure 1 shows the XRD patterns of P25 and the samples prepared using different additives. The “A” and “R” in the figures denote the anatase and rutile phases, respectively. As shown in Fig. 1(a), about 87% of P25 was composed of anatase phase.Reference Ma, Xu, Zong, Wang, Wu, Wang and Li10 After impregnated in H2O and calcinated at 700 °C for 3 h, the anatase phase in TiO2(H2O) nearly disappeared, which indicated a complete phase transformation from anatase to rutile. However, in the presence of some additives such as Na2SO4, NaHCO3, NaNO3, the anatase phase was still detected and the amount of anatase phase remained was in the order: NaNO3 < NaHCO3 < Na2SO4. These additives can slightly retard the phase transformation from anatase to rutile; namely, some anatase phase can be retained in the samples after calcinations at high temperatures. Figure 1(b) displays that a large amount of the anatase phase can be maintained using Na3PO4, Na2SiO3, and Na2MoO4 as additives; the anatase phase remained was in the order: Na2MoO4 < Na3PO4 < Na2SiO3. Apparently, these additives show their strong ability in controlling the phase transformation. Especially for Na2SiO3, almost all the anatase phase in P25 remained after calcination at 700 °C.
XRD patterns of (a) P25, TiO2(H2O), TiO2(NaNO3), TiO2(NaHCO3), TiO2(Na2SO4) and (b) P25, TiO2(H2O), TiO2(Na2MoO4) TiO2(Na3PO4), TiO2(Na2SiO3).

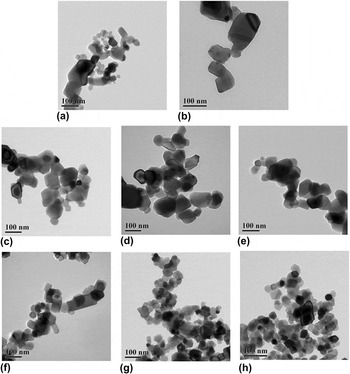
As we know, anatase and rutile are the most common phases of TiO2. The rutile phase is more thermodynamically stable compared with the anatase phase. Therefore, during the high temperature calcination, the anatase phase will transform into the rutile phase, the more stable phase structure of TiO2. Usually, the phase transformation of TiO2 is initiated from the solid-state reaction between the anatase particles in the agglomerated TiO2 particles.Reference Zhang, Li, Feng, Chen and Li11 Thus, the phase transformation of TiO2 accompanied by the growth of particles size. This phenomenon was further confirmed in this work. Figure 2(a) shows the morphology of P25. The smaller particles around 25 nm were the anatase phase and the large particles around 100 nm were the rutile. For TiO2(H2O), almost all the particles were around 100 nm, which indicated that the particles were dominated by the rutile phase. For TiO2(NaNO3), TiO2(NaHCO3), and TiO2(Na2SO4) [shown in Figs. 2(c)–2(e), respectively], particles around 30 nm appeared, and these particles usually dispersed on the edge of the larger ones and even grew together. The phase junction can be formed between these intimate contacted anatase and rutile particles. For TiO2(Na2MoO4), TiO2(Na3PO4), and TiO2(Na2SiO3), more and more particles around 30 nm appeared [shown in Figs. 2(f)–2(h)], indicating the increased amount of anatase phase in these samples.
TEM images of (a) P25, (b) TiO2(H2O), (c) TiO2(NaNO3), (d) TiO2(NaHCO3), (e) TiO2(Na2SO4), (f) TiO2(Na2MoO4), (g) TiO2(Na3PO4), and (h) TiO2(Na2SiO3).

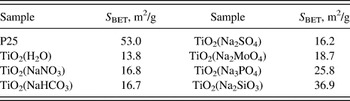
The BET surface areas (the surface areas of the samples were analyzed based on the BET equation) of the samples also demonstrate that the particles size and the composition of the phase structure are interrelated. As shown in Table I, the largest surface area, up to 53.0 m2/g, was obtained of P25 with the most anatase content. After the impregnation in H2O and treatment at 700 °C for 3 h, the anatase phase of TiO2(H2O) nearly disappeared and the surface area dramatically decreased to 13.8 m2/g. Similarly, the addition of NaNO3, NaHCO3, and Na2SO4 could slightly increase the anatase content in TiO2 and could also slightly increase the surface area to a similar value, around 16.5 m2/g. Na2MoO4, Na3PO4, and Na2SiO3 could further increase the anatase content and their surface areas correspondingly increased to 18.7, 25.8, and 36.9 m2/g, respectively.
The BET surface areas (S BET) of the samples.Footnote a

a Except for P25, all the samples were prepared by impregnation method followed by a calcination at 700 °C for 3 h.
It is proposed that the defect sites on the surface of TiO2 may become the phase transformation centers.Reference Zhang, Li, Feng, Chen and Li11 When anatase particles get close to each other during the high temperature calcination, the phase transformation can easily initiate from the defect sites between the particles. If the surface of TiO2 is covered with the additives, the opportunity of the “real contact” of the particles decreases and consequently, the phase transformation can be retarded. Otherwise, actually, the defect sites on the TiO2 are saturated with the adsorbed additives. When the defect sites are deactivated by these additives, the solid-state reaction is inhibited and consequently, the phase transformation from anatase to rutile is retarded. Apparently, different additives can have different affinities to coordinate the defect sites. Thanks to this, we can obtain the various phase structure of TiO2 by these additives.
B. Photocatalytic H2 production activity
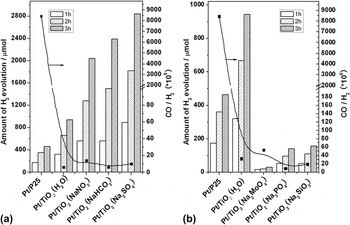
Figure 3 shows the photocatalytic activity in H2 production on Pt/P25 with and without pretreatment. Pt/P25 exhibited the lowest H2 evolution rate. The H2 evolution rate was significantly enhanced on Pt/TiO2(Na2SO4), Pt/TiO2(NaHCO3), and Pt/TiO2(NaNO3). Pt/TiO2(Na2SO4) was reported as a good catalyst for H2 production due to the appropriate phase structure tuned by Na2SO4 in our previous work.Reference Ma, Xu, Zong, Wang, Wu, Wang and Li10 XRD patterns showed that NaHCO3 and NaNO3 could also affect the phase structure of TiO2 and slightly increased the amount of anatase phase in the catalysts. That is to say, the amount of anatase–rutile phase junction on the TiO2 surface can be increased, which is similar to the function of Na2SO4. Therefore, the improvement of H2 production of Pt/TiO2(NaHCO3) and Pt/TiO2(NaNO3) can be due to the change of the phase structure tuned by NaHCO3 and NaNO3.
H2 production activity and the molar ratio of CO/H2 for (a) Pt/P25, Pt/TiO2(H2O), Pt/TiO2(NaNO3), Pt/TiO2(NaHCO3), Pt/TiO2(Na2SO4) and (b) Pt/P25, Pt/TiO2(H2O), Pt/TiO2(Na2MoO4), Pt/TiO2(Na3PO4), Pt/TiO2(Na2SiO3). Reaction conditions: catalyst, 0.1 g; cocatalyst, 0.05 wt% Pt; methanol solution, 200 mL (20 vol%); light source, Xe lamp (300 W).

On the other hand, the results displayed in Fig. 3(b) showed the negative effect of additives on the H2 production rate of Pt/TiO2(Na2MoO4), Pt/TiO2(Na3PO4), and Pt/TiO2(Na2SiO3). These catalysts showed a dramatically decreased activity even compared with Pt/P25.
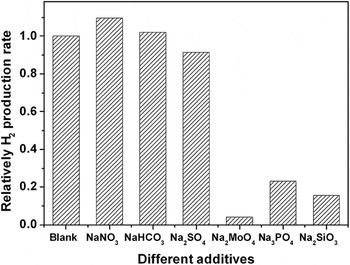
Usually, if only considering the phase structure [shown in Fig. 1(b)], the activity should not be so low. Thus, it is worthwhile to understand the effect of these additives on the reaction. NaNO3 and NaHCO3 are unstable at high temperature calcination. NO3− can decompose into NOx, while HCO3− can decompose into CO32−. Other additives are all stable and will not decompose at 700 °C. The photocatalytic reactions with addition of these additives into the reaction solution were carried out. The blank experiment was performed for Pt/TiO2(H2O). The effects of adding NaNO3, NaHCO3, Na2SO4, Na3PO4, Na2SiO3, and Na2MoO4 in the reaction solution using Pt/TiO2(H2O) as the photocatalyst were performed respectively under the same experimental conditions. Figure 4 displays the relative rate of H2 production for the catalysts with different additives, as the activity of the blank reaction is normalized to unit. For NaNO3, NaHCO3, Na2SO4, there was no obvious difference in the addition of these additives, which demonstrated that the presence of these additives in the reaction solution did not affect the activity. Therefore, the great enhancement of H2 production shown in Fig. 3(a) is mainly ascribed to the change in the surface phase structure of TiO2 tuned by these sodium salts. However, for Na3PO4, Na2SiO3, and Na2MoO4, the H2 production activity was greatly decreased. In fact, inorganic ions in the reaction solution can adsorb on the surface of TiO2 with different affinity. It was found that the affinity between TiO2 and inorganic ions increased in the orderReference Chen, Zahraa and Bouchy12–Reference Li, Lu and Li15: NO3− < HCO3−, CO32− < SO42− < H2PO4−, HPO42−. Apparently, the affinity of NO3−, HCO3−, CO32−, and SO42− was not strong enough to effect adsorption of CH3OH on the surface of TiO2, as most of these anions can dissolve into the reaction solution. However, some research found that the adsorption of H2PO4− on TiO2 even exists as a partly covalent bond.Reference Li, Lu and Li15 The strong affinity between phosphates and TiO2 can effectively prevent the phosphates leaving from the surface of TiO2 and seriously affect the adsorption of CH3OH molecule. It is proposed that Na2MoO4 and Na2SiO3 may also affect the adsorption of CH3OH molecule or occupy the active sites on TiO2. Therefore, the photocatalytic activity of these catalysts was dramatically decreased.
Relatively H2 production rate of TiO2(H2O) with different additives in the reaction solution (as the H2 production rate of the blank reaction is normalized to unit). Reaction conditions: catalyst, 0.1 g of TiO2–H2O; cocatalyst, 0.05 wt% Pt; additives, 0.01 mmol; methanol solution, 200 mL (20 vol%); light source, Xe lamp (300 W).

C. Suppressed CO production versus the surface acidity of the catalysts
CO is a by-product in the reaction of photocatalytic H2 production via methanol reforming. However, for the application of H2 in the fuel cell, the CO concentration in the H2 steam is rigorously limited.Reference Zhang, Liu and Goodwin16, Reference Bellows, MarucchiSoos and Buckley17 As shown in Fig. 3, the highest value of CO/H2 was up to several thousands of ppm for Pt/P25. When the catalyst had been calcined at high temperatures with or without the additives, the ratio of CO/H2 could drop by two orders of magnitude. The lowest value of CO/H2 could be down to less than 10 ppm.
It is proposed that CO is formed at the defect sites on the surface of TiO2 via dehydration reaction of the intermediate formic acid species. The high temperature calcination should decrease the defects in TiO2. Therefore, the structure with fewer defects of these catalysts may be the reason for the decreased CO production. On the other hand, the different surface acidity/basicity properties are also critical factors for CO production. For HCOOH decomposition, basic oxides will lead to the production of H2 and CO2, while acidic oxides lead to H2O and CO production.Reference Mars, Scholten and Zwietering18, Reference Uemura, Taniike, Tada, Morikawa and Iwasawa19 Thus, the surface acidity of these catalysts could be important to the CO formation.
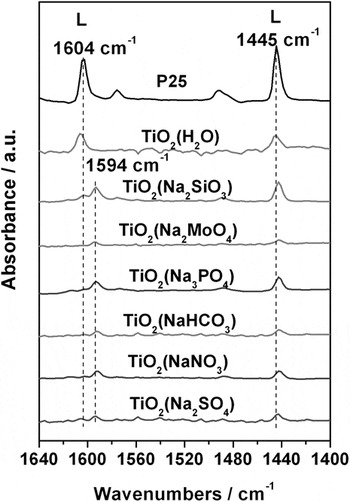
IR spectroscopy of pyridine adsorption was used to characterize the acidity of the samples. As presented in Fig. 5, for P25, two dominant peaks at 1640 and 1445 cm−1 together with other smaller peaks at 1575 and 1491 cm−1 were observed. All these peaks are assigned to the vibrations of pyridine adsorbed on Lewis acid sites on TiO2.Reference Mars, Scholten and Zwietering18, Reference Uemura, Taniike, Tada, Morikawa and Iwasawa19 For TiO2(A) (A indicates the additives except for H2O), a peak at 1594 cm−1 appeared. This peak may correspond to the acid sites related to these additives, as it was absent in the spectra of P25 or TiO2(H2O). It was clearly shown that, compared with P25, all the peaks of the samples were dramatically decreased or even totally disappeared, suggesting the sharp decrease in acid sites on TiO2(A). As mentioned above, oxide with more acidity is in favor of CO production. Therefore, P25 with higher surface acidity is apt for the high CO production, while other catalysts with much lower acidity can obtain the extremely low CO concentration.
IR spectra of pyridine adsorption on P25, TiO2(H2O), and TiO2(A) [TiO2(A) indicates the TiO2 with different additives].

IV. CONCLUSIONS
TiO2 with different phase compositions was prepared by controlling the phase transformation using different additives calcined at high temperatures. The phase structure can be slightly changed with the additives NaNO3, NaHCO3, and Na2SO4 compared with TiO2(H2O). These catalysts with small amounts of anatase particles on the surface of rutile can obviously enhance the H2 production activity via photocatalytic reforming of methanol. It is proposed that the high crystallinity and the anatase–rutile phase junction formed on these catalysts are responsible for the high H2 production activity. On the other hand, the sharply decreased activity was found in the presence of the additives such as Na3PO4, Na2SiO3, and Na2MoO4 due to the strong affinity between the anions and TiO2, although they have the stronger ability to inhibit the phase transformation of TiO2. Moreover, all the catalysts prepared with and without the additives show the positive effect in suppressing CO production in the photocatalytic reactions, which might be attributable to the reduced defects and acid sites derived on the TiO2.
ACKNOWLEDGMENTS
We acknowledge the financial support for this work from the National Natural Science Foundation of China (Grant No. 20673112), the National Basic Research Program of China (Grant No. 2009CB220010), and the Solar Energy Project of Chinese Academy of Sciences (Grant No. KGCX2-YW-391-1).