


Introduction
In the early phase of the COVID-19 pandemic, state and local governments in the United States (U.S.) relied heavily on nonpharmaceutical interventions (NPIs), e.g., business closures, mask mandates, and limits on social gatherings to mitigate its impact. Evaluating how these measures were associated with changes in transmission remains important for understanding their potential role in future public health responses.
Delaware provides a setting in which statewide policy interventions were implemented within a relatively small population of approximately 1 million residents distributed across 3 counties. Most major NPIs were implemented statewide during 2020. While policies were largely uniform across Delaware, counties differ in population density, demographic composition, and economic activity. These differences provide an opportunity to assess whether transmission patterns and policy-associated changes varied across counties within the state.
Delaware consists of three counties with distinct geographic and demographic characteristics (Figure S1). New Castle County is the most populous and urbanized and includes Wilmington as part of the greater Philadelphia metropolitan area. Kent County contains the state capital of Dover and has a mixed urban–rural character. Sussex County is the largest by area and least densely populated, with an economy largely driven by agriculture and seasonal tourism.
The objectives of this analysis were 3-fold. First, we estimated the time-varying reproduction number (Rt) for Delaware statewide and for each of its 3 counties from March 2020 through March 2023. Second, we quantified changes in Rt associated with 5 major policy interventions implemented during 2020. Third, we examined differences in transmission dynamics and policy-associated patterns in 2020 across counties.
Methods
Daily confirmed COVID-19 case counts were obtained from the Johns Hopkins University Center for Systems Science and Engineering COVID-19 Data Repository for all 3 Delaware counties from March 11, 2020, through March 1, 2023, and were aggregated to produce statewide totals for analysis. 1 Reported incident case count data contain known reporting artifacts, including negative values resulting from retrospective corrections and zero counts associated with reporting delays. To address these issues, negative daily case counts were imputed using a 7-day centered average, and isolated zero counts inconsistent with surrounding trends were smoothed to reduce artificial variability.
Rt, defined as the average number of secondary infections generated by an infected individual at time t, was estimated using a deconvolution-based approach that accounts for delays between infection and case reporting. Incident infections were reconstructed using flexible spline-based models, and uncertainty in the reconstructed infection curves was represented through multiple realizations generated using a Poisson-distributed multiplier of 4. Rt was estimated from March 2020 through March 2023 using the EpiEstim R package, which applies a Bayesian framework with a gamma-distributed serial interval.Reference Cori, Ferguson and Fraser 2 A mean serial interval of 4.6 days and a standard deviation of 5.55 days (based on an early-pandemic serial interval distribution) were specified, and posterior sampling was used to generate 95% credible intervals (CrIs).Reference You, Deng and Hu 3 To assess the robustness of Rt estimates to alternative modeling assumptions, sensitivity analyses were conducted by applying an Omicron-specific serial interval distribution (mean 2.9 days, SD 1.64 days), the underreporting multiplier (λ = 2 and λ = 6 versus baseline λ = 4), and the infection-to-reporting delay distribution (shifted ±2 days).Reference Park, Sun and Abbott 4
Analysis of policy-associated changes in Rt was restricted to 2020. Five major policy changes implemented in Delaware between March and December 2020 were included. On April 2, 2020, the state introduced limits on social gatherings and required the closure of nonessential businesses (Policy A). On April 28, 2020, a statewide public mask mandate was established (Policy B). On June 1, 2020, Phase 1 reopening began, including the lifting of the mandatory 14-day quarantine for out-of-state travelers (Policy C). On September 8, 2020, the school year began with hybrid in-person and remote instruction (Policy D). On December 14, 2020, a stay-at-home advisory and overnight curfew was established (Policy E). For each policy transition, analysis windows were defined for periods before and after implementation, and percentage changes in Rt were calculated from the posterior distributions of Rt estimates across consecutive policy periods. Table S1 presents a chronology of NPIs and pharmacological interventions implemented in Delaware in 2020.
All analyses were performed using R statistical software (version 4.5.2). Supplementary File S1 contains the supplementary methods, figures, tables, and references. The complete code for this analysis is provided in Supplementary File S2 (scripts written in R Markdown format) and Supplementary File S3 (custom R functions).
Results
Figure 1 presents reported and deconvolved daily COVID-19 case counts, deconvolved estimates of incident infections, and time-varying Rt estimates for Delaware statewide from March 2020 through March 2023. Multiple waves were observed, including increases in spring 2020, winter 2020-2021, winter 2021-2022, mid-2022, and winter 2022-2023; the largest statewide peak in both reported cases and estimated infections occurred in winter 2021-2022. Deconvolved infection estimates followed the same temporal pattern as reported cases and exhibited higher peaks during major surges. Statewide Rt estimates varied over time and were frequently near 1.0, with periods of increasing estimated infections coinciding with Rt values above 1.0 and periods of declining infections coinciding with Rt values below 1.0. The width of the 95% CrIs was greater early in the epidemic and during periods of rapid change in Rt. Sensitivity analyses yielded Rt trajectories similar to those of the primary analysis (Figures S2-S4).
Statewide COVID-19 transmission dynamics in Delaware, March 2020-March 2023. (A) Daily incident case counts (points) compared with the smoothed, deconvolved case trajectory (solid line). (B) Estimated daily number of new infections. (C) Estimated time-varying reproduction number (Rt). In (B) and (C), solid lines represent median estimates, and shaded ribbons indicate 95% credible intervals (CrI). The dashed horizontal line in (C) denotes the epidemic threshold (Rt = 1.0).

Figure 1. Long description
Three vertically stacked line graphs share a horizontal X axis representing time from March 2020 to March 2023.
Panel A, Reported and deconvolved COVID-19 case counts in Delaware. The Y axis is Incident case count from 0 to 4,000. Gray plus signs represent reported daily cases, and a solid black line represents the deconvolved trajectory. There are five distinct peaks. The largest peak occurs in early 2022, reaching approximately 2,500 on the deconvolved line and over 4,000 in reported points. Other peaks occur in late 2020, late 2021, and early 2023.
Panel B, Estimated new infections in Delaware. The Y axis is Number of new infections from 0 to 25,000. A jagged black line shows the median estimate, surrounded by a light gray shaded ribbon representing the 95 percent CrI. The trend mirrors Panel A but at a higher scale. The major peak in early 2022 reaches a median of approximately 11,000 infections with the upper CrI extending to 25,000.
Panel C, Estimated time-varying reproduction number Rt in Delaware. The Y axis is Rt from 0.5 to 2.0. A horizontal dashed line marks the epidemic threshold at 1.0. The black line representing the median 7 day sliding window Rt fluctuates around the 1.0 threshold. It starts above 1.5 in March 2020, then oscillates between 0.5 and 1.5 throughout the period. The most significant dip below 1.0 occurs shortly after the early 2022 peak.
County-level results are shown in Figures S5-S7. All 3 counties exhibited waves occurring at similar times as statewide trends, with differences in magnitude and variability. New Castle County had the highest reported case counts and estimated infections across waves. Kent County exhibited lower counts with more gradual changes. Sussex County showed relatively sharper increases in estimated infections during several waves, including winter 2020-2021 and winter 2021-2022. Rt trajectories were broadly similar across counties but differed in short-term variability, with larger fluctuations observed in Sussex County, comparatively stable trajectories in Kent County, and patterns in New Castle County closely resembling statewide estimates.
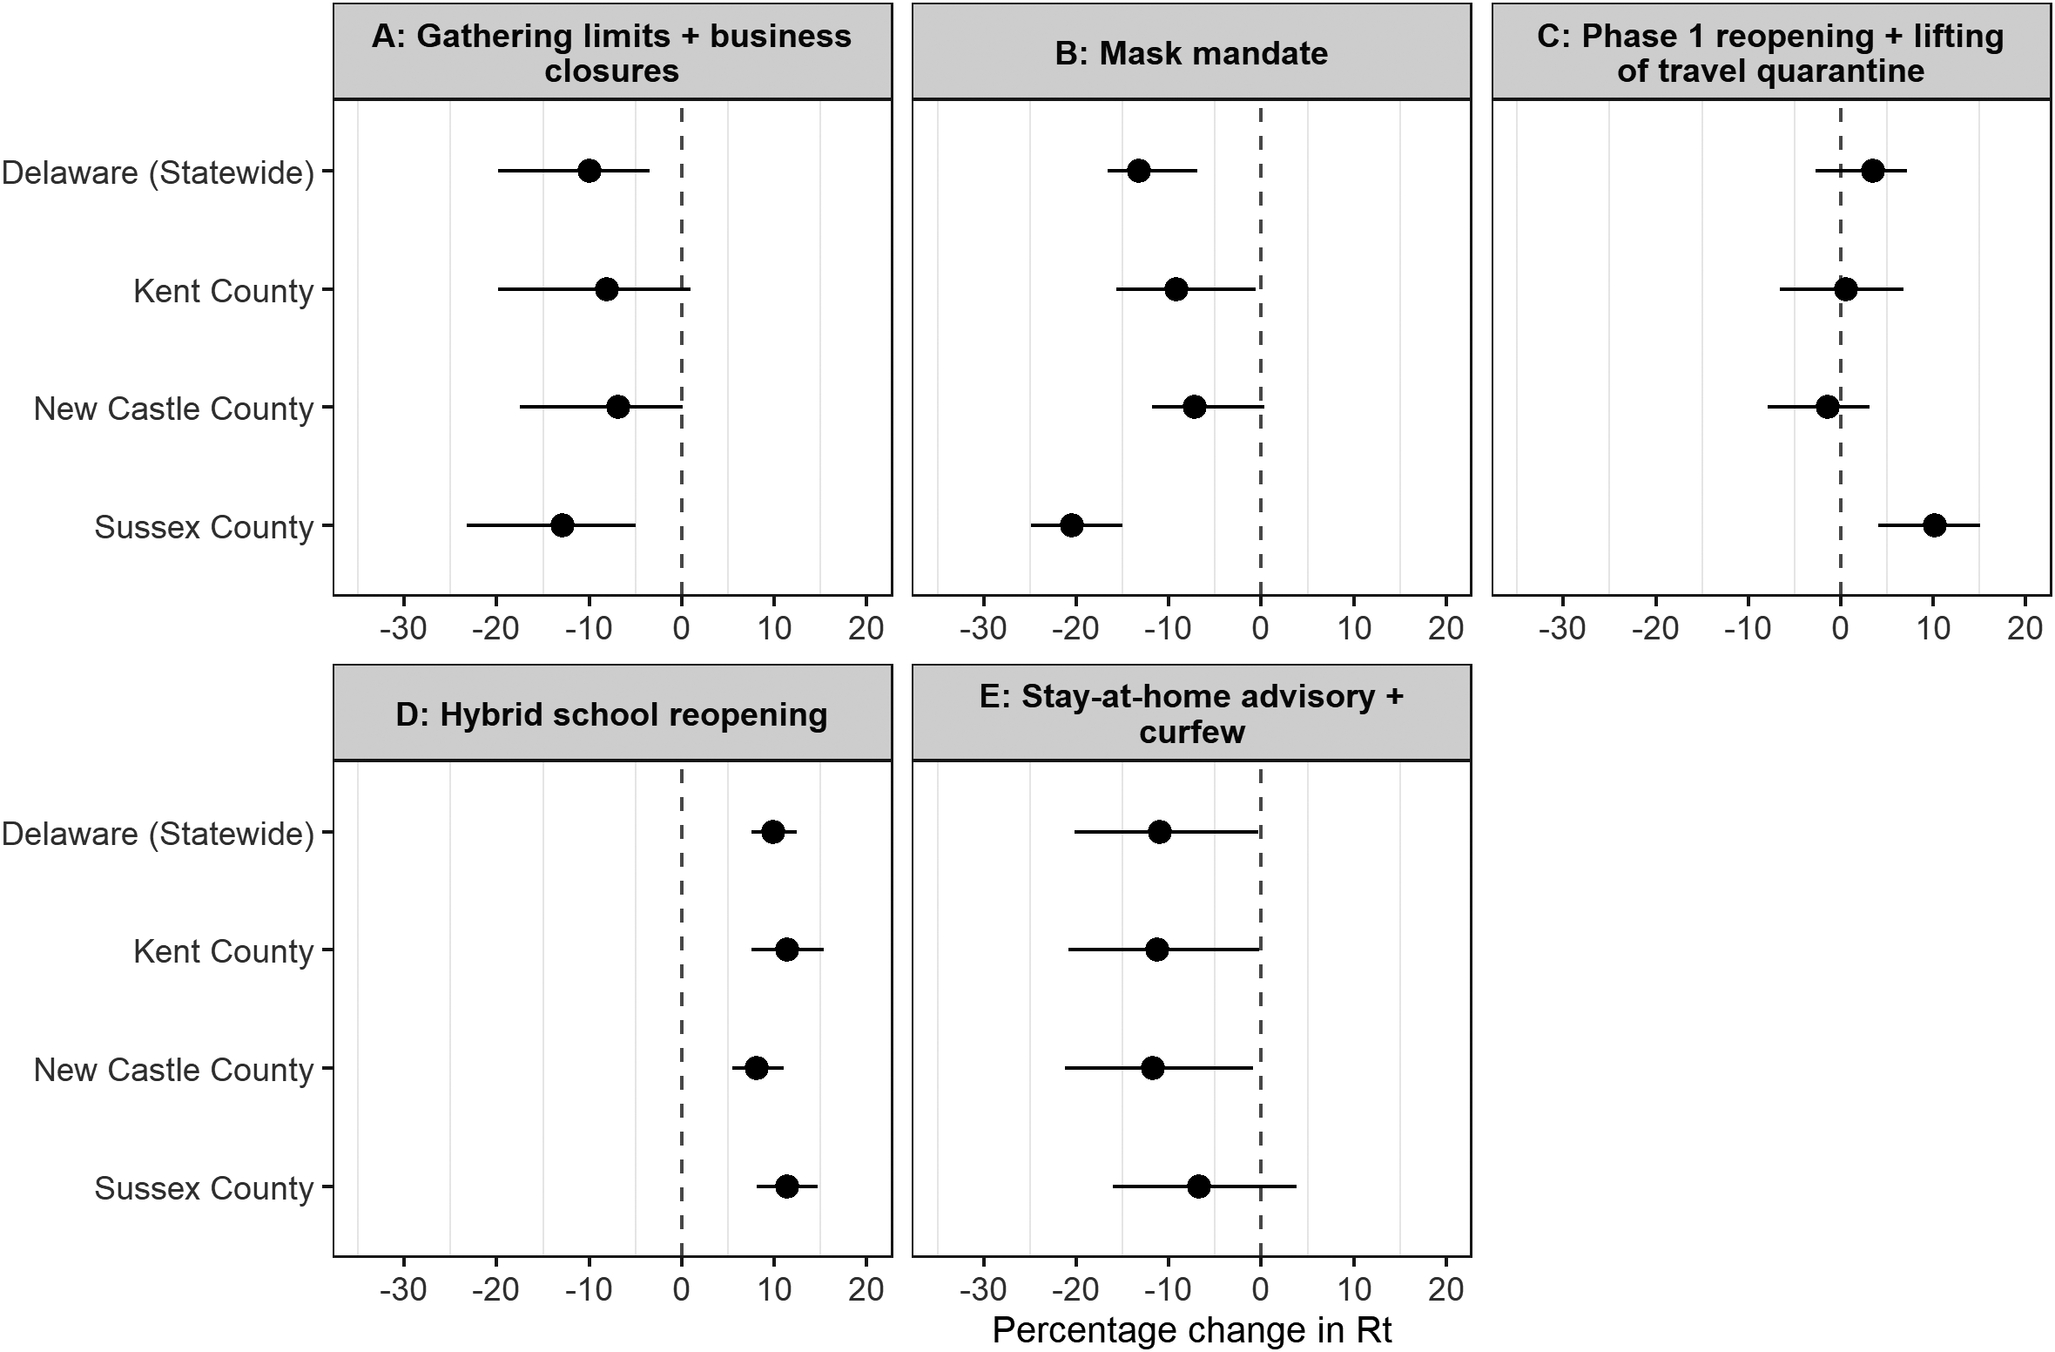
Policy-associated percentage changes in Rt are presented in Figure 2 and Table S2, and Rt estimates within major policy time windows are shown in Figure S8. Early pandemic interventions were associated with substantial decreases in Rt; notably, limits on social gatherings (April 2, 2020) and the public mask mandate (April 28, 2020) were associated with statewide decreases of 9.9% (95% CrI: −19.8% to −3.5%) and 13.2% (95% CrI: −16.6% to −6.9%), respectively. Notably, in Sussex County, with the mask mandate, Rt dropped from 1.12 (95% CrI: 1.06 to 1.16) to 0.89 (95% CrI: 0.86 to 0.93). During Phase 1 reopening (June 1, 2020), median Rt changes were small statewide and in Kent and New Castle counties, while Sussex County exhibited a modest increase distinguishable from 0 (median increase 10.1%; 95% CrI: 4.0% to 15.0%). The most consistent increases across jurisdictions were associated with the transition from phased reopening to hybrid school reopening (September 8, 2020), with median Rt increasing by approximately 8% to 11% statewide and across all 3 counties, and all CrIs excluding 0. Finally, the stay-at-home advisory and overnight curfew (December 14, 2020) were associated with a statewide decrease in median Rt of 10.9% (95% CrI: −20.1% to −0.3%), with CrIs also excluding 0 in Kent and New Castle counties.
Policy-associated percentage changes in the time-varying reproduction number (Rt) for Delaware and its counties. Points show median percentage changes and horizontal lines show 95% credible intervals (CrI) across transitions between consecutive policy periods. The vertical dashed line indicates no change (0%). Values to the right of the vertical dashed line indicate an increase in Rt, and values to the left indicate a decrease. Policy levels correspond to: (A) Social gathering limits and nonessential business closures (April 2, 2020); (B) Public mask mandate (April 28, 2020); (C) Phase 1 reopening and lifting of out-of-state travel quarantine (June 1, 2020); (D) Hybrid school reopening (September 8, 2020); (E) Stay-at-home advisory and overnight curfew (December 14, 2020).

Figure 2. Long description
The multi-panel graph consists of five panels labeled A through E. The X-axis represents the Percentage change in Rt, ranging from minus 30 to 20. The Y-axis lists four regions: Delaware (Statewide), Kent County, New Castle County, and Sussex County. A vertical dashed line at 0 indicates no change.
* Panel A: Gathering limits and business closures. All four regions show a median decrease in Rt. Sussex County shows the largest decrease at approximately minus 13 percent, while the other three regions cluster around minus 8 to minus 10 percent.
* Panel B: Mask mandate. All regions show a decrease. Sussex County shows the most significant drop at approximately minus 21 percent. Delaware (Statewide), Kent, and New Castle show decreases between minus 7 and minus 13 percent.
* Panel C: Phase 1 reopening and lifting of travel quarantine. Trends are mixed and closer to the zero line. Delaware (Statewide) and Sussex County show slight increases (Sussex at approximately 10 percent), while Kent and New Castle are near zero.
* Panel D: Hybrid school reopening. All four regions show a consistent median increase in R t of approximately 8 to 11 percent, with all credible intervals entirely to the right of the zero line.
* Panel E: Stay-at-home advisory and curfew. All regions show a median decrease. Delaware (Statewide), Kent, and New Castle cluster around minus 11 percent, while Sussex County shows a slightly smaller decrease of approximately minus 7 percent.
Stronger associations between Rt changes and policy changes were observed in Sussex County than in New Castle County. Limits on social gatherings and the public mask mandate were associated with substantial Rt reduction (−12.9%, 95% CrI: −23.3% to −5.0%; and −20.5%, 95% CrI: −24.9% to −15.0% respectively) in Sussex County, whereas Rt reductions in New Castle County were modest and statistically not significant (−6.8%, 95% CrI: −17.5% to 0.1%; and −7.2%, 95% CrI: −11.8% to 0.3% respectively). Meanwhile, Phase 1 reopening was associated with a 10.1% (95% CrI: 4.0% to 15.0%) increase in Rt in Sussex County, whereas Rt change was minimal and statistically not significant (−1.4%, 95% CrI: −7.9% to 3.1%) in New Castle County.
Discussion
This analysis examined COVID-19 transmission dynamics in Delaware in 2020-2023, with a focused analysis in 2020 within the context of statewide NPIs implemented across a relatively small, administratively centralized jurisdiction. In some U.S. states (e.g., South Carolina), counties or municipalities independently determine the timing and adoption of measures such as mask mandates or business restrictions.Reference Davies, Hua and Jacobs 5 In Delaware, most major interventions were enacted at the state level and implemented with similar timing across counties, allowing examination of temporal associations between policy changes and transmission dynamics with reduced within-state policy heterogeneity.
The observed patterns are broadly consistent with prior evidence showing that some NPIs have been temporally associated with changes in COVID-19 transmission, while reported changes in Rt vary substantially across settings and analytic approaches. Previous reviews and multi-country analyses documented associations between combinations of interventions, including restrictions on gatherings, business closures, mask mandates, and stay-at-home measures, and changes in Rt, though estimates differed widely depending on context and method.Reference Faherty, Nascimento de Lima and Lim 6 , Reference Haug, Geyrhofer and Londei 7 Methodological reviews have further emphasized that accurate Rt estimation requires careful consideration of observation delays, generation interval uncertainty, and analytic choices, including assumptions about delays between infection and case reporting and specification of the serial interval, all of which can influence estimates of transmission dynamics and their temporal alignment with policy changes.Reference Gostic, McGough and Baskerville 8
County-level differences observed in this study are consistent with prior research showing that Rt can vary across substate geographies within a state, even when interventions are implemented at the state level and evaluated across policy-defined periods.Reference Davies, Hua and Jacobs 5 , Reference Politis, Hua and Ogwara 9 Within Delaware, counties differ in population density, economic structure, and mobility patterns, factors that may contribute to variation in observed transmission dynamics despite shared policy timing. Similar heterogeneity has been reported in other U.S. studies evaluating policy-associated changes in transmission at substate levels.Reference Ofori, Ogwara and Kwon 10 As more than half of Delawareans live in the urban New Castle County, its Rt trajectory was less subject to random fluctuations than those of the other two counties and more resembling the statewide trajectory.
Several limitations should be considered. This ecological, observational study cannot establish causal relationships between specific policies and changes in transmission. There is the possibility of ecological fallacy, as associations observed at the aggregate level may not apply at the individual level. Policy changes occurred alongside shifts in individual behavior, testing practices, and risk perception that are not fully captured in reported case data. In addition, county-level estimates are subject to greater uncertainty due to smaller population sizes and lower case counts, as reflected in wider CrIs. Short intervals between some policy transitions further limit our method’s ability to isolate the effects of individual policy changes. In addition, overlapping timing of policy measures complicates attribution of observed changes in Rt to specific interventions, as multiple policies and concurrent behavioral changes often occurred in close succession. Our choice of a Poisson-distributed multiplier with a fixed mean of 4 throughout the study period assumes a constant underreporting rate; however, underreporting may vary over time. We also used the default time lag distribution from infection to report provided in the incidental package, which was derived from a Florida 2020 dataset; the assumption that this distribution applies to Delaware over time may not hold.
Despite these limitations, this study contributes to the literature by providing a focused examination of transmission dynamics in a small U.S. state with relatively uniform policy implementation and meaningful substate heterogeneity. By situating Delaware’s experience within the broader evidence on NPIs, the findings highlight the presence of substate variability in transmission dynamics during periods of statewide policy change and demonstrate the utility of Rt-based approaches for monitoring epidemic trends over time.
Conclusions
This study examined COVID-19 transmission dynamics in Delaware during 2020 using Rt estimates to evaluate temporal alignment with major statewide NPIs. Statewide and county-level Rt estimates from March 2020 through March 2023 identified multiple epidemic waves with broadly similar timing but meaningful differences in short-term variability across counties. In 2020, Rt patterns varied across major statewide NPIs and between counties. These findings illustrate substate heterogeneity during periods of statewide policy change and demonstrate how Rt-based estimates can be used to track epidemic dynamics in a U.S. state with a small population.
Supplementary material
The supplementary material for this article can be found at http://doi.org/10.1017/dmp.2026.10451.
Data availability statement
Our data are publicly available from the data source described in the Methods. The R code used to replicate the results reported in this paper is included in the supplementary materials.
Author contribution
-
• ISTL: Conceptualization, study design, R code writing, data analysis, manuscript writing and editing.
-
• CAO: Conceptualization, study design, R code writing, data analysis, manuscript writing and editing.
-
• CRB: Conceptualization, study design, R code writing, data analysis, manuscript writing.
-
• CMT: Conceptualization, study design, R code writing, data analysis, manuscript writing.
-
• HMM: Conceptualization, study design, R code writing, data analysis, manuscript writing.
-
• KOK: Statistical consultation, manuscript editing.
-
• JXK: Statistical consultation, R code writing, manuscript editing.
-
• XH: Statistical consultation, R code writing, manuscript editing.
-
• ANMK: Statistical consultation, manuscript editing.
-
• GC: Statistical consultation, mentoring, manuscript editing.
-
• ICHF: Conceptualization, study design, R code writing, project oversight, mentoring, and manuscript writing and editing.
Funding statement
We did not receive any external funding for this study.
Competing interests
I. C. H. Fung consulted for Merck & Co., Inc. I. S. T. Lee previously completed an internship at Pfizer, Inc.
Disclaimer
The opinions expressed in this manuscript are those of the authors and do not represent the opinions of the Gates Foundation.
Institutional Review Board Statement
The Georgia Southern University’s Institutional Review Board gave this study a nonhuman subjects determination (IRB #H20364, date of approval: 26 February 2020) under the G8 exemption category of Title 45, Part 46 of the Code of Federal Regulations.



 Open access

