Introduction
Critical congenital heart disease (CHD) encompasses potentially life-threatening cardiac abnormalities that require invasive procedures such as cardiac surgery or cardiac catheterisation within the 1st year of life. Reference Mahle, Newburger and Matherne1 The National Centre for Birth Defects and Developmental Disabilities at the Centres for Disease Control reports that CHD is a leading cause of birth-associated neonatal illness and death. 2 In total, six out of every 10,000 seemingly healthy neonates will have critical CHD of which pulse oximetry screening will miss only one. Reference Plana, Zamora, Suresh, Fernandez-Pineda, Thangaratinam and Ewer3 Newborns with critical CHD usually show clinical deterioration in the 1st days and weeks of life depending on the patency of the ductus arteriosus in ductal-dependent lesions and changes in pulmonary vascular resistance. Reference Mahle, Newburger and Matherne1 Failure to detect critical CHD can result in respiratory distress, cardiogenic shock, and even death. Long-term complications of unrepaired lesions include neurological compromise with significant developmental disabilities.
Most critical CHD can be repaired surgically. Early detection is crucial as poor clinical condition at the time of surgery translates into poorer outcomes, especially in conditions like hypoplastic left heart syndrome. Reference Brown, Ridout, Hoskote, Verhulst, Ricci and Bull4,Reference Thangaratinam, Brown, Zamora, Khan and Ewer5 Hypoxemia is considered a vital sign in the newborn and can be an early presenting finding in critical CHD. Clinical cyanosis may not be evident in infants with mild hypoxemia. Reference Mahle, Newburger and Matherne1
The importance of obtaining routine pulse oximetry in asymptomatic newborns after 24 hours of life, but before hospital discharge, lies in the time frame in which the ductus arteriosus closes functionally. Pulse oximetry is an economically viable, moderately sensitive, and highly specific test with an overall false-positive rate of 0.035% at sea level after the first 24 hours of life. Reference Mahle, Newburger and Matherne1
In 2011, implementation strategies for critical CHD screening were developed that included working groups from the American Academy of Paediatrics and American College of Cardiology. Reference Kemper, Mahle and Martin6 Relying primarily on a prospective study in Sweden, Reference de-Wahl Granelli, Wennergren and Sandberg7 they adopted pulse oximetry screening with pre- and post-ductal oxygen saturations after 24 hours of life. Reference Kemper, Mahle and Martin6 Numerous studies have confirmed that combining pre- and post-ductal screening increased the detection rate when compared with post-ductal screening alone. Reference Thangaratinam, Brown, Zamora, Khan and Ewer5,Reference Ewer and Martin8 In total, seven forms of critical CHD were selected as primary targets for pulse oximetry screening because they typically result in early hypoxia. The proposed protocol, designed at sea level, required pre-ductal (right hand) and post-ductal (either foot) oxygen saturations to be checked after 24 hours of life but before hospital discharge. Despite recognising that implementation of this protocol in “high-altitude communities” might result in a high rate of false positives, the working group agreed on universal implementation of the protocol. Reference Kemper, Mahle and Martin6
Our aim was to determine the false-positive rate in Albuquerque, New Mexico, at an altitude of 1646 m/5400 ft. We hypothesised that our false-positive rate would be considerably higher than that recorded at sea level. We sought to determine the median/mean pre- and post-ductal saturations at moderate altitude, comparing them with existing data at both sea level and altitude and analysing the time trends of implementing this protocol.
Materials and methods
Data was collected retrospectively after obtaining Institutional Review Board approval. Newborn babies between 36 and 36 6/7 weeks of gestation, weighing >2 kg and babies >37 weeks weighing >1.7 kg were included in the study. Newborns < 37 weeks and <2 kg were considered high risk on account of being both late preterm and small for gestational age/low birth weight and were admitted to the intermediate care unit. These neonates were excluded from our study. Neonates with prenatally-diagnosed CHD and those in the neonatal intensive care unit for cardiac or non-cardiac etiology were not included. Outside transfers from neighboring high-altitude areas were also excluded.
Pulse oximetry screening
Pre-ductal (right hand) and post-ductal (either foot) oxygen saturations were recorded at more than 24 hours of life. Data were collected retrospectively from July 2012 to October 2013. A positive screen/failed test was defined per American Academy of Paediatrics as any neonate with a pre- or post-ductal oxygen saturation of less than 90% at any time or pre- and post-ductal oxygen saturations of 90% to less than 95% or a more than 3% difference between the pre- and post-ductal oxygen saturations on three separate occasions, 1 hour apart. Reference Mahle, Newburger and Matherne1 A positive screen resulted in either repetition of the test based on the clinical examination, four-point blood pressure measurements, or a paediatric cardiology consult with an echocardiogram, or a combination of the three.
Statistical analyses
Oxygen saturation measures were summarised using mean, standard deviation, 95% confidence interval, median, and percentiles (1st and 99th). We computed frequencies and percentages for false positives. Change in oxygen saturation was computed as post-ductal saturation − pre-ductal saturation. Histograms were used to summarise frequency distributions. Non-parametric Wilcoxon tests were used to test whether saturation and change in saturation were different for false positives compared with the remaining sample. We assessed change in the probability that screenings resulted in false positives using log-binomial regression with time defined two ways. First, we assessed change from pre- to post-protocol (April 2013–November 2013 versus. July 2012–March 2013) adoption using a binary indicator variable where the exponentiated coefficient is the ratio of post- and pre-false-positive rate. Second, we used time in months as a continuous variable in which the exponentiated slope coefficient is the false-positive rate ratio for a 1-month increase in time. We also fitted a restricted cubic spline model to assess whether change over time was not linear. SAS v. 9.4 was used for statistical analyses, and significance levels were set at α = 0.05.
Results
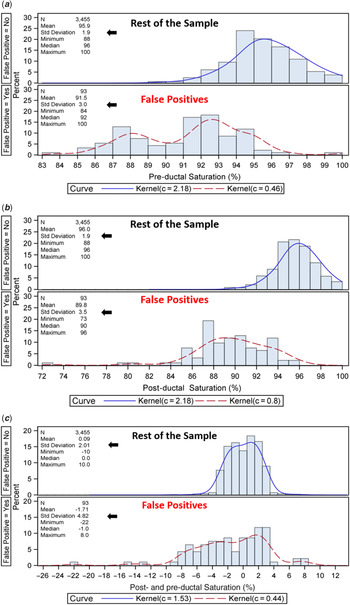
During a 15-month period, a total of 3627 asymptomatic newborns in the nursery were screened at a single centre, academic hospital which also serves as a referral base for high-risk deliveries from across the state. We excluded 79 patients with insufficient data. After excluding these patients, a total of 3548 babies were analysed. There was 1 true positive, 93 false positives, 91 incorrectly interpreted, and 273 that passed on the 3rd attempt. The mean pre- and post-ductal saturation for the entire group after completion of the test was 96.0%. In the subgroup of false positive newborns, mean pre- and post-ductal saturations were 92 and 90% (Fig 1) respectively in comparison to nationally reported data. Reference Jegatheesan, Song, Angell, Devarajan and Govindaswami9 Frequency distributions by false positive status for pre-ductal, post-ductal, and post- and pre-ductal differences are shown in Figure 2A, 2B, and 2C. Mean saturation was significantly lower among false positives for pre-ductal (p < 0.001 Wilcoxon test), post-ductal (p < 0.001 Wilcoxon test), and post- and pre-ductal differences (p < 0.001 Wilcoxon test).
Distribution of mean pre- and post-ductal saturations in the described subgroups.

(a) Distribution of pre-ductal saturations. Mean saturations were significantly lower among the false positives than the rest of the group screened for pre-ductal saturations (p < 0.001 Wilcoxon test). (b) Distribution of post-ductal saturations. Mean saturations were significantly lower among the false positives than the rest of the group screened for post-ductal saturations (p < 0.001 Wilcoxon test). (c). Distribution of pre- and post-ductal saturation differences. Difference in the post- and pre-ductal saturation (in percentage) was also wider in the false-positive group than the rest of the cohort that was screened (p < 0.001 Wilcoxon test).

Only one true positive with interrupted aortic arch, posteriorly-malaligned ventricular septal defect, bicuspid aortic valve, and aortic annulus hypoplasia was detected when the echocardiogram was performed at 31 hours of life for a failed pulse oximetry test as described below. This was an infant of a diabetic mother with the pulse oximetry screen showing a pre- and post-ductal saturation of 97 and 88%. There was a 25 mmHg blood pressure gradient between the upper and lower extremities. Genetic testing was positive for 22q11.21 deletion. Infant was started on prostaglandin infusion and calcium before being transferred to an outside hospital for surgical repair. Prenatal obstetric scan at 21 weeks was reportedly normal. Hence, our incidence was 0.03%. The overall false-positive rate for the duration of the study was 2.6%, much higher than the national average. Log-binomial regression was used to assess the change in the probability of false positives over time. We first tested whether the false-positive rate from 1 July, 2012 to March 2013 was different from April 2013 to October 2013. Before April 2013, the false-positive rate was 3.50% (95% confidence interval 2.72–4.50) compared with 1.49% (95% confidence interval 0.95–2.31), relative risk (false-positive rate after/false-positive rate before) equaled 0.42 (95% confidence interval 0.25–0.71, p = 0.003). We next tested whether there was a trend in false-positive rate over time, and found a significant decrease (p = 0.003, slope coefficient = −0.082, standard error of coefficient = 0.023) with the relative risk of a false positive decreasing at 0.92 (95% CI 0.88–0.97) per month (Fig 3). A spline model that allowed time effects to be non-linear showed only small differences from the linear time model (Fig 3).
Time trends in the false-positive rate. The x axis indicates the false-positive rate in percent and y axis indicates time. Solid line and shaded band are predicted prevalence and 95% confidence interval, respectively, for change over time (log-binomial regression slope = −0.082, p = 0.003). Dashed line is predicted prevalence from non-linear spline model.

Discussion
Although studies have shown that average oxygen saturations in newborns are lower and show more variability at moderate elevation than at sea level, Reference Ravert, Detwiler and Dickinson10 our study is the first to determine the average oxygen saturations at a single site, academic medical centre in Albuquerque, New Mexico. At our altitude, the mean pre- and post-ductal saturation for the entire cohort was 96%. In the false positive cohort, the mean pre- and post-ductal saturation was 92 and 90% respectively, lower than nationally reported data at sea level.
Our initial false-positive rate between July 2012 and March 2013 was especially high at 3.50% in comparison with the national average. Reference Mahle, Newburger and Matherne1 It took nearly 9 months for the team performing this test to correctly execute the nationally recommended protocol, after which we saw a steady decline in the false-positive rate to 1.5% at the end of the study (trend analysis). We infer that the initial high false-positive rate was primarily due to the learning curve associated with the implementation of a new protocol. At the end of the study period, although the false-positive rate did decline, it tended to plateau at 1.5%, still much higher than the national average of 0.035% recorded at sea level, Reference Mahle, Newburger and Matherne1 indicating a greater effect of altitude rather than the methodology of the test.
Despite improvements in prenatal screening ultrasonography, detection of isolated critical CHD remains less than 50%. After combining prenatal screening with physical examination, up to 30% of infants born with critical CHD are still discharged home before diagnosis, and the mortality rate in this group can be as high as 50%. Reference Plana, Zamora, Suresh, Fernandez-Pineda, Thangaratinam and Ewer3 Implementation of statewide pulse oximetry screening has been shown to reduce infant mortality from both cardiac and non-cardiac causes. Reference Abouk, Grosse, Ailes and Oster11 Timing of pulse oximetry is critical. Studies have described a seven-fold decrease in false positives when implemented at more than 24 hours of life, 0.06 (95% confidence interval 0.03–0.13) versus 0.42% (95% confidence interval 0.20–0.89), than when performed at less than 24 hours of life (p = 0.027). Reference Plana, Zamora, Suresh, Fernandez-Pineda, Thangaratinam and Ewer3
In Denver, despite being at a similar altitude to Albuquerque, New Mexico, the mean post-ductal saturations measured at term spanned from 92 to 93% with a range between 80 and 98% at 5280 ft/1610 m. Reference Thilo, Park-Moore, Berman and Carson12 In Quito, Ecuador, at an altitude of 9252 ft, the mean pre- and post-ductal saturations were substantially lower at 92.77 (standard deviation ± 3) and 93.76% (standard deviation ± 2.83), respectively. Reference González-Andrade, Echeverría, López and Arellano13 Likewise, the frequency of a positive screen increased with increasing altitude from 0.2% for infants born at sites at or less than 2000 ft to 6% for infants born at sites above 6000 ft. Enrollment at 8163 ft was stopped after enrolling 65 infants because of a very high false-positive rate (35%). Reference Paranka, Brown, White, Park, Kelleher and Clark14
Altitude affects newborn saturations by causing delayed transition from fetal to neonatal circulation because of lower partial pressure of oxygen, restricting the degree of expected pulmonary vasodilation. With elevated pulmonary vascular resistance, pulmonary artery to aorta shunting via the patent ductus arteriosus causes decreased post-ductal saturations. Right atrial to left atrial shunting across the interatrial communication in the setting of a less compliant right ventricle in the newborn period can lead to a decrease in both pre- and post-ductal saturations. Intra-pulmonary shunting from ineffective respirations after birth can also contribute to desaturations. Reference Wright, Kohn, Niermeyer and Rausch15 Changes in the hemoglobin–oxygen dissociation curve in response to decreased partial pressure of oxygen are also thought to contribute to lower saturations at altitude. Reference Evers, Vernon and Schultz16
To overcome the problem of an increased false-positive rate at moderate altitude, researchers have proposed alternative screening protocols. Wright et al used an alternative cut-off for infants born at moderate altitude (5557 ft) of 85–94% or a >3% difference in pre- and post-ductal saturations. Using this protocol, their overall failure rate was 1.1%. Reference Wright, Kohn, Niermeyer and Rausch15 Changing the parameters of screening to allow newborns with oxygen saturations of more than 85% but less than 90%, three attempts before “failing” may allow a proportion of healthy newborns who would otherwise fail to have more time to transition. The use of supplemental oxygen to promote pulmonary vasodilation and therefore accelerate neonatal transition was tested in a study by Lueth et al in which newborns who failed their 1st screen were placed in an oxygen hood with FiO2 parameters to simulate sea level atmospheric oxygen tension. Reference Lueth, Russell and Wright17 Failure rates at 6200 ft in this study decreased to 0.3% from a prior value of 1.1% when they implemented the nationally recommended screening protocol. Reference Lueth, Russell and Wright17 Delaying the screening to allow more time for transition has also been proposed. Reference Wright, Kohn, Niermeyer and Rausch15
Our series detected only one true positive with a ventricular septal defect and interrupted aortic arch. Keeping in context with the earlier classification, this pathology lies in the spectrum of secondary targets of this test. Secondary targets are lesions that are detected to a lesser degree by pulse oximetry because of minimal hypoxia. These lesions include interrupted aortic arch, critical aortic stenosis, critical coarctation of the aorta, Ebstein’s anomaly, and some forms of double outlet right ventricle. The Centres for Disease Control have included these five additional lesions while studying critical CHD. Reference Oster, Aucott and Glidewell18 Detection of these lesions depends on the severity and the direction of shunting across the patent ductus arteriosus or patent foramen ovale/atrial septal defect. Cardiac lesions that are not detected by this screen include left or right heart obstructive lesions with no intracardiac shunting or patent ductus arteriosus and left to right shunting lesions. Reference Jawin, Ang, Omar and Thong19 False-negative rates have been reported between 0.008 and 0.64%, especially in infants with coarctation of the aorta. Reference Lueth, Russell and Wright17
Hence, in addition to being a screening tool for critical CHD, pulse oximetry can act as an early marker in cases like pneumonia, respiratory distress from meconium aspiration, transient tachypnea of the newborn, and neonatal sepsis, Reference Jawin, Ang, Omar and Thong19 which can contribute to higher “false-positives.” Reference de-Wahl Granelli, Wennergren and Sandberg7
Limitations of the study
Our study was retrospective. We were not able to detect any false-negative cases because of the small sample size. Infants transferred from other high-altitude areas in the state of New Mexico were not analysed.
Conclusion
The false-positive rate is higher in Albuquerque, New Mexico, like that in other high-altitude communities, in comparison with the sea level data. In our series, the false-positive rate declined following initial implementation of the protocol. This was thought to be secondary to the learning curve associated with the implementation of the national screening protocol at our institution. Although there was a steady decline with time, there continued to be a higher plateau rate for the false-positives at 1.5% compared with the national average of 0.035%, thought to be due to the effect of high altitude rather than the learning curve.
With a high false-positive rate using the current American Academy of Paediatrics protocol, transporting an infant from a remote area, especially via air in unfavourable terrain, incurs a significant risk both for the infant and the health care team involved. Higher false-positive rates give rise to an additional cost burden on the health system, especially in remote areas where resources are scarce. On the contrary, lowering the cut-off limits alone could potentially decrease the false positives, but at the cost of decreasing sensitivity.
Acknowledgements
The authors thank Dr. Takeshi Tsuda for reviewing the manuscript draft and Theresa Michel for assistance with editing.
This paper was presented as part of the Young Investigator Award presentation competition of the American Academy of Paediatrics (Paediatrics August 2019,144 [2 Meeting Abstract] 290; doi: https://doi.org/10.1542/peds.144.2_MeetingAbstract.290).
Financial Support
This work was partially supported by award number UL1TR001449, UNM CTSC (Clinical and Translational Science Collaborative) for biostatistical work.
Conflicts of Interest
None.