Introduction
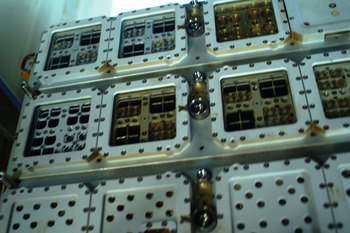
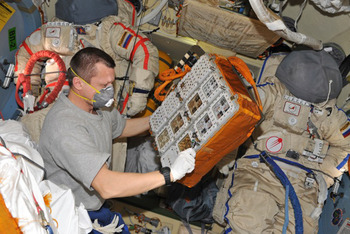
‘Expose’ is the short name of suitcase-sized scientific instrument developed by the European Space Agency (ESA) for the conduction of astrobiological and astrochemical experiments in space. Installed at the outer surface of the International Space Station (ISS), it allows scientist to submit test samples to the harsh space conditions, comprising a combination of near-vacuum, full-spectrum Solar light, cosmic particle radiation, near-weightlessness and wide-range temperature undulations. This complex environment can in its entirety not be replicated in the laboratory on ground. Ideally, the test samples on Expose should be freely exposed to open space. In practice, however, chemical and biological test samples on the ISS shall always be contained some way or another to comply with the strict safety regulations of manned spaceflight. Therefore, all samples on Expose are placed behind windows. Depending on the selected window material, Solar radiation can still reach the samples without a significant reduction of ultraviolet (UV). The first spaceflight of Expose was completed in 2008–2009 under the designation Expose-E (Rabbow et al. Reference Rabbow2012). This paper concerns its sister model, Expose-R, which was during 2009–2011 for 22 months in open space on the ISS (Rabbow et al. this issue). The top surface of Expose-R was equipped with seven large and 75 small windows, receiving Solar radiation at a total fluence of 17 GJ m−2 during the mission (Beuselinck & Van Bavinchove Reference Beuselinck and Van Bavinchove2011b). Pictures made during extra-vehicular activity (EVA; spacewalk) nr. 27 on the final day of exposure indicated that four of the large windows had turned brown (Fig. 1). This was confirmed 1 week later when Expose-R was back inside the ISS (Fig. 2). The four brown windows were placed on top of sample compartments, which had been connected to space vacuum during the exposure period, whereas the three non-affected windows belonged to pressurized, argon-filled compartments. Back on ground it was discovered that a similar discolouration was displayed by many of the 75 small windows. As the brown colour should have impacted the quantity and quality of Solar light that reached the test samples, affecting the core of the scientific goals, an investigation was started to identify the properties and the root cause of the colour change. As such, this paper does not contain scientific results per sé. Instead, it is focused on technical investigations that were carried out to understand and possibly resolve this problem on future flights.
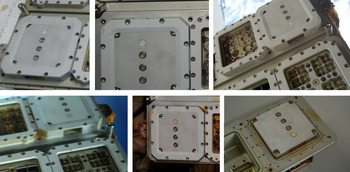
The zenith-pointing top surface of Expose-R on the final day of space exposure. The picture was made outside the ISS during EVA 27 and provided the first evidence for the discolouration of some of the windows. Credit: NASA.

Dmitriy Kondratyev with Expose-R inside the ISS when the 22 month period of external exposure was over. The four brown-coloured windows are easily discernable. Credit: Roscosmos.

Materials and methods
After the spaceflight of Expose-R subsets of the windows ended up in various laboratories, depending on the experiments the windows were related to. In each laboratory, the measurements were conducted using the available equipment. As a result, multiple spectrometers with overlapping features have been used, as listed below. Some of the windows were measured in more than one spectrometer at different institutes, with consistent results.
UV/visible light (VIS) and vacuum UV (VUV)/UV spectra were acquired to evaluate the loss of transmission over these wavelength ranges. This was essential because the experiments on Expose-R were largely focused on the effects of Solar UV radiation. Fourier transform infrared spectroscopy (FTIR) spectra and X-ray photoelectron spectroscopy (XPS) spectra were collected to identify the molecular structure of the contaminants that had settled on the windows.
UV/VIS/NIR transmission spectroscopy (ESTEC)
UV/VIS/near-infrared spectroscopy (NIR) transmission spectra were made with a Cary 5000 spectrophotometer in dual-beam absolute specular transmission mode over a wavelength range of 190–2500 nm. Reference windows (blanks) and space-flown windows were measured sequentially.
VUV/UV transmission spectroscopy (LISA)
UV/VUV transmission spectra were acquired with a Horiba Jobin Yvon spectrometer fitted with a monochromator H20-UVL (grating: 1200 grooves per mm, dimensions 40 × 45 × 7 mm, opening of slits 130–160 μm) covering 100–300 nm wavelength range. Reference windows (blanks) and space-flown windows were measured sequentially. Spectra of the blanks were obtained by first measuring without a window.
UV/VIS transmission spectroscopy (NASA)
UV/VIS transmission spectra were collected with an Ocean Optics HR4000 spectrometer. An Ocean Optics DH-2000-S-DUV Deuterium Tungsten Halogen was used as spectral light source. The source and the collection fibre were aligned in one line. Blank MgF2 windows were used as reference. Spectra were recorded in the 200–1100 nm wavelength range with an optical resolution of 0.91 nm (full-width at half-maximum (FWHM)).
UV/VIS transmission spectroscopy (RUAG)
UV/VIS transmission spectra were collected with a Perking Elmer Lambda 2 Photospectrometer, covering the 190–1100 nm wavelength range. Reference windows (blanks) and space-flown windows were measured sequentially.
X-ray photoelectron spectroscopy (RUAG)
XPS analysis was performed using a Ph15000 VersaProbe spectrometer (ULVAC-PHI, inc.) equipped with a 180o spherical capacitor energy analyser and a detection system with 16 channels.
Fourier transform infrared spectroscopy (ESTEC)
FTIR measurements were made on a Bruker Optics Equinox 55 spectrometer. Spectra were acquired in the wavenumber range of 4000–1100 cm−1 with 64 scans at a resolution of 4 cm−1.
Fourier transform infrared spectroscopy (LISA)
FTIR measurements were made on a Bruker Vertex 70 spectrometer. Spectra were acquired in the wavenumber range of 4000–1000 cm−1 with a resolution of 4 cm−1. Each spectrum was averaged on 32 scans.
Raman spectroscopy (ESTEC)
Raman spectroscopic analysis was performed with a Rennishaw Invia Raman microscope, using the 514 nm laser excitation with a laser power of 5 mW. Radius of the spot of the laser beam on the sample surface is approximately 1 μm.
Cleaning and polishing (LISA, NASA, RUAG)
To remove the contamination layer and to restore the transparency, the window surfaces were washed and/or polished. Acetone, methanol and dark soap (in water) manufactured by Marius Fabre, France were used by LISA. An acetone wash was used by NASA. For polishing, fine diamond abrasive was used by RUAG.
Determination of the thickness of the contamination layer (RUAG)
The windows were sputtered with argon ion etching at five depth points to find the composition at each depth. The thickness of the contamination was deduced from the results obtained in the five layers.
Handling and storage
All contaminated windows described in this paper were handled and stored after the flight together with their non-contaminated counterparts. The nominal, full transmission of the non-contaminated windows as measured after the flight proves that no (additional) contamination was introduced during post-flight handling and storage.
Results
Large windows
Loss of transparency – qualitatively
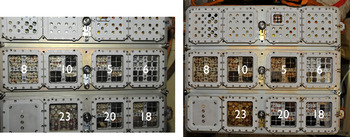
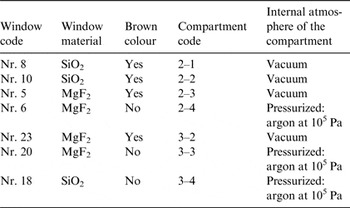
The brown colour was selectively displayed by a subset of windows (Figs. 1–3). No connection could be established with the materials the windows were made of (Table 1). This indicated that the colour was somehow created from inside (a colour emerging outside, at the space side, should have appeared uniformly over all windows). This preliminary conclusion was readily confirmed by visual inspection back on the Earth. A brownish film was observed at the inner surface of windows nrs. 8, 10, 5 and 23 (Fig. 3). A direct correlation could be made with the atmospheric conditions behind the windows: the blurred windows were part of sample compartments which, through venting lines, had been evacuated during the exposure period and were open to outer space during the whole mission, whereas the clear windows belonged to sealed compartments that had been kept under pressure (Table 1). This suggested that windows 8, 10, 5 and 23 were contaminated by molecules that originated from the interior of their sample compartments, considering that the release of volatile compounds is promoted by evacuation, but is suppressed by pressurization (van Papendrecht et al. Reference van Papendrecht, Butenko, Bolkhovitinov, Demets, Rohr and Semprimoschnig2013).
Top surface of Expose-R on board of the ISS before (left) and after (right) space exposure. The numbers are identifiers for individual windows. Nrs. 8, 10, 5 and 23 turned brown during exposure, while nrs. 6, 20 and 18 remained clear. Credit: NASA.

Contamination of the Expose-R windows – qualitatively. The correlation with vacuum is evident

Loss of transparency – quantitatively
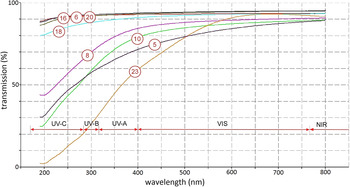
For each window the reduction of the transparency was quantified. Transmission spectra were made by RUAG (200–1100 nm) (RUAG 2011b) and the European Space Research & Technology Centre (ESTEC) (190–2500 nm) (van Papendrecht et al. Reference van Papendrecht, Butenko, Bolkhovitinov, Demets, Rohr and Semprimoschnig2013) with consistent results. The transparency of the brown windows was not only reduced in the visible range (400–770 nm) but even more strongly in UV (190–400 nm) (Fig. 4). Each window was measured four times, covering different zones of the window surface (van Papendrecht et al. Reference van Papendrecht, Butenko, Bolkhovitinov, Demets, Rohr and Semprimoschnig2013). Per window four identical curves were acquired, indicating that the loss of transparency was evenly distributed over the surface. Such homogeneity did not exist however among the four contaminated windows: each window delivered its individual signature (Fig. 4). The remarkably smooth curves, without ripples, peaks or dips (Fig. 4) did not allow us to identify which molecular species were involved and are indicative for cross-linked molecular aggregates.
Transmission spectra of the large windows after space exposure. Vertical axis: transmission 0–100%, horizontal axis: wavelength 150–850 nm. Nr. 16 was a reference window, kept on ground when Expose-R was in orbit.

Physical and chemical analysis of the brown film
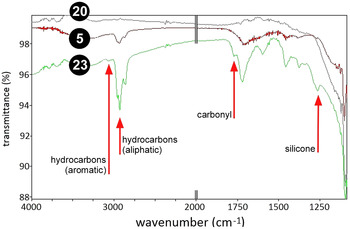
The brown films were firmly attached to the windows and could not be wiped away with a dry tissue. To investigate the physical and chemical characteristics, the films were analysed by RUAG (RUAG 2011b) and ESTEC (van Papendrecht et al. Reference van Papendrecht, Butenko, Bolkhovitinov, Demets, Rohr and Semprimoschnig2013). The strongest loss of transparency was displayed by window no. 23 (Fig. 4). RUAG found that the film consisted of a solid, homogenous layer of 5–10 nm thickness. When that film was polished away using fine diamond abrasive, the transparency was fully restored over all wavelengths down to 200 nm. XPS analysis by RUAG demonstrated single-bond carbon (C–C) as the main contributor to this layer with a minor part played by carbonyl-bond carbon (C = O) (RUAG 2011b). In a complementary FTIR analysis by ESTEC (van Papendrecht et al. Reference van Papendrecht, Butenko, Bolkhovitinov, Demets, Rohr and Semprimoschnig2013) signatures were found for aromatic hydrocarbons, aliphatic hydrocarbons, carbonyl and phenyl-methyl-silicone (Fig. 5). Between wavenumbers 1750 and 1250 per cm a number of peaks were found (Fig. 5) that could not be linked to a specific molecular fingerprint. Such peaks however are typical for mixed, cross-linked molecules. As the window itself was made of pure MgF2, the brown film was clearly a deposit which had precipitated onto the window during the spaceflight.
Post-flight FTIR spectra from windows nr. 23, nr. 5 and the non-contaminated nr. 20. Suprasil quartz is opaque to IR hence no FTIR profiles could be made for windows nrs. 8 and 10. Vertical axis: transmittance from 88 to 100%. Horizontal axis: wavenumber per cm from 4000 down to 1100. Between 2000 and 1100 the axis has been stretched to improve clarity.

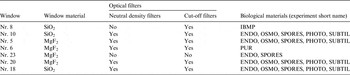
Like nr. 23, window nr. 5 was subjected to FTIR analysis by ESTEC (van Papendrecht et al. Reference van Papendrecht, Butenko, Bolkhovitinov, Demets, Rohr and Semprimoschnig2013). Hydrocarbons and carbonyl were once more identified but no clear signature for silicon compounds showed up this time (Fig. 5). A possible explanation is that nr. 5 suffered from a comparable type of contamination as nr. 23, but to a lesser degree, which can be understood by the internal design of the carrier (Table 2). Whereas window nr. 23 was placed directly above the biological test samples, window nr. 5 was separated from the samples by optical filters. These filters could have acted as a barrier for volatile molecules to approach the window or as additional surfaces to settle upon – thereby reducing the net amount of molecules sticking to the window surface.
Internal configuration of the seven sample compartments equipped with a large window. Presence/absence of optical filters and identity of biological materials. More details about the experiments in Rabbow et al., this issue

Window nrs. 10 and 5 were placed on top of sample compartments with an identical internal lay-out and an identical sample composition (Table 2). The transmission spectra of nrs. 10 and 5 resembled one another, but were not fully identical (Fig. 4). The small difference may be related to the window material, which was SiO2 for nr. 10 and MgF2 for nr. 5 (Table 2). No FTIR profile was made of nr. 10, because SiO2 is opaque to infrared (IR).
Although window nr. 8 suffered less than nrs. 23, 5 and 10 in terms of transmission loss (Fig. 4), its brown film turned out to be of a unique kind. Microscopy at high magnification by ESTEC revealed a peculiar pattern of fractal-like structures (Butenko Reference Butenko2012). Raman spectroscopy by ESTEC indicated these structures to contain hydrocarbons, probably of a cross-linked kind. The true chemical identity was not established however although some material was removed from the surface for further analysis (Butenko, Reference Butenko2012; van Papendrecht et al. Reference van Papendrecht, Butenko, Bolkhovitinov, Demets, Rohr and Semprimoschnig2013). No FTIR profile was made of nr. 8, because SiO2 is opaque to IR.
Small windows
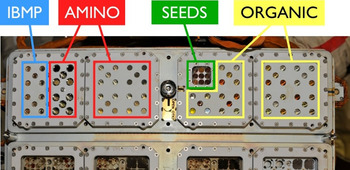
Besides the seven large windows, the top surface of Expose-R was furnished with 75 small-sized circular windows from the experiments IBMP, AMINO and ORGANIC (Fig. 6). All were made of MgF2. The SEEDS experiment was uniquely equipped with a single square-shaped window (Fig. 6).
Small windows on Expose-R and their attribution to the individual experiments.

Small windows from IBMP
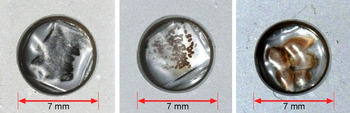
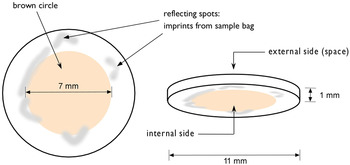
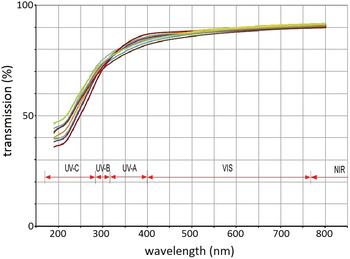
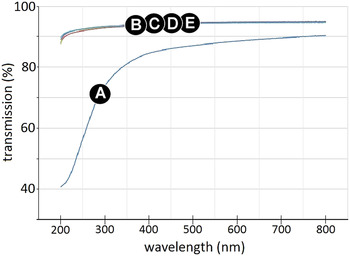
Ten out of the 75 small circular windows belonged to the IBMP experiment (Fig. 6). The biological samples from IBMP came in three varieties: larvae from the midge, tomato seeds and radish seeds (Fig. 7). Each sample was packed in a rectangular, UV-transparent, gas-permeable envelope made of polyolefin (Novikova et al. this issue), which was placed immediately behind the window (Fig. 7). Post-flight inspection revealed a faint, but clearly visible brownish circle at the inner surface of every window. The outer surface, pointing into space, was always clean (Fig. 8). Spectroscopy by ESTEC indicated that the transparency was reduced in VIS and UV (Fig. 9) in a way comparable with large window nr. 8 (Fig. 4). The latter window was part of the IBMP experiment as well (see Table 2). As the spectra from the ten small windows were nearly identical (Fig. 9) the transmission loss did not seem to depend on the biological species behind the window. As was demonstrated by LISA, the transparency in VIS and UV was fully restored when the brown circle was washed away with dark soap (in water), acetone and methanol (Fig. 10).
Close-ups of three samples from the IBMP experiment. Left: larvae of the midge. Centre: seeds of the radish plant. Right: seeds of the tomato plant. Each sample was wrapped in a heat-sealed polyolefin envelope, positioned behind a 1 mm thick MgF2 window. The windows themselves were placed behind 7 mm wide portholes.

Visual inspection of the small IBMP windows after the flight. A brownish circle was displayed at the inner surface of each window. The 7 mm diameter of the circle corresponded to the Sun-exposed area (Fig. 7). The sketch is representative for all ten windows.

Transmission spectra of ten small MgF2 windows from IBMP after space exposure. Vertical axis: transmission 0–100%. Horizontal axis: wavelength 150–850 nm. The spectrum after cleaning, same wavelength range is shown in Fig. 10.

Recovery from transmission loss of a small IBMP window in UV and VIS. (A) After space exposure. (B) After washing the inner surface. (C) After washing both surfaces. (D) After polishing the inner surface. (E) After polishing both surfaces. Vertical axis: transmission 30–100%. Horizontal axis: wavelength 150–850 nm.

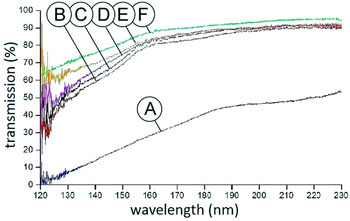
The transmission spectra were expanded into the VUV by LISA. The windows turned out to have largely lost their transparency at these smaller wavelengths (Fig. 11). Washing the inner surface using dark soap (in water), acetone and methanol helped substantially to regain the transparency (Fig. 11). When in addition the outer surface was polished (washing of the outer surface had no significant effect) the transparency in VUV approached the pre-flight percentages (Fig. 11).
Recovery from transmission loss of a small IBMP window in VUV and UV-C. (A) After space exposure. (B) After washing the inner surface. (C) After washing both surfaces. (D) after polishing the inner surface. (E) After polishing both surfaces. (F) Before space exposure. Vertical axis: transmission 0–100%. Horizontal axis: wavelength 120–230 nm.

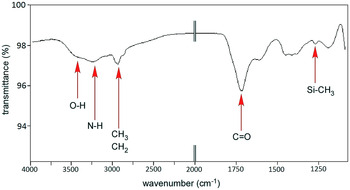
To explore the chemical identity of the brownish circle (Fig. 8), eight small IBMP windows were subjected to FTIR analysis by ESTEC. The FTIR profiles were the same for each window, an example is shown in Fig. 12. The functionalities most likely present were O–H, N–H, CH3, CH2, C = O and Si-CH3.
Post-flight FTIR spectrum of a typical IBMP window. Functionalities most likely present: O–H, N–H, CH3, CH2, C = O and Si-CH3. Vertical axis: transmittance from 92 to 100%. Horizontal axis: wavenumber per cm from 4000 down to 1100. Between 2000 and 1100 the axis has been expanded to improve clarity. Between wavenumber 1750 and 1250 per cm undefined peaks were found that are typical for mixed, cross-linked molecular aggregates.

Small windows from AMINO
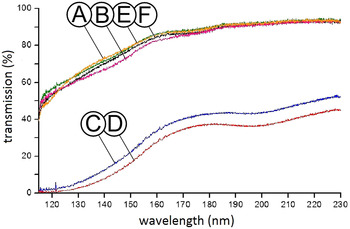
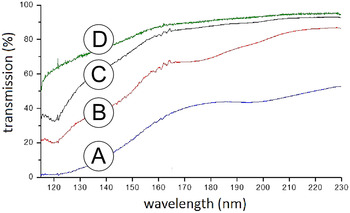
Thirty small windows at the top surface of Expose-R belonged to the AMINO experiment (Fig. 6). The AMINO windows were made of MgF2 and measured 11 mm in diameter, 1 mm in thickness. The samples of AMINO consisted of organic molecules deposited as a thin layer at the inner surface of the windows. Thus, the side where the brown circle emerged in the IBMP experiment (Fig. 8) was in AMINO coated by a film of chemical compounds as an integral part of the experiment. Contaminants settling at the inside of the AMINO windows could therefore blend with the test samples and disturb the scientific objectives of this experiment. Two windows were kept free of samples. Post-flight analysis by LISA showed that these reference windows had largely lost their transparency in UV-C and VUV (Fig. 13) in a way reminiscent of the small windows from IBMP (Fig. 11). Washing the inner side with dark soap, water, acetone and methanol provided a substantial improvement (Fig. 14). With both sides washed the transparency almost returned to pre-flight values in UV-C and near-VUV, but still not fully in far-VUV (Fig. 14). Polishing (cf. the IBMP experiment, Fig. 11) offered no further recovery from the transmission loss (data not shown).
Transmission loss of sample-free MgF2 windows from the AMINO experiment. Wavelength range VUV and UV-C. (A,B) Non-flown references. (C,D) Flown in space, exposed to Solar light. (E,F) Flown in space but not exposed to Solar light. Vertical axis: transmission 0–100%, horizontal axis: wavelength 115–230 nm.

Recovery from transmission loss of a sample-free MgF2 window from the AMINO experiment. Wavelength range VUV and UV-C. (A) Flown in space, exposed to Solar light. (B) After washing the inner surface. (C) After washing both surfaces. (D) Before space exposure. Vertical axis: transmission 0–100%, horizontal axis: wavelength 115–230 nm.

AMINO was equipped with dark controls which were protected against Solar light during space exposure. The dark controls contained two sample-free windows. After flight, both delivered the same transmission profile in UV-C/VUV as reference windows that had been kept on ground (Fig. 13).
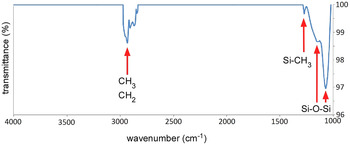
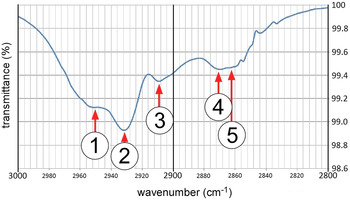
To unravel the chemical identity of the washable UV-blocker (Fig. 14), FTIR analysis was conducted by LISA on the sample-free windows. Two conspicuous groups of FTIR peaks were found (Figs. 15 and 16), one between 3000 and 2800 cm−1, the other below 1400 cm−1. Both clusters were absent on reference windows that had been kept in darkness during the flight. The molecular functionalities most likely present in the first group were CH3 and CH2, in the second group Si–CH3 and Si–O–Si. Figure 16 shows a close-up of the first cluster. For reference, see Lee Smith (Reference Lee Smith1960) and Romanenko & Tkachuk (Reference Romanenko and Tkachuk1973).
Post-flight FTIR spectrum of a Sun-exposed, sample-free AMINO window after subtracting the readings from a dark control. Functionalities most likely present: CH3, CH2, Si-CH3 and Si–O–Si. Vertical axis: transmittance from 96 to 100%. Horizontal axis: wavenumber per cm from 4000 down to 1000.

Close-up of FTIR peaks (range: 3000–2800 cm−1) displayed by a Sun-exposed, sample-free AMINO window. Functionalities most likely present: 1. CH3 anti-symmetric stretch, 2. CH2 anti-symmetric stretch for aliphatic chain, 3. Not known, 4. CH3 symmetric stretch for aliphatic chain, 5. CH2 symmetric stretch for aliphatic chain. Vertical axis: transmittance from 98.6 to 100%. Horizontal axis: wavenumber per cm from 3000 down to 2800.

Seeds
The single, rectangular window from the SEEDS experiment (Fig. 6) was not investigated after the flight.
Organic
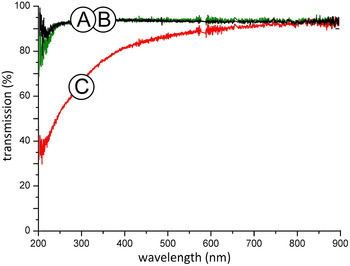
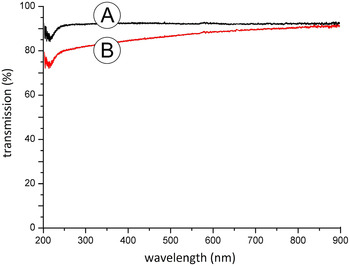
The ORGANIC experiment occupied 35 positions at the top surface of Expose-R2 (Fig. 6). Similar to AMINO, the samples of ORGANIC consisted of chemical compounds deposited at the inner surface of circular, 1 mm thick MgF2 windows. Two positions were occupied by sample-free windows for reference. After the flight the transmission was measured by NASA Ames. A degradation was displayed (Fig. 17) comparable with the small windows from IBMP (Figs. 9 and 10) and AMINO (Figs. 13 and 14). Like AMINO, ORGANIC was equipped with dark controls, which never saw Solar radiation during space exposure. In contrast to their Sun-exposed counterparts, the transparency of the dark controls was not affected by the spaceflight (Fig. 17). The transparency of the affected windows turned practically back to normal when the inner surface was rinsed with acetone (Fig. 18).
Transmission loss of a sample-free, Sun-exposed MgF2 window from the ORGANIC experiment. (A) Ground reference. (B) Flown in space but not exposed to Solar light. (C) Flown in space, exposed to Solar light. Vertical axis: transmission 0–100%, horizontal axis: wavelength 200–900 nm.

Recovery from transmission loss of a sample-free, Sun-exposed MgF2 window from the ORGANIC experiment. (A) Ground reference. (B) Flown in space, exposed to Solar light, after post-flight washing of the inner surface. Transmission prior to cleaning is shown in Fig. 17. Vertical axis: transmission 0–100%, horizontal axis: wavelength 200–900 nm.

R3D-R
Expose-R was equipped with an active sensor package called R3D-R to record UV-C (170–280 nm), UV-B (280–315), UV-A (315–400 nm) and photosynthetically active radiation (PAR, 400–700 nm) over time (Dachev et al. this issue). The three UV photodiodes were each contained in a small cylindrical capsule (height 4.5 mm, diameter 5 mm) with a circular quartz window on top. The PAR photodiode was contained in a similar capsule topped by a transparent polyamide cap (Fig. 19). Since the capsules were fully closed, the inner surface of the three quartz windows and the polyamide cap was only in contact with the photodiode, whereas the outer surface was exposed to the space environment.
The R3D-R was equipped with four photodiodes. Three were covered by a small circular quartz window in a metal ring. The fourth sensor was covered by a white-coloured polyamide disc which acquired a creamy colour during space exposure. Top row, left to right: pre-flight 14/8/2008, inside the ISS 7/3/2009, first day of exposure 10/3/2009. Bottom row, left to right: last day of exposure 21/1/2011, inside the ISS 28/1/2011, post-flight 23/3/2011.

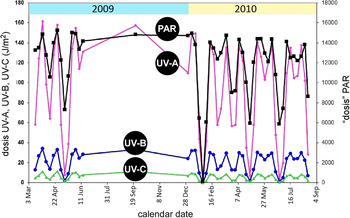
Expose-R was in open space from 10 March 2009 till 21 January 2011. The weekly fluence measured by the R3D-R for UV-A, -B and -C and PAR is plotted in Fig. 20. After the flight the three quartz windows were visibly clean. The polyamide cap however had turned from white to yellowish (Fig. 19). This discolouration resulted in a modest drop of the PAR signal over time (Fig. 20). The plots from Fig. 20 indicate that a slight degradation of transmission was probably also suffered by the three quartz windows in front of the photodiodes. As the external space environment must have been the same for all windows on Expose-R, this would suggest that none of windows on Expose-R were contaminated from outside to the extent that the transparency in the UV range was strongly affected.
Mission fluence per week as recorded by the R3D-R from March 2009 till September 2010. Black: PAR, purple: UV-A, blue: UV-B, green: UV-C. The big swings over time are due to the changing attitude of the orbital plane of the ISS w.r.t. the Sun (=the beta angle). During 2009 the solar recordings by the R3D-R were interrupted for many months due to a failure of an on-board computer. After September 2010 no data were acquired. Horizontal axis: time (3 March 2009–4 September 2010). Vertical axis: fluence of UV-A, -B and -C in J m−2, PAR in arbitrary units.

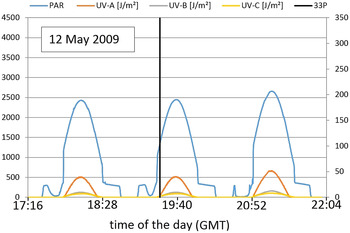
Several Soyuz and Progress capsules have docked in close vicinity of Expose-R during the 22 month exposure period (Table 3). During the final 15 min prior to docking, the thrusters from visiting vehicles are fired closely to the docking port (personal communication by astronaut Frank de Winne). In case exhaust products from thrusters were sprayed onto the top surface of Expose-R during the docking events, this might have resulted in contamination, even degradation, of the R3D-R sensor windows with an ensuing drop in the output signal of the photodiodes. The high recording rate of the R3D-R (one data point per 10 s) would even permit to detect contamination deposited temporarily on the surface of Expose-R. Temporary contamination may occur when pollutants are first deposited, and next released by evaporation. To check for transient contamination, the output signals delivered by the four R3D-R sensors were investigated over the timeframes that visitors were docking. The outcome of this investigation was negative; the sensors were not temporarily blinded during docking. An example is shown in Fig. 21.
Sensor output of the R3D-R during three orbits around the time that Progress 33P was docking. Black vertical line: moment of docking (12 May 2009 at 19:24:23 GMT).

Docking events in vicinity of Expose-R during the period that R3D-R was acquiring data

Contamination sources
With the indications for hydrocarbons and Si-containing compounds provided by the FTIR spectra (Figs. 5, 12, 15 and 16) and Raman (Butenko Reference Butenko2012), an inventory was made of materials contained inside Expose-R that could possibly have delivered the volatiles that were incorporated in the contamination films on the windows.
Biological test samples
All biological test samples were desiccated before flight, but not outgassed. As such, they must all be considered as potential sources of contamination. The experiment-specific distribution of the biological samples over the sample compartments (Table 2) would partially explain why the chemical features of the contamination films were not identical in each compartment (Figs. 5, 12 and 15). However, the biological samples cannot have delivered the Si-containing compounds (Figs. 5, 12 and 15).
Chemical test samples
No biological samples were used by the experiments AMINO and ORGANIC. Instead, the test samples consisted of organic molecules, deposited as a thin layer at the inner surface of the windows. It is practically impossible that these chemical films produced volatiles that were incorporated in the contamination films detected on the sample-free windows (Figs. 13, 14, 17 and 18). Also, there were no Si-containing compounds among the test samples of AMINO and ORGANIC. The chemical samples can therefore not be held responsible for the Si-peaks in Fig. 15.
Viton
A brownish colour was not only found at the inner surface of the windows but also on the Viton O-rings (RUAG 2011a). Used to seal the sample compartments towards the outside environment, these O-rings were inserted between the windows and the compartments. The brown colour on the O-rings was confined to the side facing the interior of the compartments. The question whether the O-rings had possibly produced contaminants, which then propagated onto the windows, or the other way around, that the O-rings and windows were both contaminated from another source, was resolved by RUAG in favour of the latter option (RUAG 2011a). The brown layer on the O-rings was definitely a deposition, not a degradation of the elastomer the O-rings were made of.
Wacker RTV-S 691 adhesive
RTV-S 691, based on silicone rubber, was used to glue the biological samples into the sample carriers. It was present in all compartments from Table 1. If nominally cured at room temperature, this adhesive has an outgassing potential of CVCM = 0.07% (mass fraction that would still condense at room temperature after outgassing in high vacuum) and an RML = 0.35 (mass fraction of molecular outgassing species except water). If post-cured at 65 °C – a procedure not followed during the flight preparations because it would affect the biological test samples – the outgassing potential can be reduced, but not fully eliminated (ESA-ESTEC 2004). It makes RTV-S 691 a very likely source of silicone contamination. However, no RTV-S 691 was used in the sample compartments of IBMP, AMINO, SEEDS and ORGANIC (Fig. 6). Still, Si-containing compounds were also here distinct contributors to the contamination (Figs. 12 and 15).
Henkel Hysol EA 9361 adhesive
Hysol EA 9361, an epoxy paste adhesive, was used to fix the optical filters (Table 2) into their frames. This glue was present in all compartments from Table 1, the exception being compartment 3–2 which was equipped with the heavily contaminated window nr. 23. Curing of Hysol does not immediately pose a problem (as it does for Wacker RTV-S 691) because the filters can be glued into their frames in the absence of the biological samples. Such was done when Expose-R was prepared. The outgassing potential of this adhesive is similar to RTV S 691. Hysol does not release silicone species but mainly C–H and C–O/C = O containing compounds.
3M Scotch-Weld adhesive
Scotch-Weld, an epoxy adhesive, was used to secure screws where no helicoils were present. The use of Scotch-Weld was confined to the compartments occupied by IBMP, AMINO, SEEDS and ORGANIC (Fig. 6). Epoxy outgassing products contain mostly C–H and C–O/C = O chemistry.
Polymethylmethacrylaat
Each sample compartment from Table 1 contained a small plastic box made of polymethylmethacrylat (PMMA), containing passive thermoluminescent detectors and polyallyldiglycol carbonate radiation detectors. PMMA is a polymer made of hydrocarbons and ester derivatives.
Polyolefin
Polyolefin, a polymer made solely of hydrocarbons, was used to contain the biological samples from IBMP (Fig. 7) (Novikova et al. this issue). Absorbing VUV light, any polymer tends to decompose with formation of various gaseous products, specific for the chosen polymer. Some of these products could have taken part in the formation of the brown deposits on the windows.
Electronics and heaters
The evacuated sample compartments were connected to the interior of the core facility of Expose-R where electronics and heaters were installed. If molecular traffic occurred from the core facility into the sample compartments, a broad range of molecular contaminants may have been included (hydrocarbons, silicones, esters, urethanes, etc.)
Discussion
Evidence was produced that during orbital flight the windows at the zenith-pointing top surface of Expose-R lost a substantial part of their transparency, in particular in UV and VUV. A brown-coloured contamination film was detected at the inside of the windows. The appearance of the film turned out to depend on two prerequisites: 1. Solar irradiation and 2. vacuum behind the window. The latter was provided by a venting system, which connected the interior of the sample compartments to outer space.
A comparable loss of window transmission caused by a brownish deposit at the inside of the windows was reported after the flight of Expose-E in 2009. Indications were found on Expose-E that a higher Solar fluence leads to a higher loss of window transmission (van Papendrecht et al. Reference van Papendrecht, Butenko, Bolkhovitinov, Demets, Rohr and Semprimoschnig2013). In a quantitative sense the contamination on Expose-E was less prominent than on Expose-R, a difference that can be linked to Solar irradiation: The top surface of Expose-R received a total fluence of 17 GJ m−2, for Expose-E it was 6–12 GJ m−2 (Beuselinck & Van Bavinchove Reference Beuselinck and Van Bavinchove2011a, Reference Beuselinck and Van Bavinchoveb). The quantitative connection between the intensity of the brown colour and the fluence of Solar radiation (van Papendrecht et al. Reference van Papendrecht, Butenko, Bolkhovitinov, Demets, Rohr and Semprimoschnig2013) is in agreement with the new finding from Expose-R that reference windows, protected against Solar radiation but otherwise flown under the same conditions as the Sun-exposed windows, remained perfectly clean (Figs. 13 and 17).
On Expose-E an -R, Sun-exposed windows placed on top of pressurized compartments were not affected. To understand why, one has to keep in mind that the release of volatile organic compounds is different in vacuum (outgassing) and at atmospheric pressure (offgassing). In vacuum, the release rate is much faster and a wider spectrum of volatiles can be emitted, including heavier molecules. Typically, under high vacuum conditions the release rate becomes independent of pressure and depends on matrix diffusion and activation energy.
The explanation provided above is compliant with most of the observations, but not with all of them. In the Mission Ground Reference (MGR, a replication of the flight experiment on ground, see Rabbow et al. this issue) there was no window contamination at all. To find out why, the test conditions in the MGR must be compared with the situation in orbit. At least three factors were different in the MGR:
Firstly, in the MGR Solar irradiation was mimicked with the SOL 2000, an instrument that provides UV from 200 nm and up. It means that the high-energy compound of the Solar UV spectrum was missing. Still, the cut-off at 200 nm does not credibly explain why no windows were polluted in the MGR. The problem is the contamination of flight windows nrs. 8 and 10 (Figs. 3 and 4, Table 1). Their inner surface never received UV < 200 nm because the window material was SiO2. It suggests that in principle, windows could get contaminated under the light regime offered by the SOL 2000.
Secondly, there was no ‘core facility’ in the MGR. The core facility is the suitcase-sized rectangular box, which accommodates the trays and sample carriers and provides the mechanical and electrical interfaces with the ISS. Figure 2 shows the trays and carriers installed in the core facility. Perhaps, the presence of the core facility was a pre-condition for the contamination to occur. If so, the core facility would be a major provider of the volatile compounds from which the brown films are composed. This idea is not far-fetched. All sample compartments that were evacuated during the flight (=the ones with contaminated windows) were equipped with venting lines to establish a connection to the interior of the core facility; the latter was in direct contact with the space environment by means of a series of small open holes. Molecules evaporating from the interior of the core facility may have travelled through the venting lines to end up inside the sample compartments behind the windows. The core facility contained electronics and heaters, potential producers of volatile pollutants. Note that the evacuation of the sample compartments simply occurred by the opening of valves in open space, without a vacuum pump. Contamination coming from a pump can therefore be excluded.
Thirdly, it is known that the outer surface of the ISS is not only attacked by cosmic particles and atomic oxygen, but also by contaminants delivered from venting ports, thrusters, combustion products from visiting vehicles, etc. These chemicals permanently surround the ISS as a cloud. That dirty cloud was absent in the MGR. Still, in terms of physics it is not easy to imagine how foreign molecules at extremely low pressure can find their way first through venting holes into the core facility and next through venting lines into the sample compartments. The pressure outside the ISS is variable and fluctuates between 10−7 and 5 × 10⁻⁴ Pa (Tighe et al. Reference Tighe, Iwanovsky, van Eesbeek and Duzellier2009). In conclusion, if the external atmosphere of the ISS played a role in the transmission loss of the Expose-R windows, it should have been primarily at the outer window surface, not the inner surface.
The outer surface of the windows has so far been left out of this discussion. Before Expose-R was moved out of the ISS for external exposure, an incident happened whereby a crew member touched with his bare skin the small MgF2 windows of ORGANIC. This could have led to a reduced transparency of these windows. No verification was possible however after flight, because when the 22 month exposure period was over the outer surfaces of Expose-R including the windows were wiped clean by the crew using tissues wetted with 3% H2O2. This cleaning process was part of a standard procedure, the objective was to remove any toxic products (originating from the dirty cloud, see above) from equipment that had stayed outside. Figure 1 taken after the exposure period but before the cleaning had begun, shows that the darkening was confined to windows nrs. 23, 5, 10 and 8 (Fig. 4). It means that any external deposit removed by the crew must have been colourless. If there were a colourless, wipeable deposit at the outer surface of the windows, this still could have acted as a UV-blocker. In that case, only UV at wavelengths <170 nm should have been blocked because the UV-C sensor of the R3D-R (sensitivity: 170–280 nm) appeared to deliver a signal at almost full strength throughout the mission (Fig. 20). Note that the recordings from Fig. 20 were made before the crew started to wipe Expose-R clean.
There is direct evidence that the outer surface of the windows was not so much polluted during space exposure, but still underwent a chemical attack. XPS analysis by RUAG revealed a 20 nm thick corrosion layer at the outer surface of MgF2 window nr. 23 with Si, C and O as the main contributors (RUAG 2011b). Evidently, that layer could not be removed with H2O2-impregnated wipes. Although more than twice as thick as the brown-coloured film at the inner surface, the outer layer turned out to be fully transparent over all wavelengths >200 nm (RUAG 2011b). Considering that the external space environment must have been the same for all windows, a corrosion layer as reported for window nr. 23 was probably present at the outer surface of all MgF2 (and possibly also SiO2) windows. If such were the case, then the affected outer layer contributed not (or only little, see Fig. 18) to the reduction of transmission in VIS and UV. Figures 11 and 14 however suggest that flight-induced changes at the outer surface may have contributed to the reduction of window transmission in the VUV range (<200 nm).
In summary, the main culprit for the transmission loss appears to be the layer deposited at the inside of the windows, built from volatile compounds originating from the Expose-R facility and its contents (‘self-contamination’). Photo degradation and fixation by Solar light must have turned these compounds into macromolecular, polymeric films firmly attached to the window surface. Compartment-specific differences were found in the transmission curves (Fig. 4) and FTIR profiles (Figs. 5, 12 and 15) of these films. This suggests that the pollutants were, at least partly, delivered by the test samples themselves, because the sample composition was different per compartment.
The FTIR technique is a see-through method which, in principle, does not tell if the observed features pertain to the inner or outer surface of the investigated window. Still, the obvious differences in FTIR signatures (Figs. 5, 12 and 15) can only be attributed to the inner window surfaces, because the outside of all windows was exposed to an identical environment during the spaceflight. The FTIR spectra were intended to identify the chemical compounds involved in the contamination layer qualitatively, not quantitatively. The latter is in principle possible as well using FTIR, but requires additional calibration procedures plus knowledge about the nature of the contaminants, which was – and still is – not fully available.
Non-biological parts in the sample compartments, in particular the adhesives, appear to have played a role as well. An important contribution from the core facility cannot be ruled out, as explained above. New, preliminary data obtained by mass spectroscopy at CNRS in Orléans hint at the possible involvement of polyethylene glycol (PEG), polypropylene glycol (PPG) and phthalates. PEG and PPG are very common synthetic plastics, phthalates are substances added to plastics to increase their flexibility, transparency, durability and/or longevity. These compounds have CH3, CH2 and C = O functionalities, which are in accordance with the FTIR spectra.
Conclusions
A next Expose mission has currently been started. Called Expose-R2, a new set of trays, carriers and samples has been uploaded to the ISS. The core facility will be the same one that served on Expose-R. Therefore, Expose-R2 will utilize a core facility that has been seasoned for 22 months in near-vacuum. It means that the outgassing potential should be minimal under the thermal operational environment. That would leave the fresh samples and the glues as the main producers of contaminants on Expose-R2. This obstacle is planned to be tackled by a new operational procedure in orbit. After installation outside the ISS, the windows will not immediately be exposed to the Sun (as was the case for Expose-R). Instead, a protecting hood will remain in place for minimally 6 weeks. Throughout that period, the venting lines will stay open to allow evacuation. Expectedly, the samples and the glues can release part of their volatile compounds without an ensuing photofixation at the window surface. Instead, it is hoped that the vaporized molecules will exit from the sample compartments through the venting lines. When later on the hood is removed to expose the samples to Solar light, the already outgassed volatile compounds should have disappeared, minimizing the potential for continual photofixation processes.