A standard approach to item selection in computerized adaptive testing (Barrada, Reference Barrada2012; van der Linden & Glas, Reference van der Linden and Glas2010) has been to select the item with the maximum Fisher information (MFI) as the next item (Lord, Reference Lord1980):
 $$j = \arg {\max _{i \in {B_q}}}{I_i}\left( {\hat \theta } \right)$$
,
where B
q
is the set of items that are evaluated for possible presentation, I is the Fisher information, and
 $\hat \theta$
is the estimated trait level.
In doing so, certain items tend to be used more often than others, while some are never presented, making item exposure rates somewhat uneven. This has resulted in two main problems: The first is economic, given the money spent on developing the unused items; the second is security-related, because of the risk of item-sharing among the often-used items (Chang, Reference Chang and Kaplan2004; Davey & Nering, Reference Davey, Nering, Mills, Potenza, Fremer and Ward2002). Various alternative item selection rules have been proposed to remedy this situation, some dealing with underexposure, others focused on overexposure (see Georgiadou, Triantafillou, & Economides, Reference Georgiadou, Triantafillou and Economides2007, for a review). Among those which have aroused most interest in the last years are stratified methods (Chang & Ying, Reference Chang and Ying1999).
The logic of stratified methods is to administer low-informative items at the beginning of the test, and to leave the administration of more highly informative items as the test goes on. In all the stratified methods, those items from the item pool that can be administered are determined according to their position in the test length. We will follow the maximum information stratification with blocking method (MIS-B) proposed by Barrada, Mazuela, and Olea (Reference Barrada, Mazuela and Olea2006), as it outperforms the original a-stratified method from Chang and Ying (Reference Chang and Ying1999) in both security and accuracy.
In the MIS-B method, B
q
vary according to the item position in the test sequence (q). At the beginning of the test, only those items with low maximum Fisher information (
 ${I^{\max }}$
) are available. As the test goes on, the mean
 ${I^{\max }}$
of the items administered increases, leaving the items with high a parameters and low c parameters ready for use at the end of the test. Stratifying by taking into account (blocking) the trait level point (θ) where
 ${I^{\max }}$
is achieved (
 ${\theta ^{\max }}$
) makes the distribution of
 ${\theta ^{\max }}$
as similar as possible between strata. The MIS-B method mimics the idea of the a-stratified method with b blocking (Chang, Qian, & Ying, Reference Chang, Qian and Ying2001) changing a parameter to
 ${I^{\max }}$
and b parameter to
 ${\theta ^{\max }}$
.
With this method, the item selected will be the one with the smallest distance between the estimated trait level and
 ${\theta ^{\max }}$
:
 $$j = \arg {\min _{i \in {B_q}}}\left| {\hat \theta - \theta _i^{\max }} \right|$$
.
Further details of the MIS-B method can be found in Barrada et al. (Reference Barrada, Mazuela and Olea2006).
Stratified methods, compared with selection by means of maximum Fisher information, improve the security of the item bank, leading to an overlap rate near to the minimum possible overlap rate, while decreasing accuracy (Chang & Ying, Reference Chang and Ying1999). Overlap rate is the mean proportion of items shared by two examinees (Way, Reference Way1998). Also, with these methods, the maintenance of the item bank is facilitated as item usage is not related to a high a parameter.
Defining the number of strata
To stratify the item pool, the number of strata (S) must be defined. The admissible values for S range from 1 (no stratification) to Q (Q being the test length). Up to now, there has been no clear rule to set S, so this decision in each new study is based on common practice in the field, chosen S values usually ranging from 2 to 5 (e.g., Cheng, Chang, Douglas, & Guo, Reference Cheng, Chang, Douglas and Guo2009; Deng, Ansley, & Chang, Reference Deng, Ansley and Chang2010; Han, Reference Han2012; Leung, Chang, & Hau, Reference Leung, Chang and Hau2005; Yi & Chang, Reference Yi and Chang2003). In other words, there is no clear guidance on the optimal number of strata. In a recent study, it has been shown that varying the number of strata in the MIS-B method changes the results in terms of accuracy and test security (Barrada, Abad, & Olea, Reference Barrada, Abad and Olea2011). In that paper, however, the number of strata was not the main focus of research, so no exhaustive manipulation of the number of strata was applied, and just 1, 2, and 5 strata were evaluated.
Barrada, Olea, Abad, and Ponsoda (Reference Barrada, Olea, Ponsoda and Abad2010) have noted that, when results of several methods differ simultaneously in accuracy and security, defining the best alternative is problematic, as no method dominates the other. A strategy for comparing item selection conditions in those conditions is to manipulate r max (the maximum exposure rate that no item should surpass). The control of r max is a common method for improving item bank security: It reduces the size of B q , sometimes leaving items that would be overexposed if no restriction was applied out of the evaluable set (Barrada, Abad, & Veldkamp, Reference Barrada, Abad and Veldkamp2009). The control of r max can be combined with any function for evaluating items for selection. The conjunction of restriction of r max and a-stratified method was first proposed by Leung, Chang, and Hau (Reference Leung, Chang and Hau2002).
Barrada et al. (Reference Barrada, Olea, Ponsoda and Abad2010) have noted that r
max
should be manipulated on more than one level. As they have shown, the control of r
max
on 10 levels, ranging from
 $r_1^{\max }$
equal to the minimum possible value for r
max
(test length divided by item bank size) to
 $r_{10}^{\max }$
equal to 1 (which is equivalent to not applying any restriction on the maximum exposure rate), allows for the comparison of item selection conditions in all domains of the functions of RMSE and overlap rate. This idea has been applied by Barrada, Olea, and Abad (2008a) for comparison between rotating items banks and the restriction on maximum exposure rates in a master bank and by Barrada et al. (Reference Barrada, Olea, Ponsoda and Abad2010) for the comparison of different item selection rules.
With this strategy, we obtain tables of results with RMSE and overlap rate for 10 different conditions, starting with maximum item exposure control and finishing with no item exposure control. We have one independent variable (r max ) and two dependent variables (RMSE and overlap). With these data, it is possible to obtain the curves that relate r max with RMSE and r max with the overlap rate. Also, with this information it is possible to plot the graph that relates the overlap rate with RMSE. The preferred condition is the one that, with an equal RMSE value, offers a lower overlap rate; or, in the other sense, with an equal overlap rate value, leads to lower RMSE. When the selection of items by means of maximum Fisher information and by means of the MIS-B method were compared (item banks stratified in 5 strata), Barrada et al. (Reference Barrada, Olea, Ponsoda and Abad2010) found that MIS-B should be preferred when item bank security is a main concern and overlap rate must be near its minimum possible value. However, it is unclear if the optimal number of strata was used in the comparison.
Our proposal is to apply this strategy to the problem of the number of strata. As the question about the optimum number of strata cannot be answered theoretically, two simulation studies using the comparison method proposed by Barrada and colleagues (Barrada, Olea, & Abad, Reference Barrada, Olea and Abad2008; Barrada et al., Reference Barrada, Olea, Ponsoda and Abad2010) were carried out. In the first study, we used banks with randomly generated item parameters. In the second, we used the estimated parameters of a currently operative bank. After these two studies, general discussion and conclusions will be provided. Our goal is to provide evidence based guidance about the correct number of strata.
STUDY 1
Method
Item banks and test length
Ten item banks of 480 items were generated. The distributions for the parameters were: a ∼ N(1.2, 0.25); b ∼ N(0, 1); c ∼ N(.25, .02). We simulated two different test lengths (Q), 20 and 40 items.
Trait level of the simulees, starting rule, and trait estimation
The trait level of the simulees was randomly generated from a population N(0, 1). For each of the 10 item banks, 5,000 simulees were sampled. The starting
 $\hat \theta$
was chosen at random from the interval (–0.5, 0.5). Dodd’s (Reference Dodd1990) procedure was applied for the trait level estimation until each examinee obtained correct and incorrect responses: when all the responses were correct,
 $\hat \theta$
was increased by (b
max –
 $\hat \theta$
)/2; if all the responses were incorrect,
 $\hat \theta$
was reduced by (
 $\hat \theta$
– b
min)/2 (where b
max and b
min correspond, respectively, to the maximum and minimum b parameter in the item bank). Once the constant pattern was broken or the test was finished, maximum-likelihood estimation was applied, with the restriction that
 $\hat \theta$
had to be in the interval [–4, 4].
Control of rmax
Following advice by Barrada et al. (Reference Barrada, Abad and Veldkamp2009), the item-eligibility method (van der Linden & Veldkamp, Reference van der Linden and Veldkamp2004) was applied. The variable r max was manipulated on 10 levels, as in previous studies (Barrada, Olea, & Abad, Reference Barrada, Olea and Abad2008; Barrada et al., Reference Barrada, Olea, Ponsoda and Abad2010).
Item selection rules and stratification of the banks
We compared the MFI and the MIS-B item selection rules. For the MIS-B, we applied all the possible divisors of test length as number of strata. That means that, for the test of 20 items, S could be 1, 2, 4, 5, 10, or 20, and for the test of 40 items, S could be 1, 2, 4, 5, 8, 10, 20, or 40. The number of items administered in each stratum was constant across strata and equal to
 $Q/S$
.
Performance measures
Two dependent variables were used for the comparison between methods: RMSE and overlap rate. RMSE is a measure of accuracy, calculated with Equation 2:
 $$RMSE = \left( {\sum\limits_{g = 1}^r {{{\left( {\hat \theta _g - \theta _g } \right)^2 } \mathord{\left/ {\vphantom {{\left( {\hat \theta _g - \theta _g } \right)^2 } r}} \right. \kern-\nulldelimiterspace} r}} } \right)^{{\raise0.7ex\hbox{$1$} \!\mathord{\left/ {\vphantom {1 2}}\right.\kern-\nulldelimiterspace}\!\lower0.7ex\hbox{$2$}}} $$
where r is the number of examinees,
 ${\theta _g}$
is the (real) trait level of the g-th examinee and
 ${\hat \theta _g}$
is the estimated trait level for that examinee.
Overlap rate is an indicator of test security. The following equation is the one used to calculate it (Chen, Ankenman, & Spray, Reference Chen, Ankenmann and Spray2003):
 $$T = {n \over Q}S_{er}^2 + {Q \over n}$$
,
where
 $T$
is the overlap rate, n is the item bank size and
 $S_{er}^2$
is the variance of the exposure rates of the items.
Results
Given that the results for the MFI are basically equivalents to those reported in Barrada et al. (Reference Barrada, Olea, Ponsoda and Abad2010), we will pay special attention to the results from the MIS-B. The results for the MIS-B method are also similar to those from Barrada et al. (Reference Barrada, Olea, Ponsoda and Abad2010) except in the manipulation of the number of strata.
Relation between the overlap rate and rmax
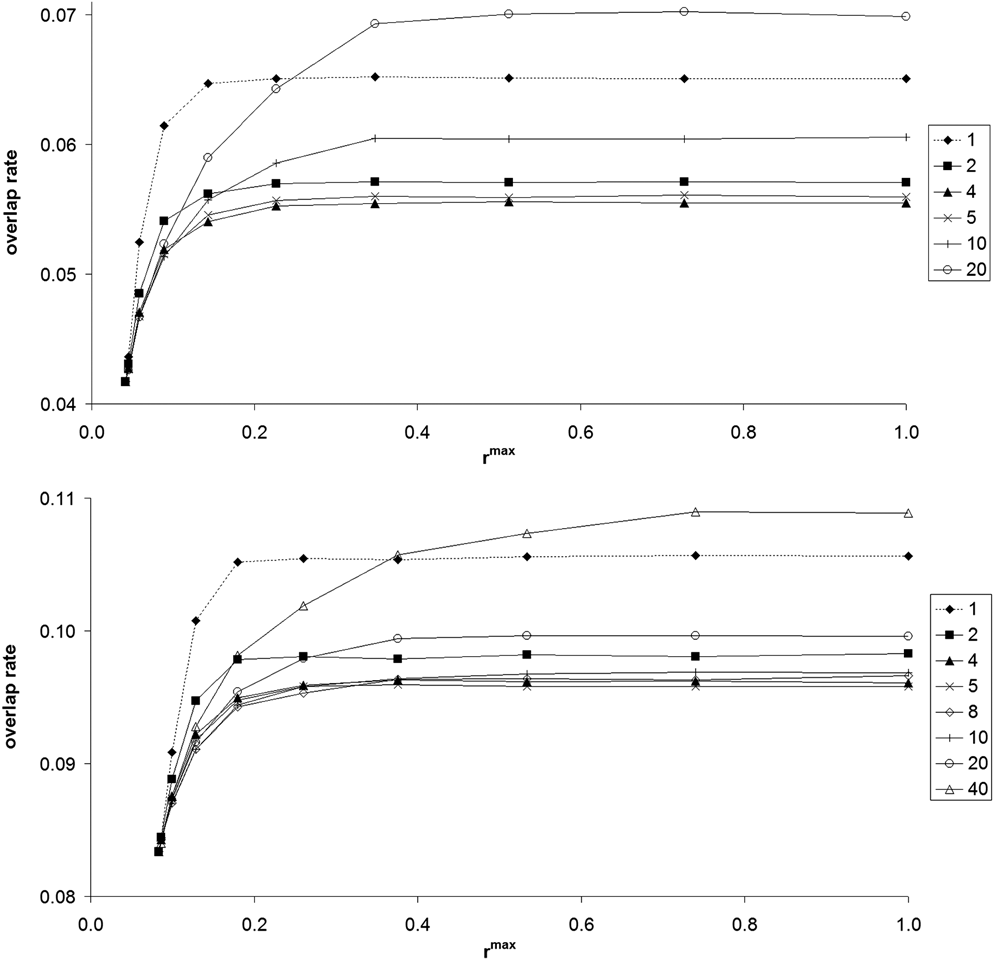
The relation between the overlap rate and r max can be seen in Figure 1. Results for each dot in the plot were based on 50,000 examinees (10 banks × 5,000 simulees). Several points should be noted. First, all the overlap rates are in the narrow interval of .03, as no restriction of r max already lead to an overlap rate near the minimum possible value.
Relation of r max and overlap rate for the randomly generated item banks and the MIS-B method. Top panel, test length of 20 items. Bottom panel, test length of 40 items.

Second, a high restriction on r max can be imposed without any effect on the overlap rate. The explanation for this is that, for all the different numbers of strata considered, the condition without restriction on r max (i.e., r max equal to 1), the maximum exposure rate was well below 1 (remember that initial trait level was not constant for all simulees). So, the points that are, for a given test length and number of strata, at the same height in Figure 1 can basically be considered replicas.
Third, the higher the number of strata, the higher the r
max
values when the overlap rate starts to decrease. When only a few items have been administered, the number of different possible trait levels estimations and its distribution deviates importantly from the distribution of
 ${\theta ^{\max }}$
in the bank. This implies that for the stratified methods the risk of overexposure is more severe at the beginning of the test and when the strata size is small (when the divergence between the distribution of
 ${\theta ^{\max }}$
in the strata and the distribution of
 $\hat \theta$
is maximal). A high maximum exposure rate when r
max
is equal to 1 means that high levels on r
max
will imply real restrictions on item exposure.
Fourth, the effects of reducing r max on the overlap accelerate as r max approaches its lower limit (Barrada, Olea, & Abad, Reference Barrada, Olea and Abad2008; Barrada et al., Reference Barrada, Olea, Ponsoda and Abad2010). As could be expected, all the conditions converged to the point of minimum overlap when maximum restriction on r max was imposed.
Finally, the main comparison is between conditions with varying numbers of strata. The lines in Figure 1 are not parallel, that is, the effect on overlap rate of restrictions on r max depends on the combination of numbers of strata and level of r max . When no restriction is imposed, maximum overlap rate is obtained with an extreme number of strata (20 and 1 strata for test length of 20 items; 40 and 1 strata with test length of 40 items) and the minimum overlap rate is achieved when the bank is divided into 4 or 5 strata. When r max approaches its minimum possible value, the number of strata that leads to the higher overlap rate changes: For instance, for both test lengths, with r max values below .23 a single strata leads to a higher overlap than as many strata as possible, reversing the result found when r max was 1.
Relation between the RMSE and rmax
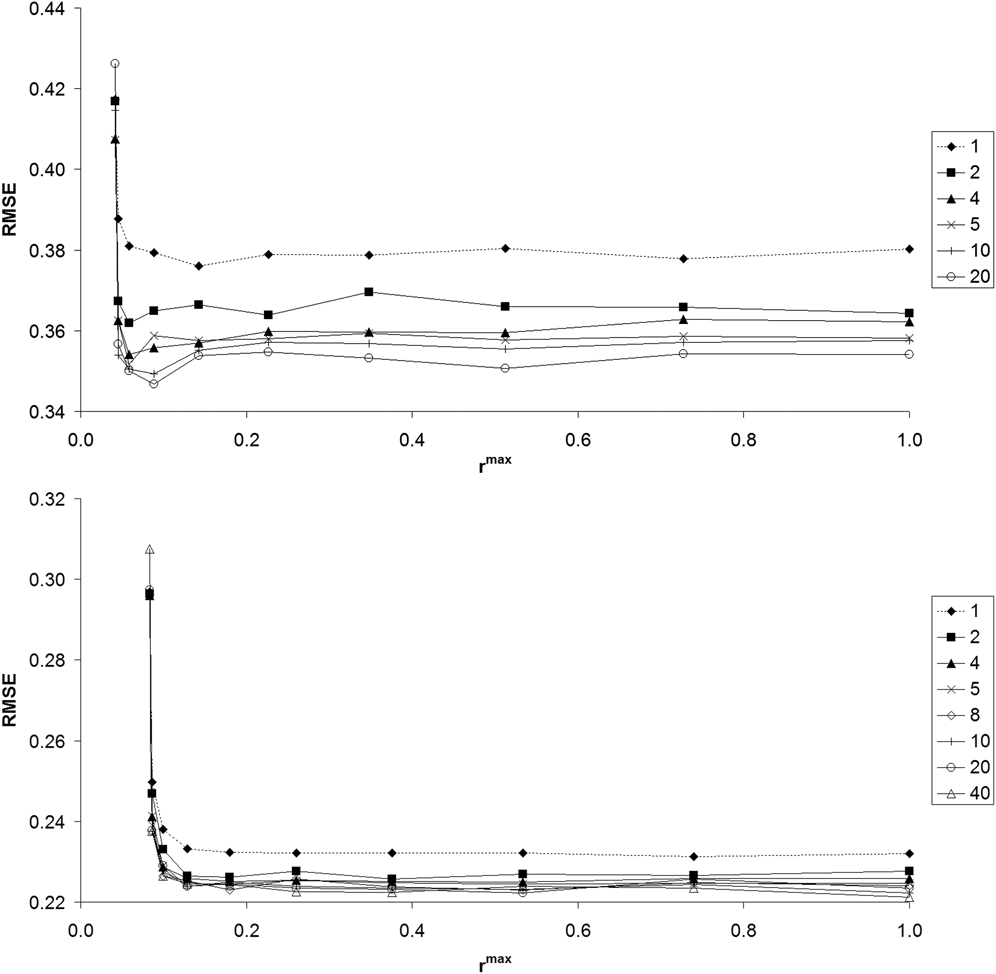
Figure 2 shows the relation between r max and RMSE. As could be expected, increasing the number of items administered improves accuracy. The higher the test length (or the lower the item bank size/test length ratio), the smaller the distance between conditions with a different number of strata: With 20 items administered the differences were no greater than 0.03 and with a test of 40 items the differences were smaller than 0.01. When no restriction on r max is applied, increasing the number of strata leads to reductions in RMSE, although for a test length of 40 items all the conditions with more than two strata show almost overlapping dots. The pattern that more strata lead to lower RMSE is maintained throughout the range of r max , with the exception of r max equal to its minimum. Importantly, a high restriction on r max can be imposed without impact on RMSE. For all the different number of strata conditions, the point where reductions in r max lead to increments in RMSE is lower than the r max point where the overlap rate starts to decrease.
Relation of r max and RMSE for the randomly generated item banks and the MIS-B method. Top panel, test length of 20 items. Bottom panel, test length of 40 items.

Relation between the overlap rate and the RMSE
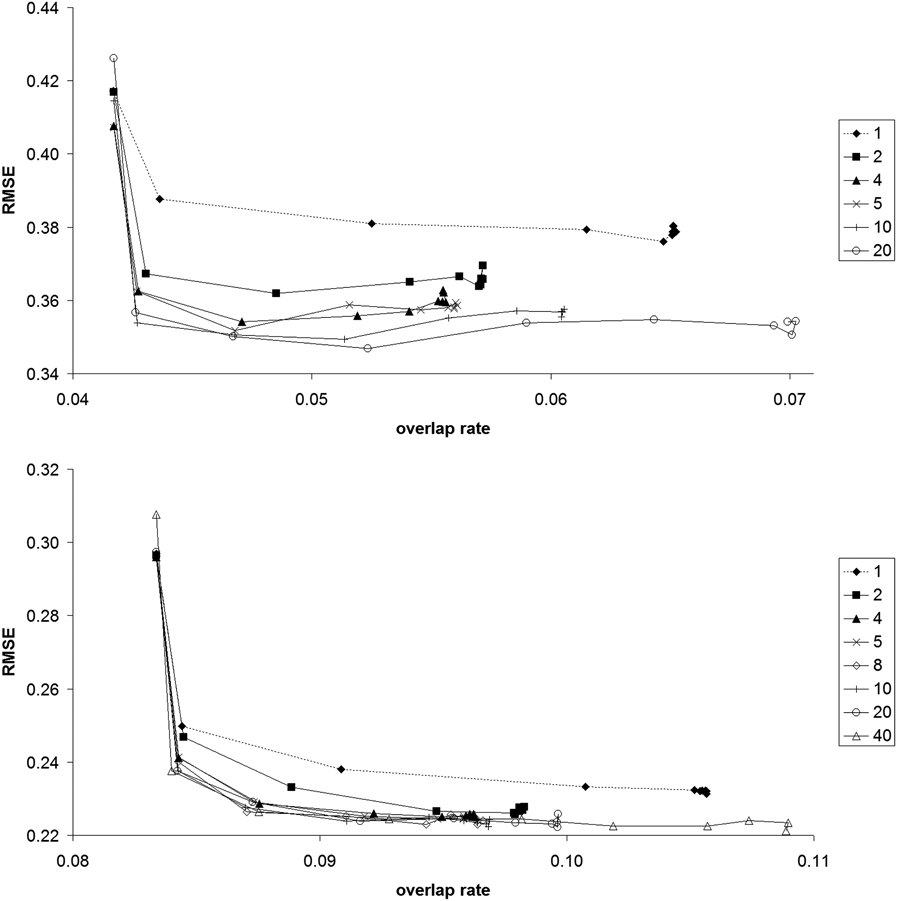
Figure 3 depicts the relation between the overlap rate and RMSE. This plot informs about the number of strata that lead to a lower overlap rate holding the RMSE constant (or the reverse) and which therefore should be preferred. All the information provided in Figure 3 is a rearrangement of data from previous plots. There are three main aspects to be noted. First, it is possible to greatly reduce the overlap rate without any sacrifice in RMSE. In other words, for the MIS-B method there is no reason to prefer a r max equal to 1 instead of a r max equal to .25, as the latter leads to better bank security with the same accuracy. The point where the RMSE bursts is near to the minimum possible overlap (Barrada, Olea, & Abad, Reference Barrada, Olea and Abad2008; Barrada et al., Reference Barrada, Olea, Ponsoda and Abad2010).
Relation of overlap rate and RMSE for the randomly generated item banks and the MIS-B method. Top panel, test length of 20 items. Bottom panel, test length of 40 items.

Second, and answering the main question of this study, the best option is to stratify with as many strata as possible, as that condition is represented by the lower line of the plot. Third, and qualifying this statement, increasing the test length reduces the differences between the alternatives. With a test length of 20 items, fixing the number of strata to 20 means an appreciable, although small, benefit when compared with 10 strata. With a 40-item long test, the differences between as many strata as possible and a number of strata higher than five are negligible.
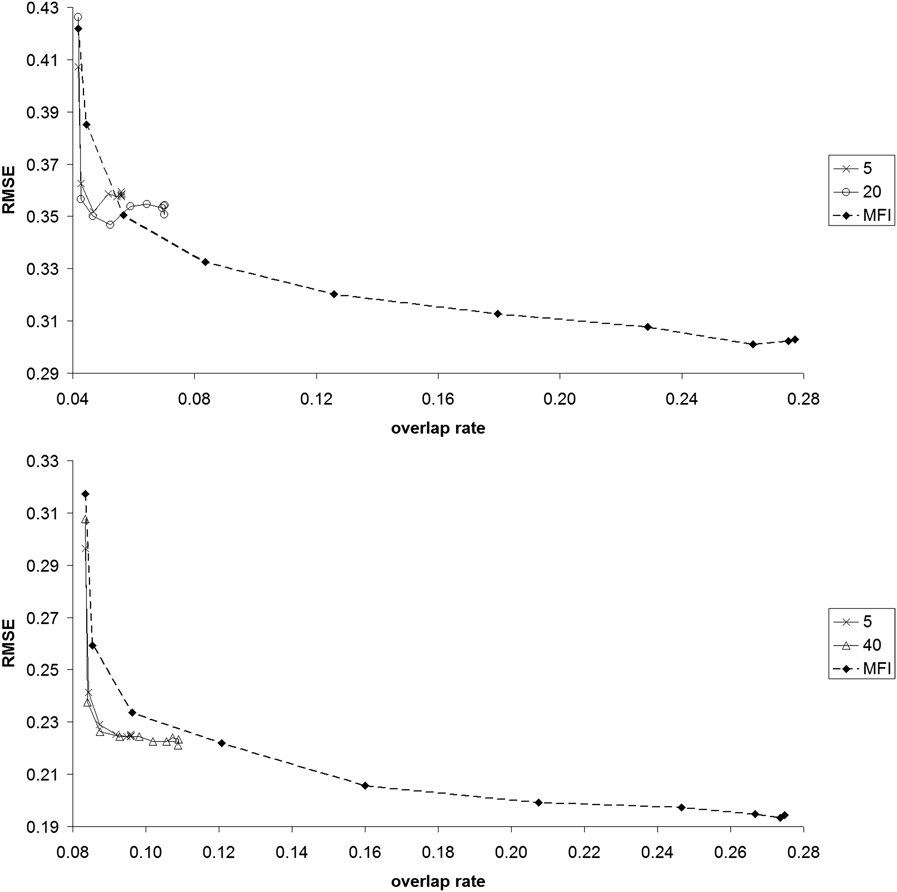
The comparison between the MIS-B and the MFI methods is shown in Figure 4. For simplicity, only lines for a common number of strata in published studies (5) and the maximum possible number of strata (Q) are shown. As could be expected, the MFI method allows for a higher accuracy, but with much higher overlap rate (dots in the lower right extreme of the figure).
Relation of overlap rate and RMSE for the randomly generated item banks, and the MIS-B and MFI methods. Top panel, test length of 20 items. Bottom panel, test length of 40 items.

The main conclusions from Barrada et al. (Reference Barrada, Olea, Ponsoda and Abad2010) still hold: The MIS-B should be preferred when an overlap rate near its minimum is required. Using the optimal number of strata increases the distance between the lines of the MIS-B and the MFI (mainly for a test length of 20 items), but without changing the general pattern.
In this study we have studied the problem of the optimal number of strata with a randomly generated item bank. To test whether these results can be generalized, the same comparison was carried out with a currently operative item bank.
STUDY 2
Method
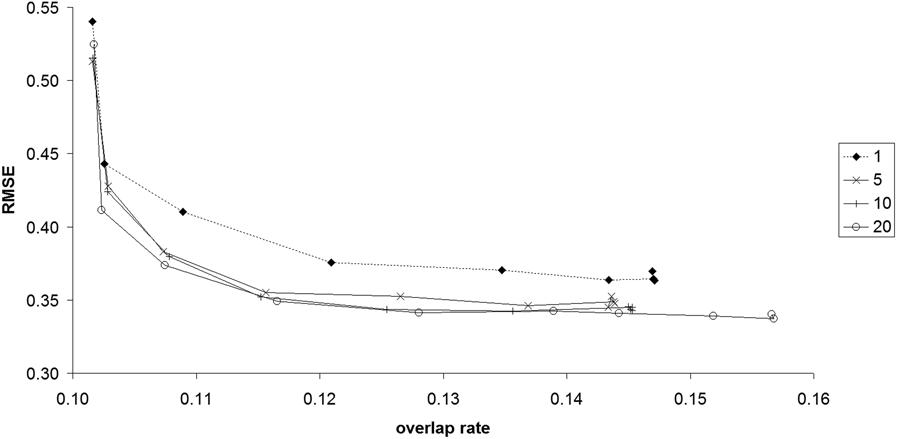
The method of this second study is equivalent to that of the first except in certain aspects which we describe now. For this study we used the item bank employed in eCAT-Grammar (Olea, Abad, Ponsoda, & Ximénez, Reference Olea, Abad, Ponsoda and Ximénez2004), a CAT for assessing knowledge of English grammar. The bank has 197 items. Although the parameters of the bank have recently been updated (Abad, Olea, Aguado, Ponsoda, & Barrada, Reference Abad, Olea, Aguado, Ponsoda and Barrada2010), we used the originals. The mean, standard deviation, minimum, and maximum for the a, b and c parameters were (1.30, 0.32, 0.43, 2.20), (0.23, 1, –2.71, 3.42) and (.21, .03, .11, .29), respectively. Test length was fixed at 20 items. For simplicity, only the conditions with 1, 5, 10, and 20 strata were simulated. The MFI method was not incorporated.
Results
The principal interest of this study is to decide on the optimal number of strata for the MIS-B method. The proper plot to answer this is the one that relates overlap rate and RMSE. We will therefore restrict our attention to the plot by showing both variables simultaneously. This information can be seen in Figure 5.
Relation of overlap rate and RMSE for operational item bank.

The pattern of results is equivalent to that shown in Figure 3. A high reduction in overlap rate can be obtained without any increment in RMSE. The option whose line is lower is to stratify the item bank into as many strata as items to be presented. The differences between 10 and 20 strata are negligible.
Discussion and conclusions
As expected, the method proposed by Barrada and colleagues (Barrada, Olea, & Abad, Reference Barrada, Olea and Abad2008; Barrada et al., Reference Barrada, Olea, Ponsoda and Abad2010) for the comparison of methods that differ simultaneously in terms of accuracy and security could be employed to determine the optimal number of strata. The pattern of results is highly coincident between both item banks, so we consider the results to be solid and generalizable. The general conclusion is that the best option is to stratify the item bank into as many strata as possible: When doing so, for the same levels of overlap, lower or equal RMSE is achieved. However, it must be noted that increments in the test length/item bank size ratio (20/480 vs. 40/480 in Study 1, or 20/197 vs. 20/480 in Studies 1 and 2) make the differences between conditions smaller. And, importantly, differences between the number of strata usually employed (S equal to 4 or 5) and as many strata as possible are almost trivial. So keeping the common practice implies little, if any, decrement in terms of accuracy or test security. This common practice can now be sustained by evidence.
However, some important limitations of the stratified methods should be noted. It is usually assumed that the stratified methods, when compared with the MFI method, lead to a higher test security with a cost of a higher measurement error. It is supposed that the stratified methods should be preferred when overlap rate is a main concern. Our results and those from Barrada et al. (Reference Barrada, Olea, Ponsoda and Abad2010) indicate that, for a range of overlap rate and when the test is short, it is possible to obtain an equivalent overlap rate between MFI and MIS-B with the former showing a lower RMSE. So, the stratified methods should not be “the default option” when security is a key element of the testing program. More doubts about the convenience of using the stratified methods are clear when other item selection rules, like the proportional method (Barrada, Olea, Ponsoda, & Abad, Reference Barrada, Olea and Abad2008), are considered (Barrada et al., Reference Barrada, Olea, Ponsoda and Abad2010).
Our study share the limitations of all fixed length adaptive testing. We have shown RMSE averages. We cannot guarantee that all the examinees will be assessed with a similar accuracy and that all the accuracies will be over a desired minimum. This problem is specially evident when we consider results conditional on trait levels (e.g., Deng et al., Reference Deng, Ansley and Chang2010; Olea, Barrada, Abad, Ponsoda, & Cuevas, Reference Olea, Barrada, Abad, Ponsoda and Cuevas2012). Trait estimation of examinees high extreme trait levels will be worse than the average, as the b parameter is normally distributed in the item bank.
The used method for comparing the number of strata and different item selection rules (Barrada, Olea, & Abad, Reference Barrada, Olea and Abad2008; Barrada et al., Reference Barrada, Olea, Ponsoda and Abad2010) is not sensitive to conditional problems on test security (e.g., Stocking & Lewis, Reference Stocking, Lewis, Van der Linden and Glas2000). We have only considered overall overlap rate. It is possible to obtain a low overall overlap rate and, however, that examinees with a similar trait level share a high proportion of items. Just considering overall overlap rate is a common practice in this kind of simulation studies. And, for the proposed method of comparison, considering conditional overlap rates would mean switching from simple plots with two variables to much more complicated results. We consider that the unconditional results, although limited, can help to make relevant decisions in operational testing programs. Clearly, further research is needed in the area of adaptive testing to allow for the evaluation of conditional results when multiple objectives (accuracy and security) must be maximized.
This research was supported by a grant from the Spanish Ministerio de Ciencia e Innovación (project number PSI2009–10341), and by a grant from the Fundación Universitaria Antonio Gargallo and the Obra Social de Ibercaja.