Introduction
Non-communicable diseases (NCDs), namely diabetes, cardiovascular and chronic lung diseases, and some types of cancer, underlie almost two-thirds of all global deaths. Maternal nutritional and metabolic status in early intrauterine life increase the risk of metabolic disorders including type 2 diabetes (T2D) and cardiovascular disease during lifetime.Reference Balbus, Barouki and Birnbaum3,Reference Hanson and Gluckman19 The association between birth weight and the risk of later adult diseases seems to be U-shaped. Children born small for gestational age are at higher risk of insulin resistance and cardiovascular diseases in adulthood and those born large for gestational age are at higher risk of obesity later in life.Reference Chiavaroli, Derraik and Hofman10,Reference Geserick, Vogel and Gausche17,Reference Salahuddin, Pérez and Ranjit36
During development, epigenetic marks (DNA methylation pattern, histone modifications, and noncoding RNA expression) present substantial changes that affect gene expression for early-life development and later-in-life physiological functions.Reference Balbus, Barouki and Birnbaum3 MicroRNAs (miRNAs) are noncoding single-stranded RNA molecules of 19–25 nucleotides long, that participate in posttranscriptional regulation of gene expression through interruption of translation and degradation of the target mRNAs. There have been described 2,588 human miRNAs which are expressed virtually in all human tissues and target to approximately 60% of all human mRNAs. These regulatory molecules play important roles in most biological processes.Reference Gulyaeva and Kushlinskly18,Reference Tonge and Gant43,Reference Wang, Samuels and Zhao49
A high number of human miRNAs (more than 500) are detectable in circulation. Occurrence of miRNAs in blood may be due to disruption of cell membrane after damage or by an active release process. The precise mechanisms involved are still under investigation but circulating miRNAs (c-miRNAs) allow the intercellular communication and can regulate metabolic processes in neighboring or distant cells.Reference Chen, Liang and Zhang9,Reference Freedman, Gerstein and Mick15,Reference Shu, Chiang and Zempleni39,Reference Tonge and Gant43 Some c-miRNAs have been reported dysregulated in children and adults with obesity and in people with T2D, nonalcoholic fatty liver disease, dyslipidemia, and cardiovascular diseases.Reference Auguet, Aragonés and Berlanga2,Reference Cui, You and Zhu12,Reference Shah, Murthy and Pacold38,Reference Silva, Carneiro and Almeida40,Reference Thompson, Cismowski and Serpico41
Recent studies have reported some c-miRNAs dysregulated in pregnant women with obesity and gestational diabetes and in newborns with low birth weight and macrosomia.Reference Carreras-Badosa, Bonmatí and Ortega6,Reference Rodil-Garcia, Arellanes-Licea and Montoya-Contreras35,Reference Wander, Boyko and Hevner48 These miRNAs appear to be associated with future metabolic and cardiovascular diseases.Reference Cui, You and Zhu12
We hypothesize that c-miRNAs reported as altered in adults with NCD may also be dysregulated in newborns with low birth weight (LBW) or macrosomia. Thus, the aim of this study was to quantify c-miRNAs previously reported as dysregulated in adult NCD (specifically obesity, insulin resistance, and T2D) in dried blood spots obtained from newborn screening cards (NSC), grouping according to birth weight, and to in silico predict the possible target genes and pathways for c-miRNAs found dysregulated.
Methods
Ethics statement
This study was approved by the Institutional Ethical Committee of the Instituto Potosino de Investigación Científica y Tecnológica. NSC were donated by the Laboratorio Estatal de Salud Pública, San Luis Potosí, México. Data were analyzed anonymously, and researchers had no knowledge of other clinical or identity information, except for “weight” and “gestational age”.
Characteristics of the cohort
Neonatal birth weights were defined as follows: LBW: <2,500 g, normal birth weight (NBW): 2,500–4,299 g, and macrosomia: >4,300 g, according to World Health Organization.52 Using the STPlan v.4.5v 2010 software,Reference Brown, Brauner and Chen4 we calculate a sample size of 17 per group to observe a twofold difference in miRNA expression, considering an alpha of 0.05 and power of 80%, so we randomly choose 20 NSC from full-term mixed gender neonates (37–41 weeks of gestation and 3–6 d of life), for each birth weight group, who were born during 2013–2014.
RNA purification
Total RNAs were isolated from dried blood spots (0.8–1 cm diameter to assure blood volumes of 50–75 µL per sample) remaining in processed NSC stored at room temperature (~22°C) for up to 2 years in plastic sterile bags, using a protocol previously standardized in our laboratory.Reference Rodil-Garcia, Arellanes-Licea and Montoya-Contreras35 Briefly, 300 µL of TE buffer (Tris-HCl 10 mM, EDTA 1 mM, pH 7.6) were added to a 1.5-mL tube containing an individual 0.8–1 cm diameter circle of dried blood sample in NSC for rehydration and vortexed at 2,000 rpm at 4°C for 30 min using a multi-tube holder on a Genie 2 vortex (Thermo Fisher Scientific, Waltham, MA, USA). We add 1 mL TRIzol reagent (Invitrogen, Carlsbad, CA, USA) and 200 µL chloroform and vortexed at 2,000 rpm at 37°C for 5 min. Then, we centrifuged at 14,000 rpm at 4 ºC for 15 min. We recover the aqueous phase and then dilute it with ethanol 100% (1:1). We mixed with vortex and add to the filter cartridge (miRVana miRNA isolation kit; Thermo Fisher Scientific, Waltham, MA, USA) 700 µl of the mixture. We filter by centrifugation at 10,000 rpm for 15 s and add to the mixture isopropanol and ethanol 2:1:1. We filtered by centrifugation again and add 500 µl ethanol of 100% at room temperature. We filtered by centrifugation and add 500 µl of wash solution 2 (miRVana miRNA isolation kit; Thermo Fisher Scientific, Waltham, MA, USA). We centrifuged at 10,000 rpm at room temperature 1 min. Finally, RNA was eluted with 100 µL of DEPC 0.1% (v/v) treated water at 95°C and centrifuged at 13,400 rpm for 30 s. All samples were analyzed in the 2100 Bioanalyzer (Agilent Technologies, Santa Clara, CA, USA) using the Small RNA Assay Kit (Agilent Technologies, Santa Clara, CA, USA) following the manufacturer’s instructions. Samples were kept at −70°C for long-term storage.
cDNA synthesis
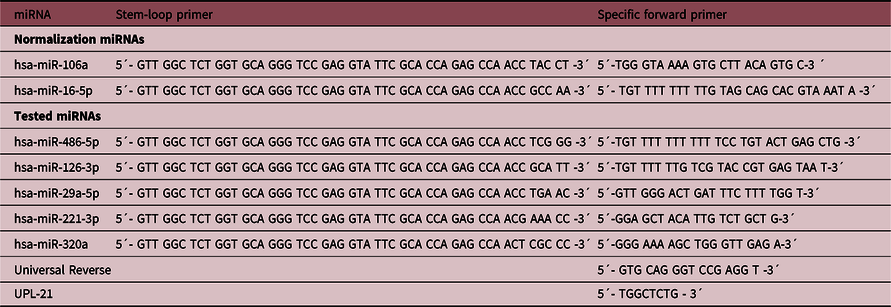
Total RNA recovered from NSC with <2 months of purification was subjected to retrotranscription using a specific stem-loop reverse transcription (RT) primer.Reference Chen, Ridzon and Broomer8 Mature sequences of selected miRNAs (Table 1) were obtained from miRBase v20.Reference Kozomara and Griffiths-Jones26 Primers for these miRNAs (Table 2) were designed using miRNA primer design tool softwareReference Czimmerer, Hulvely and Simandi13 and were synthesized by Integrated DNA Technology (IDT, Coralville, IA, USA). All primers were analyzed for secondary structure using OligoAnalyzer 3.1 software.
Selected miRNAs

Primers sequences

Stem-loop pulsed reverse transcription reaction was carried out.Reference Varkonyi-Gasic, Wu and Wood46 Briefly, a fixed volume of RNA was used for all samples (2 µL), plus 1 µL of stem-loop primer (100 µM), 2 µL of dNTP mix (10 mM mix), 0.1 µL of M-MLV reverse transcriptase (200 U/µL) (Promega, Madison, WI, USA), 4 µL of M-MLV RT 5 × Reaction Buffer, 0.032 µL of RNasin inhibitor (2,500 U/µL) and nuclease free water was added to a final volume of 20 µL per reaction. RT reactions were incubated at 16°C for 30 min, followed by retrotranscription for 60 cycles at 30°C for 30 s, 42°C for 30 s, and 50°C for 1 s and terminated by incubating at 85°C for 5 min.Reference Varkonyi-Gasic, Wu and Wood46 All reactions included a reverse transcriptase-lacking negative control. Samples were stored at −20°C until use. cDNA was diluted 1:5 before use.
Real-time quantitative PCR
Sequences of specific forward primers are listed in Table 2; universal reverse primer (URP) and universal probe library probe #21 (UPL-21) were the same for all miRNAs, according to Czimmerer et al.Reference Czimmerer, Hulvely and Simandi13 method. qPCR reactions were carried out on a Roche’s LightCycler 2.0 (Roche Diagnostics, Mannheim, Germany) using QuantiTect Probe PCR Kit (Qiagen, Hilden, Germany) in a final volume of 20 µL containing: 5 µL of cDNA dilution, 0.1 µL of 100 µM specific reverse primer, 0.1 µL of 100 µM URP, 0.2 µL of probe UPL #21 (Roche), and 4.6 µL of nuclease free water. PCR conditions were initial denaturation at 95°C for 10 min, followed by 50 cycles of 95°C for 10 s, 60°C for 30 s, and 72°C for 30 s, with a final hold at 40°C for 10 min. PCR reactions were performed by duplicate. We use a non-template control (NTC) and non-transcriptase reaction (NEG-RT) as negative controls.Reference Bustin, Benes and Garson5 There was no detection signal in NTC and NEG-RT after 50 cycles of amplification.
Since there are no normalizing genes for c-miRNAs analysis in human neonates, we used as reference genes miR-106a-5p and miR-16-5p, based on our previous research.Reference Rodil-Garcia, Arellanes-Licea and Montoya-Contreras35 NormFinder algorithm was used to identify the stability value of internal candidate reference genes.Reference Andersen, Jensen and Ørntoft1 Stability values for miR-106a-5p and miR-16-5p were 0.011 and 0.007, respectively. The relative abundance of selected miRNAs (miR-320a, miR-486-5p, miR-126-3p, miR-29a-5p, and miR-221-3p) from NSC from neonates with different body weight was normalized to miR-106a-5p and miR-16-5p. Relative quantification was obtained using the double delta threshold cycle (2−ΔΔCt) method and the geometric mean of miR-106a-5p and miR-16-5p relative to samples of NBW, plotted as fold change in miRNA expression.Reference Livak and Schmittgen27,Reference Vandesompele, De Preter and Pattyn45 To validate the comparative threshold cycle (CT) method, standard curves from each cDNA were prepared using serial dilutions to obtain the efficiencies for each gene. We determine that efficiencies for the normalizing miRNAs were 1.99 for miR-16-5p and 2.01 for miR-106a. Efficiencies for the analyzed miRNAs were 1.95 for miR-29a-5p, 2.14 for miR-126-3p, 1.99 for miR-221-3p, 2.20 for miR-320a, and 2.16 for miR-486-5p.
Statistical analysis
To test the differences on miRNAs’ relative expression between groups, one-way ANOVA was performed followed by Tukey’s honest significant difference (HSD) post hoc test (confidence interval 95%). Statistical analyses were done using R Software and GraphPad Prism version 5.00 (GraphPad Software Inc., San Diego, CA, USA).
Bioinformatic analyses
We analyzed the putative target genes and pathways of dysregulated miRNAs using DIANA-miRPath v.3.0Reference Vlachos, Zagganas and Paraskevopoulou47 and included predictions from Tarbase v7.0, TargetScan y microT-CDS v5.0. We chose miRTargetLink Human30 to select the predicted genes with shared interactions with dysregulated miRNAs and WebGestalt 2017Reference Wang, Vasaikar and Shi50 to perform over-representation analyses with these genes.
Results
miR-29a-5p, miR-126-3p, miR-221-3p, and miR-486-5p but not miR-320a are overexpressed in neonates with macrosomia
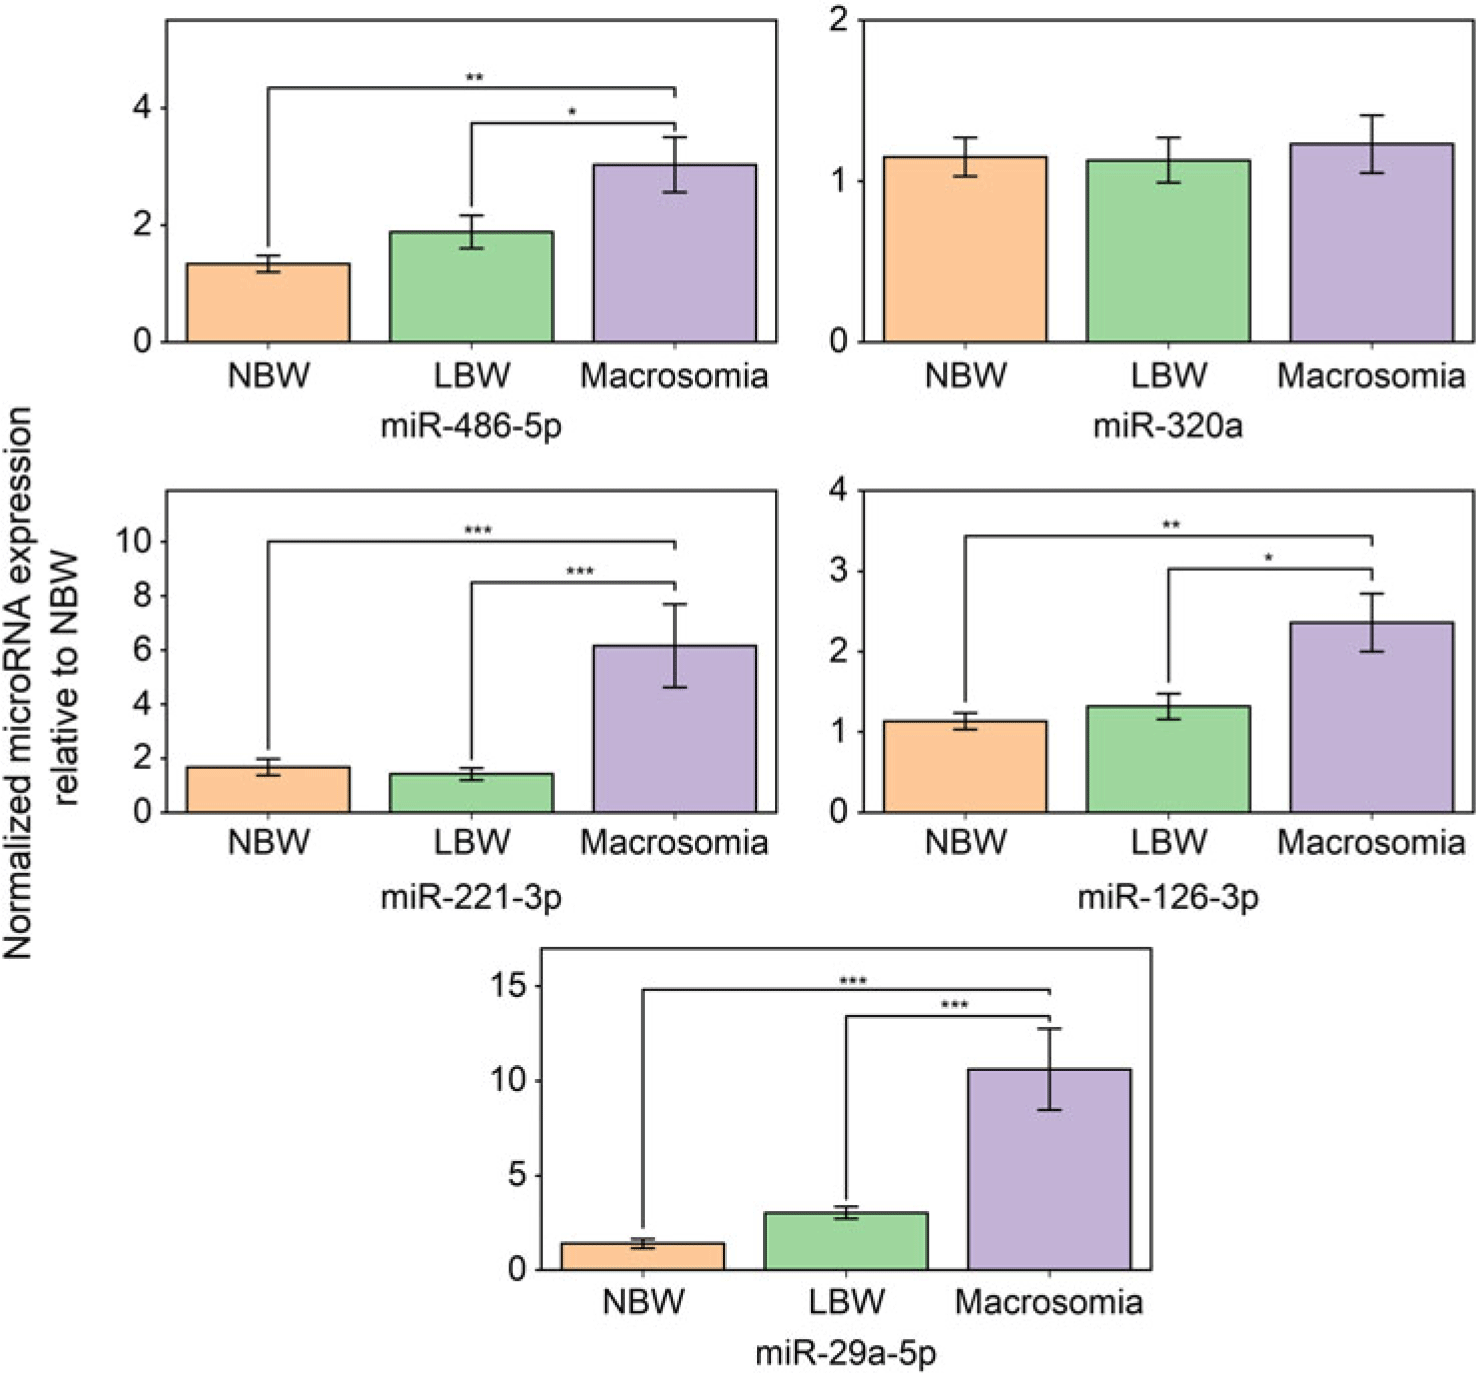
The expression of miR-29a-5p, miR-126-3p, miR-221-3p, miR-486-5p, and miR-320a was quantified from dried blood spots obtained from neonatal screening cards of Mexican newborns with NBW(n = 20), LBW(n = 20) and macrosomia (n = 20) using normalized relative quantification. Four miRNAs (miR-29a-5p, miR-126-3p, miR-221-3p, and miR-486-5p, with an expression fold change of 10.6, 2.4, 6.2, and 3.0; respectively) appear overexpressed in macrosomia versus normal weight (one-way ANOVA, followed by Tukey’s HSD post hoc test, confidence interval 95%). miR-320a show no differences among groups (Fig. 1). We have not found differences in c-miRNAs expression in LBW group. Raw data of the real-time polymerase chain reaction experiments are included in Supplemental material section.
Normalized miRNA expression relative to normal birth weight. Newborn expression of hsa-miR-486-5p, hsa-miR-320a, hsa-miR-221-3p, hsa-miR-126-3p, and hsa-miR-29a-5p from normal birth weight (NBW), low birth weight (LBW), and neonates with macrosomia. Bars represent the mean ± SEM. Statistically significant differences are shown as *p < 0.05, **p < 0.01, and ***p < 0.001 by one-way ANOVA with Tukey’s honest significant difference (HSD) post hoc test. n = 20.

Prediction of target genes and signaling pathways for miR-29a-5p, miR-126-3p, miR-221-3p, and miR-486-5p
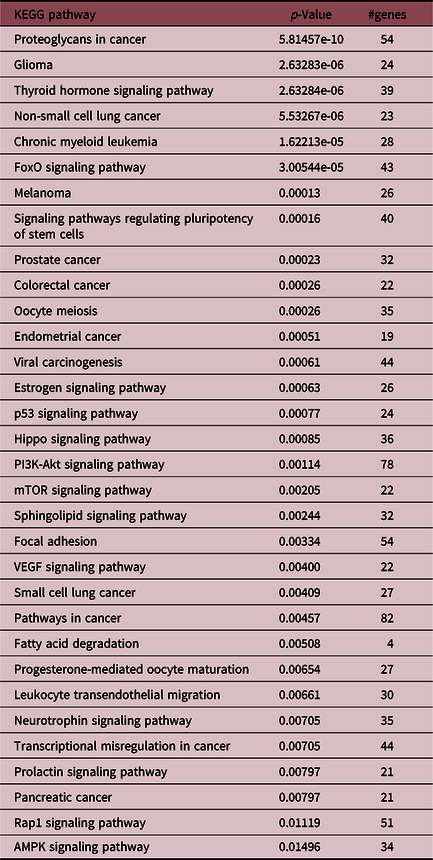
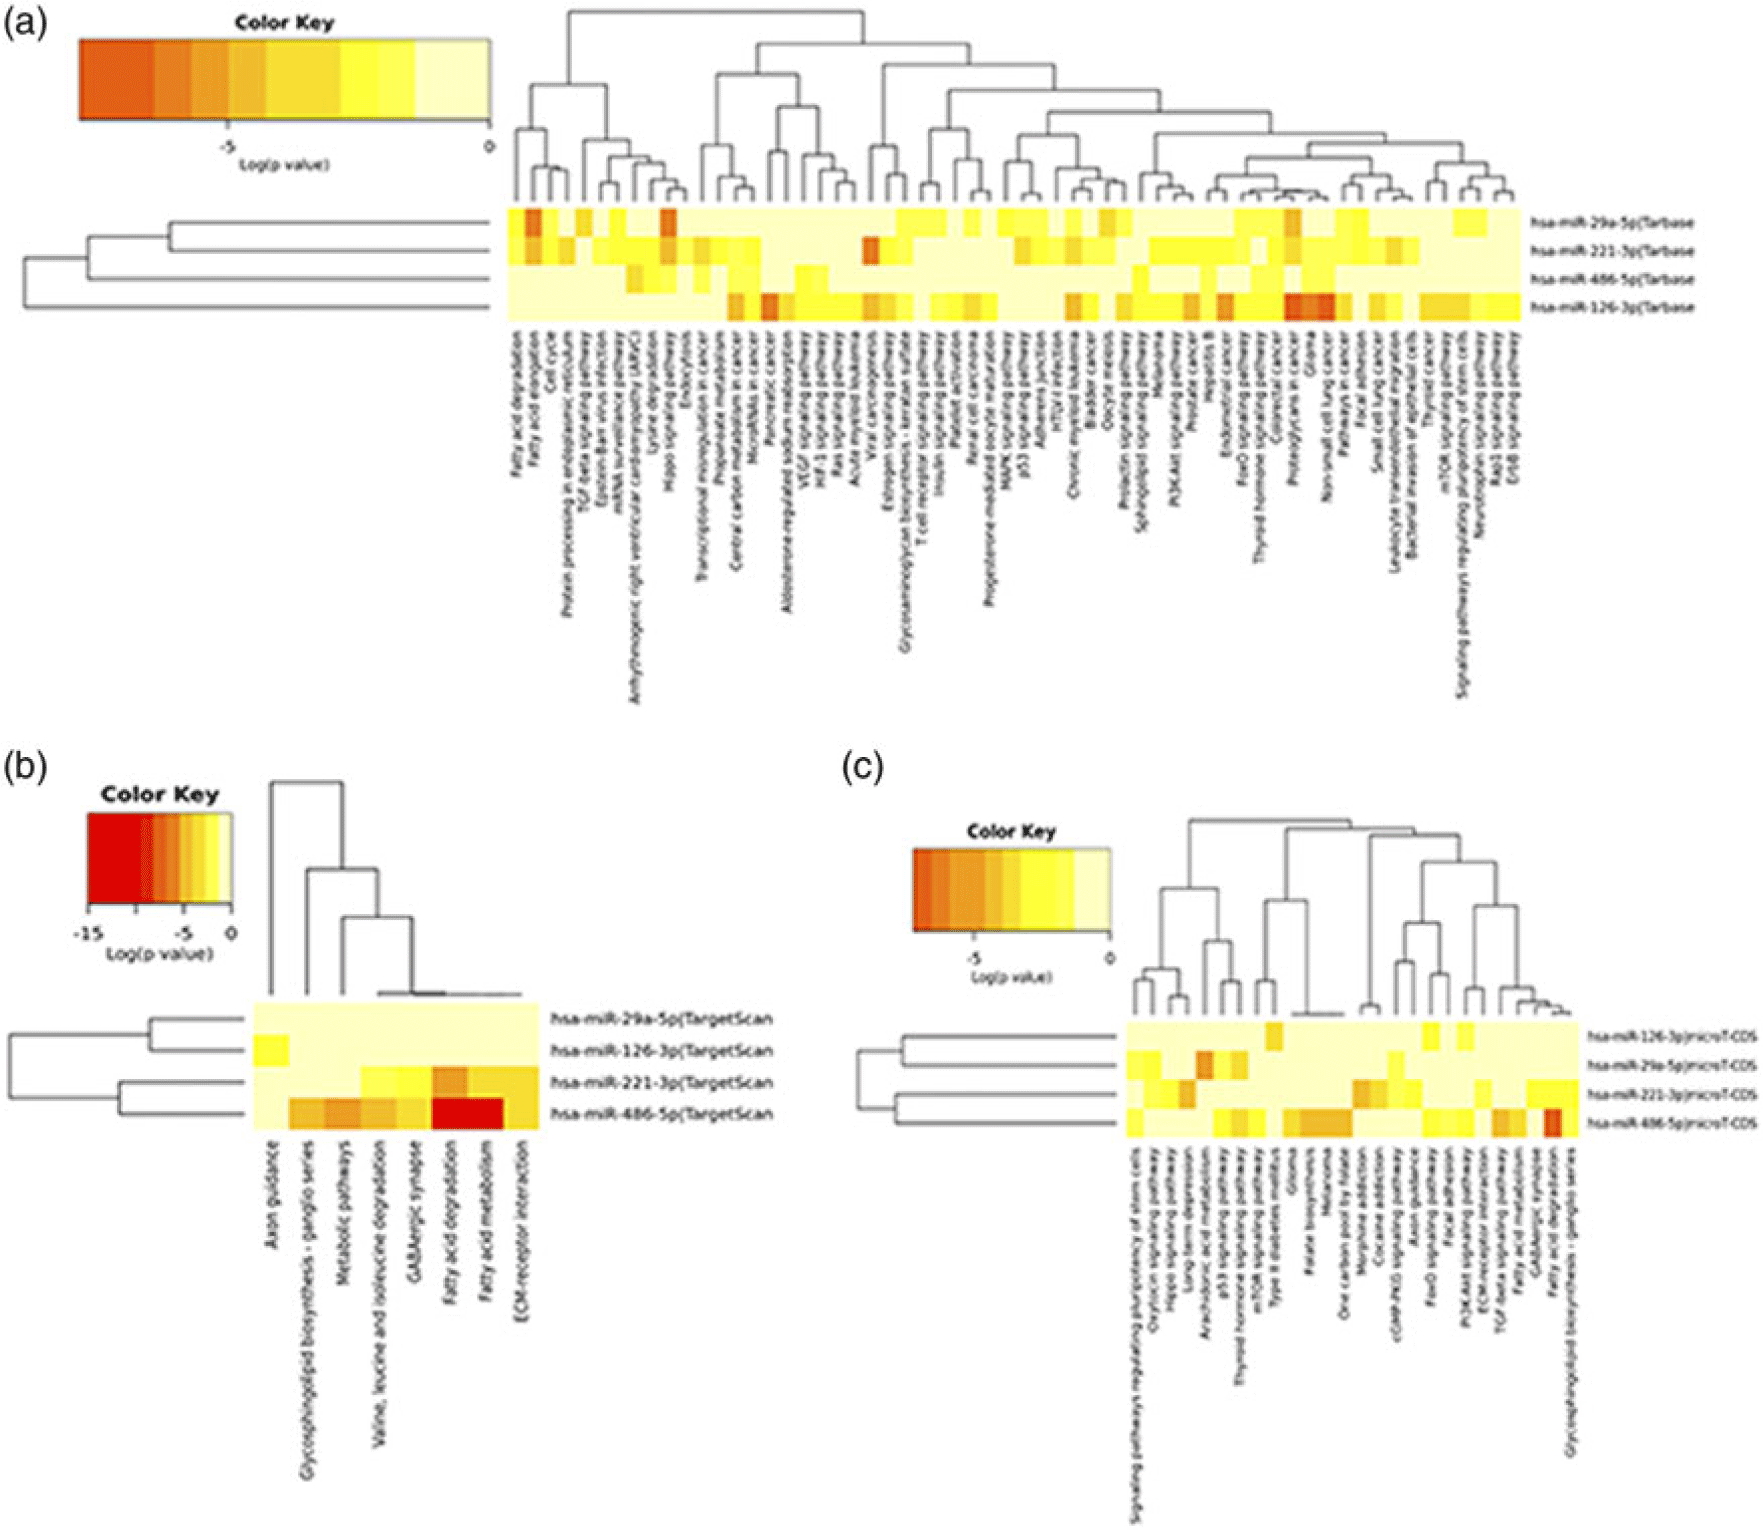
We analyzed the putative target genes and signaling pathways for mir-29a-5p, miR-126-3p, and miR-221-3p and miR-486-5p using DIANA-miRPath v.3.0 (22/02/2018). To increase the stringency of the analysis, we combined the four dysregulated miRNAs and included the target gene predictions from Tarbase v7.0, TargetScan y microT-CDS v5.0, enabling FDR correction at 0.05 (Benjamini–Hochberg) and conservative stats (modified Fisher’s exact test, pathways with very few targeted gene nodes are penalized). p-Value threshold 0.015, microT threshold 0.8; TargetScan score type: context+, TargetScan score context: −0.4. Enrichment analysis method: Fisher’s exact test. We found that predicted target genes for these dysregulated miRNAs are involved in pathways associated with different types of cancer, fatty acid metabolism, FoxO and PI3K/Akt signaling pathways (Table 3, Fig. 2).
Target pathways prediction with DIANA-miRPath analysisReference Vlachos, Zagganas and Paraskevopoulou47

miRNA versus GO Slim categories heatmaps created directly from the DIANA-miRPath v3.0 interface using 2a) TarBase, 2b) TargetScan, and 2c) microT-CDS from DIANA as prediction tools. Significance clusters/pathways union. Similar miRNAs are clustered together. The heatmaps depicts the level of enrichment in GO categories of microRNA found dysregulated in our study.Reference Vlachos, Zagganas and Paraskevopoulou47

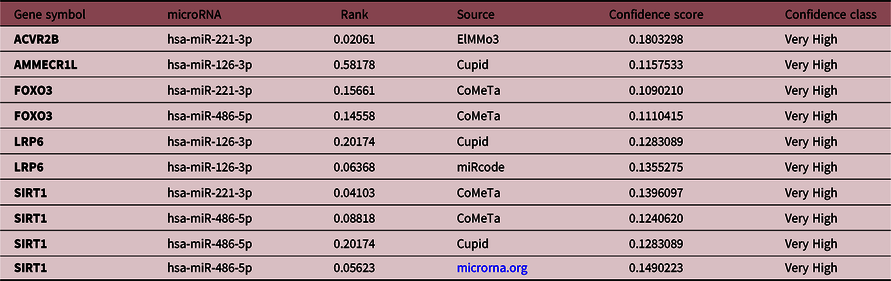
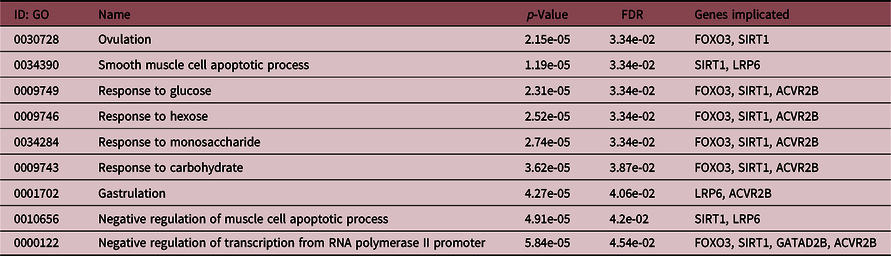
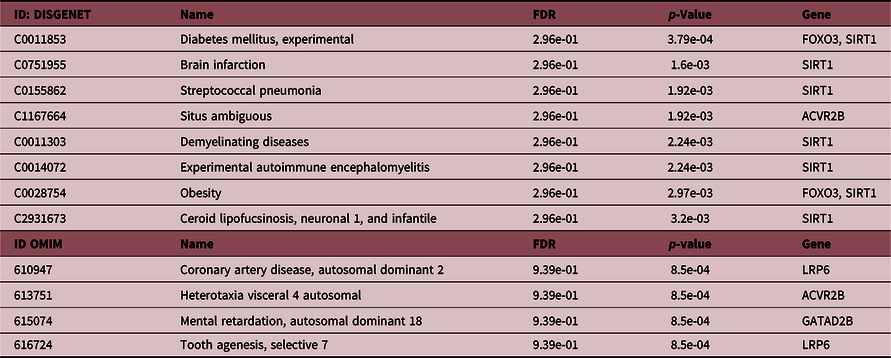
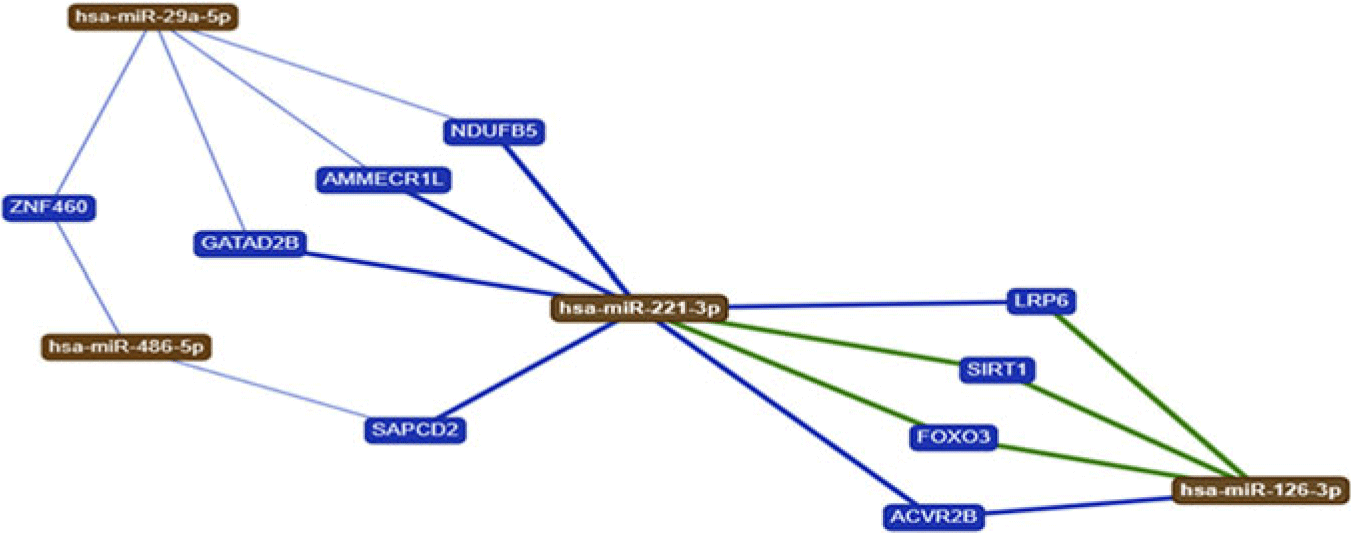
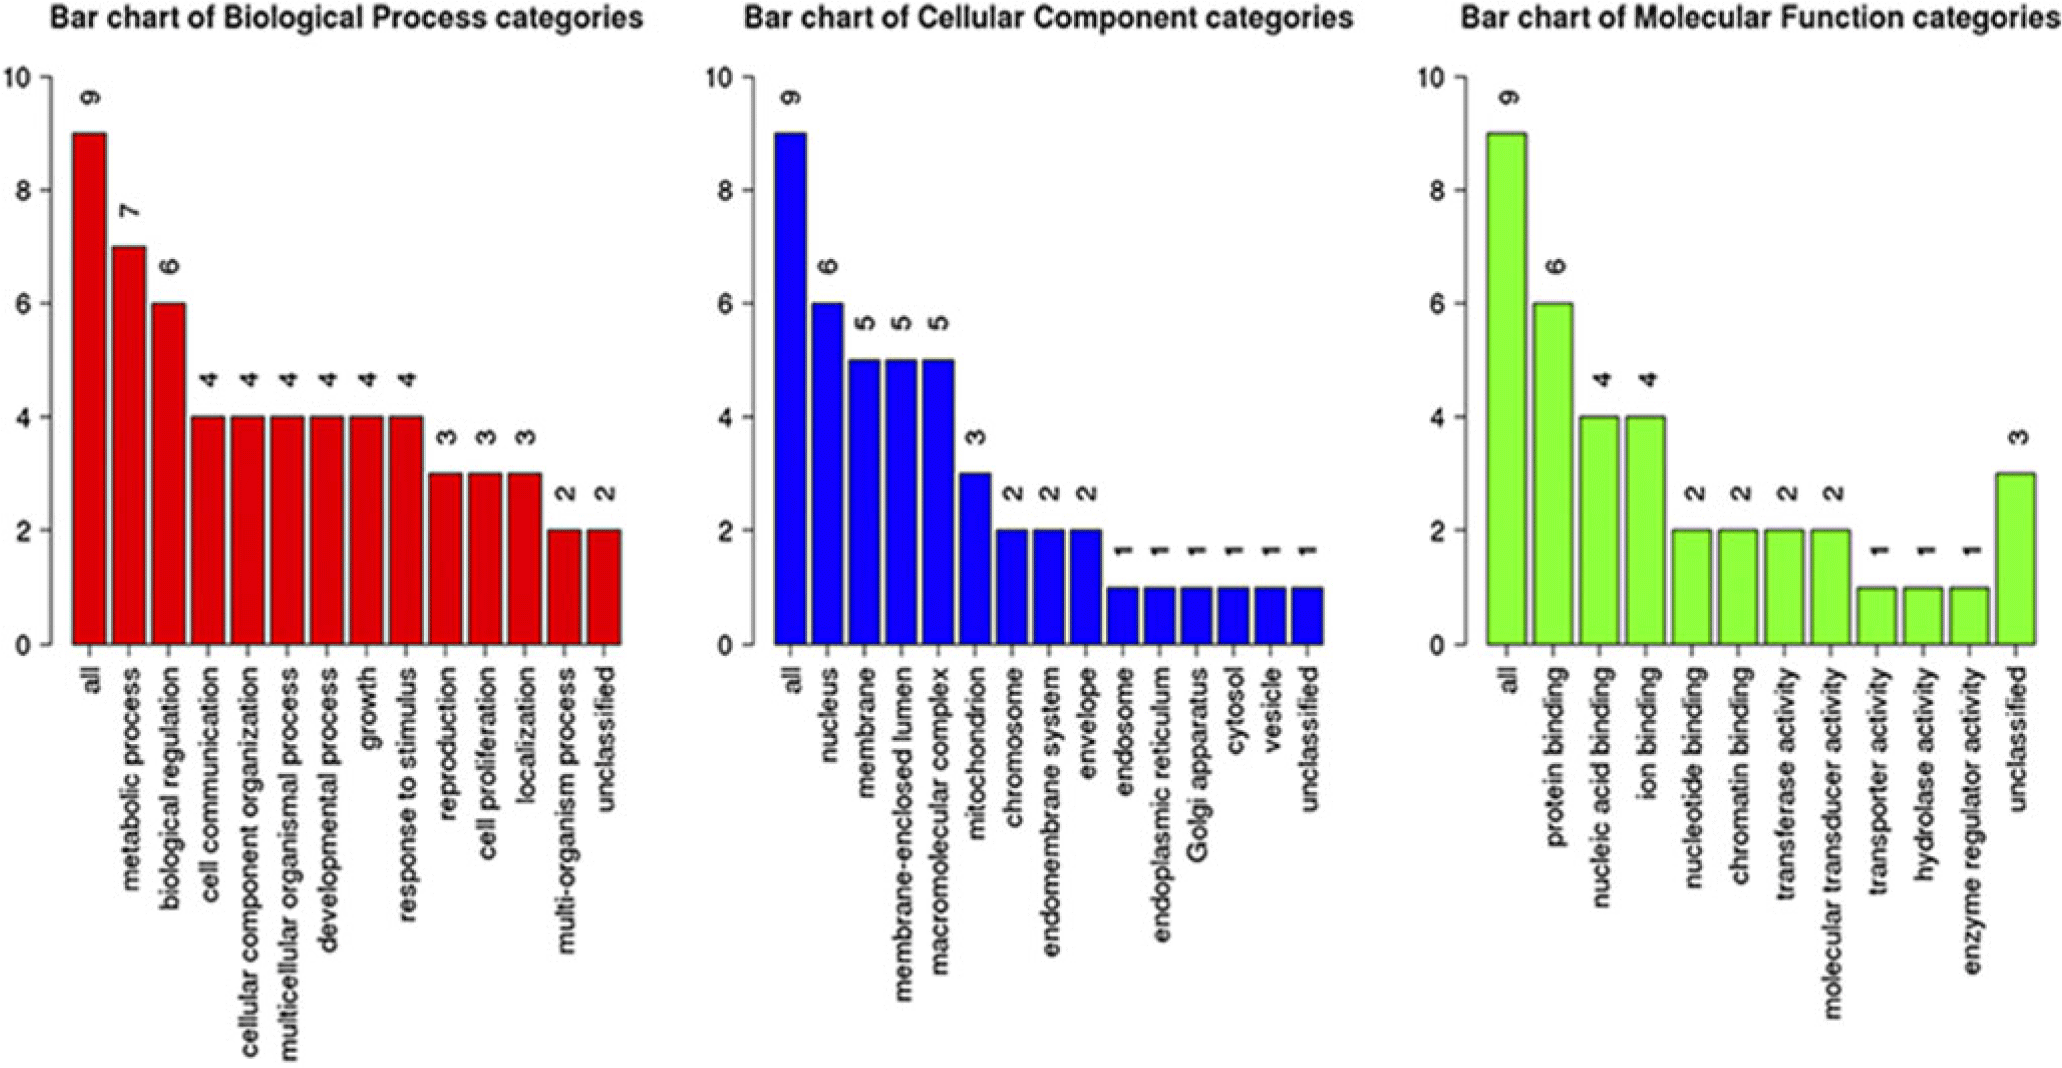
Next, we conducted a bidirectional analysis using miRDip 4.1Reference Tokar, Pastrello and Rossos42 to increase the specificity of the prediction. We performed it with the group of dysregulated miRNAs and the group of potentially target genes predicted by miRTarget Link and found that at least five of these genes were also predicted with this tool (Table 4, Fig. 3). Then, we performed an over-representation analysis using GeneTrail2 1.5 with a significance level of 0.05 and FDR adjustment and found that the genes predicted in miRTarget Link are involved in the FoxO family signaling, signaling events mediated by Histone deacetilase (HDAC) Class I and III, p73 transcription factor network and signaling by Nodal (Table 5). Considering the nine genes with shared interactions with the dysregulated miRNAs (predicted bymiRTarget Link Human30), we use Web Gestalt 2017 to extend the over-representation analysis of the putative target genes found. Summary of results are included in Tables 6, 7 and Figs. 3 and 4.
Bidirectional analysis. Created with miRDip 4.1 available at http://ophid.utoronto.ca/mirDIP/ Reference Tokar, Pastrello and Rossos42

Over-representation analysis of GeneTrail 1.5Reference Wang, Vasaikar and Shi50

Enrichment results – GO biological processReference Wang, Vasaikar and Shi50

Associated diseasesReference Wang, Vasaikar and Shi50

Shared interactions between the miRNA dysregulated. Green lines show strong interactions; blue lines indicate weak interactions. Created with miRTargetLink. Freely available at https://ccb-web.cs.uni-saarland.de/mirtargetlink.30

GO Slim summary.Reference Wang, Vasaikar and Shi50

Discussion
miRNAs dysregulated in the context of macrosomia
We found miR-29a-5p, miR-126-3p, miR-221-3p, and miR-486-5p overexpressed in NSC of Mexican newborns with macrosomia, a recognized risk factor for obesity later in life. Some of this c-miRNAs have been reported associated with obesity in children and adults by other research groups.
miR-126 was reported overexpressed in serum and plasma of adults with obesity and T2D.Reference Nuñez-Lopez, Garufi and Seyhan31,Reference Ortega, Mercader and Catalán32
miR-221-3p has been reported downregulated in children and adults with obesityReference Ortega, Mercader and Catalán32,Reference Prats-Puig, Ortega and Mercader34 and in plasma of pregnant woman with fetal macrosomia.Reference Ge, Zhu and Hailing16 In our study, we found it overexpressed. This probably because ethnic differences in the cohorts (the mentioned studies were conducted in Caucasian and Asian populations) or probably because it exhibits a shift during the progression of the disease.
miR-486-5p has been reported overexpressed in serum and plasma of children with obesity and in adults with obesity and T2D.Reference Cui, You and Zhu12,Reference Prats-Puig, Ortega and Mercader34,Reference Shah, Murthy and Pacold38
To our knowledge, circulating levels of miR-29a-5p has not been previously reported overexpressed in people with obesity or T2D. This miRNA has been reported overexpressed in subcutaneous adipose tissue from individuals with severe obesity, after a 15-week weight loss intervention.Reference Kristensen, Davidsen and Vigelsø25
Predicted target genes and pathways
Each miRNA could target hundreds of genes and metabolic pathways, so the reason for combining these four miRNAs was to find common target genes and thus continue with the pathways and diseases prediction analysis.
Pathways predicted in over-representation analyses are involved in inflammation, lipid and carbohydrate metabolism, vascular diseases, and carcinogenesis:
FoxO family signaling is a key player in an evolutionary conserved pathway downstream of insulin and insulin-like growth factors. It is involved in cell proliferation, apoptosis, reactive oxygen species response, longevity, cancer, regulation of cell cycle, and metabolism.Reference Tzivion, Dobson and Ramakrishnan44
Signaling by HDAC Class I is associated with apoptosis, proliferation of smooth muscle cells, and neointima proliferation in vascular damage. Dysregulation in this pathway has been implicated in proliferative vascular diseases, including atherosclerosis.Reference Findeisen, Gizard and Zhao14
Signaling by HDAC Class III contains the NAD-dependent sirtuin proteins SIRT1–SIRT7 and it is involved in regulation of gene transcription and chromosome stability. SIRT1 participates in gluconeogenesis, lipid accumulation, aging, development, inflammation and tumorigenesis, insulin sensitivity, and regulation of Akt activity.Reference Peng, Li and Li33
p73 transcription factor network: p73 is part of p53 family of proteins. It is implicated in cell cycle control, apoptosis, DNA repair, and differentiation of multi-ciliated epithelia. Dysregulation of p73 transcription factor network is associated with some types of cancer.Reference Marshall, Mays and Beeler28
Signaling by Nodal is associated with morphogenesis and development of mesodermal and endodermal tissues. Nodal expression is normally seen during embrionary life. A reactivation of Nodal signaling occurs in epithelial-derived malignancies and has a crucial role in carcinogenesis.Reference Kalyan, Carneiro and Chandra21
In summary, abnormal birth weight is a risk factor for suffering later-in-life NCD. Children born large for gestational age are at higher risk to develop obesity in adolescence than those born with NBW. During lifetime, adolescents with obesity are at higher risk of remaining obese as adults. Obesity is a global public health problem, and it is associated with the development of diabetes and cardiovascular diseases. Both children and adults with obesity have an altered c-miRNAs expression profile. We found in this study that some of these deregulated c-miRNAs in children and adults with obesity are altered in macrosomic newborns too. We conclude that these results could represent that perinatal alteration in gene expression is probably related to the increased risk of NCD in adulthood reported in the macrosomic newborns. In the bioinformatic analysis, we observed that these dysregulated c-miRNAs interact with metabolic pathways and genes that are involved in the pathobiology of NCD. Our study has certain limitations such as the small size of the cohort (that was adjusted to observe differences of at least twofold miRNA expression levels) and the lack of epidemiological or clinical data on it (newborn’s gender, type of delivery, pregnancy complications, maternal diseases, etc.) that could be useful to measure. We preselected some c-miRNAs previously reported as dysregulated in the context of NCD, which generates a selection bias. The cross-sectional measurement of these c-miRNAs makes it impossible to determine whether this altered expression is maintained over time, and whether it is a causal factor in the development of NCD. The question if a permanent dysregulation in these silencing molecules and their target genes is participating in the later-in-life development of NCD will require longitudinal clinical studies that allow to confirm this hypothesis. Another problem is the impossibility of determining the cellular origin of these miRNAs found in circulation, as well as whether they have any biological effect in a particular tissue or if they are only present in blood as a marker of metabolic alterations but without functional implication. We did not measure the c-miRNAs in maternal blood. Previous studies have not found correlation between circulating levels of miRNAs in maternal blood and those founded in placenta, in pregnant women with obesity.Reference Carreras-Badosa, Bonmatí and Ortega6,Reference Carreras-Badosa, Bonmatí and Ortega7 To our knowledge, it has not been shown that the presence of c-miRNAs in fetus and newborns corresponds to the circulating expression in the mother, nor the expression in placenta. It will be interesting in future trials to determine the origin of these miRNAs. In Mexico, the neonatal screen is performed between the third and sixth days of life, so we consider that c-miRNA expression that we found corresponds to a response of the fetus in the third trimester of pregnancy (or the newborn) to the perinatal environment, more than passively maternal or placental transmission. To support this explanation, we considered half-lives of guide strand miRNAs. Half-lives vary between miRNAs and between cell lines, but in a recent report of miRNAs dynamics in mammalian cells (mouse), Kingston and BartelReference Kingston and Bartel24 found median values ranging from 11 to 34 h, and almost all of the miRNAs evaluated in that study had half-lives less than 100 h. For this reason, we believe that the miRNAs we measured reflect a newborn response to the perinatal environment and not a maternal origin. Another limitation of our work is that the analysis of target genes and pathways was performed in silico. It is necessary to extend the research to experimental models to quantify levels of putative target mRNAs and proteins to know if these effects are maintained in vivo, and if they have clinical significance or potential use as treatment targets.
Conclusions
c-miRNAs dysregulated in neonates with macrosomia have been associated with obesity, diabetes, cancer, and cardiovascular diseases in adulthood. Altered levels of c-miRNAs in newborn dried blood spots could be noninvasive biomarkers of early metabolic alterations. Further research is needed to determine if miRNAs are involved in the development of obesity and its comorbidities later in life or if they are only early biomarkers of adverse metabolic trajectory.
Acknowledgments
ECAL and PRG thank to Dr. Angélica Montoya-Contreras for technical assistance in conducting the experiments. AOD thank to Professor Daniel Vázquez-Pardo for assistance in improving the quality of figures. The authors are entirely responsible for the scientific content of the paper.
Funding
This work was supported by FOMIX-SLP-195024/30.
AOD received a graduate fellowship from CONACYT, México (608673) and a special support from IPICYT.
Conflicts of interest
None.
Ethical standards
The authors assert that all procedures contributing to this work comply with the ethical standards of the relevant national guidelines on human experimentation (Reglamento de la Ley General de Salud en Materia de Investigación para la Salud, Artículo 50, Capítulo IV) and with the Helsinki Declaration of 1975, as revised in 2008, and have been approved by the Institutional Ethical Committee of the Instituto Potosino de Investigación Científica y Tecnológica.
Part of this work was presented in the 6th International Symposium on Metabolic Programming and Microbiome 3rd Meeting of Ibero-American DOHaD chapter”, Cancún, México, November 9, 2018.
Author contribution
LASO and ECAL conceived the idea and the design of the experiments. ECAL and SPRG conducted the experiments. AOD conducted bioinformatic analysis and wrote the first draft of the manuscript. All authors were involved in the edition of the manuscript, revised it critically, and approved the final version.
Supplementary material
To view supplementary material for this article, please visit https://doi.org/10.1017/S2040174420000422