





Introduction
Johnsongrass [Sorghum halepense (L.) Pers.] is one of the world’s worst agricultural weeds, causing significant economic damage (Klein and Smith Reference Klein and Smith2021; Paterson et al. Reference Paterson, Kong, Johnston, Nabukalu, Wu, Poehlman, Goff, Isaacs, Lee and Guo2020). Sorghum halepense is a C4 perennial polyploid grass that spreads via seeds and rhizomes; a single plant can produce more than 10,000 seeds, and rhizome biomass can account for up to 70% of the entire plant dry weight (Johnson and Norsworthy Reference Johnson and Norsworthy2014; Paterson et al. Reference Paterson, Kong, Johnston, Nabukalu, Wu, Poehlman, Goff, Isaacs, Lee and Guo2020). Historically, S. halepense has been problematic in the southern United States, as rhizomes are able to survive the mild winters. These rhizomes become increasingly problematic to control, as they require lower temperatures to initiate sprouting compared with seeds (Horowitz Reference Horowitz1972), and herbicide efficacy on rhizome-derived plants is reduced compared with seedlings (Chadha et al. Reference Chadha, Florentine, Dhileepan, Turville and Dowling2022; Horowitz Reference Horowitz1972). The agricultural impact of S. halepense is both density and cropping system dependent, with yield loss ranging from 79% and 86% in corn (Zea mays L.) and 65% in cotton (Gossypium hirsutum L.) (Dogan and Boz Reference Dogan and Boz2005; Karkanis et al. Reference Karkanis, Athanasiadou, Giannoulis, Karanasou, Zografos, Souipas, Bartzialis and Danalatos2020).
The adoption of glyphosate-resistant (GR) crops has been a critical technology for managing S. halepense. First introduced in the late 1990s, these systems were rapidly adopted, with more than 90% of corn, cotton, soybean [Glycine max (L.) Merr.], and sugar beet (Beta vulgaris L.) hectares in the United States planted with GR traits by 2014 (Desai et al. Reference Desai, Menalled, Gaines and Shergill2025; Duke Reference Duke2018). However, this rapid adoption led to overreliance on glyphosate which imposed intense and repeated selection pressure, driving the evolution of GR weed populations. In total, 62 weed species have evolved resistance to glyphosate, leading to GR weeds becoming dominant both in terms of acreage and their economic impact (Heap Reference Heap2026). The first case of GR S. halepense was reported in 2005 from an Argentinean soybean field with resistance levels 3.5- to 10.5-fold (Vila-Aiub et al. Reference Vila-Aiub, Balbi, Gundel, Ghersa and Powles2007). Two years after, an S. halepense GR population was documented in Arkansas, the first case reported in the United States (Riar et al. Reference Riar, Norsworthy, Johnson, Scott and Bagavathiannan2011). GR S. halepense populations have been steadily increasing with reports now from Mississippi, Louisiana, and Missouri, as well as other countries globally (Heap Reference Heap2026).
Glyphosate resistance encompasses more known mechanisms than for any other herbicide: target-site mutations, target-site gene duplication, vacuole sequestration, limited cellular uptake, metabolism, and rapid necrosis have all been demonstrated (Sammons and Gaines Reference Sammons and Gaines2014). Several grass species (e.g., goosegrass [Eleusine indica (L.) Gaertn.], rigid ryegrass [Lolium rigidum Gaudin], and junglerice [Echinochloa colona (L.) Link]) have evolved glyphosate resistance via target-site mutations or target-site gene duplication; however, to date, no target-site resistance mechanisms have been reported in S. halepense. A notable gap in the literature is the absence of species-specific primers for reliably amplifying the EPSPS gene in S. halepense to screen for known glyphosate resistance–conferring mutations such as the TIPS and TIAVPS amino acid substitutions (Gaines et al. Reference Gaines, Patterson and Neve2019). Because S. halepense is a tetraploid species, it is imperative that primers for molecular markers amplify both subgenomes and that any sequencing is properly interpreted through this lens (e.g., mutations may appear in only a quarter of the sequence, as they may be heterozygous on only one of the two EPSPS copies). Furthermore, copy number variation (CNV) analysis is also difficult, as the wild-type (glyphosate-susceptible) plants will have a minimum of two copies (one for each subgenome) as will most housekeeping genes. To date, no studies have confirmed EPSPS CNV in S. halepense.
Current evidence suggests glyphosate resistance in S. halepense is primarily due to reduced translocation to the meristematic tissue and increased retention in treated leaves (Riar et al. Reference Riar, Norsworthy, Johnson, Scott and Bagavathiannan2011). Complementary 31P nuclear magnetic resonance analyses showed that resistant S. halepense biotypes accumulated more glyphosate in the apoplast than susceptible biotypes, suggesting that resistance is due to reduced cellular uptake of glyphosate (Ge et al. Reference Ge, d’Avignon, Ackerman, Ostrander, Sammons, Kobayashi and Watanabe2014). Although the molecular and genetic basis for reduced cellular uptake and translocation is currently unknown, reduced foliar absorption has been documented as a secondary mechanism acting alongside reduced translocation (Vila-Aiub et al. Reference Vila-Aiub, Balbi, Gundel, Ghersa and Powles2007). Glyphosate is a highly charged molecule, even in highly acidic solutions, and therefore requires protein transporters for cellular absorption (Takano et al. Reference Takano, Patterson, Nissen, Dayan and Gaines2019); ATP-binding cassette transporters are the most likely candidates, as changes in their expression have been shown to cause resistance in E. colona (Amrhein and Martinoia Reference Amrhein and Martinoia2021; Pan et al. Reference Pan, Yu, Wang, Han, Mao, Nyporko, Maguza, Fan, Bai and Powles2021).
Despite nearly two decades of global reports of GR S. halepense, the underlying mechanism(s) in this species remain only partially characterized due to (1) the lack of species-specific molecular tools, (2) the complexity of working in an only recently sequenced polyploid weed genome, and (3) limited and somewhat conflicting evidence of reduced absorption and translocation. Addressing these gaps is essential for improving diagnostic tools, informing resistance management strategies, and preventing spread of GR S. halepense. Therefore, the goals of this study were to determine the resistance level of a suspected GR biotype of S. halepense from Texas and characterize potential resistance mechanisms. To accomplish these goals, we had three objectives: (1) perform dose–response assays to quantify the level of resistance, (2) design species-specific primers for target-site mechanisms (EPSPS mutations and copy number), and (3) quantify glyphosate absorption and translocation via liquid chromatography–mass spectrometry (LC-MS).
Materials and Methods
Plant Material and Dose–Response Assay
In 2023, a GR biotype of S. halepense was discovered in a cotton field in Anson, TX (32.8047°N, 99.9469°W), hereafter referred to as Texas-R (Matschek Reference Matschek2024). A known glyphosate-susceptible biotype utilized in this study was collected in Temple, TX (36.0602°N, 97.3426°W), hereafter referred to as Texas-S. These biotypes were selfed in the greenhouse, and their progeny were used for all experiments. Seeds of each biotype were scarified by acid treatment to break dormancy. A modified acid scarification treatment consisted of an initial soaking for 15 min in concentrated sulfuric acid, followed by a triple rinse with deionized water and overnight drying (Tao Reference Tao1982). Seeds were then imbibed in gibberellic acid at a concentration of 0.15 g L−1 for 6 h and sowed in a 25.5 by 25.5 cm tray until germination. Flats were placed in a greenhouse with a day temperature of 26 C for a 16-h light period and night temperature of 18 C with an 8-h dark period. Seedlings were then transplanted at the 1- to 2-leaf stage into 10.5 by 10.5 cm pots containing Suremix potting media (Suremix, Michigan Grower Products, Galesburg, MI, USA; 86% peat and 14% perlite) and watered daily with a siphon fertilizer (Peters, ICL Specialty Fertilizer, Dublin, OH, USA; Excel pH Low [15-7-25] High-Mag/High) at 200 ppm, fertilization ceased after herbicide application. Dose–response assays consisted of seven rates of glyphosate (Roundup PowerMAX, 660 g L−1, Bayer, CropScience, St. Louis, MO, USA) at 0.125, 0.25 0.5, 1, 2, 4, and 8 times the cotton labeled field use rate of 867 g ae ha−1 applied to 3- to 4-leaf stage S. halepense. All treatments included 2% (v/v) dry ammonium sulfate. Herbicide applications were made using a single-track sprayer (Generation 4, DeVries Manufacturing, Hollandale, MN, USA) equipped with an 8001E TeeJet® flat-fan nozzle (TeeJet® Technologies, Wheaton, IL, USA) calibrated at 187 L ha−1 at 193 kPa of pressure. At 21 d after application (DAA), aboveground biomass was collected and then dried at 66 C for 5 d. Dried aboveground biomass was used to obtain the effective dose that caused 50% biomass reduction (ED50). Dose–response treatments consisted of four replications and were repeated twice.
DNA Extraction
Five plants of each biotype were grown under the same greenhouse conditions outlined earlier. At the 3- to 4-leaf stage aboveground tissue was harvested, flash frozen in liquid nitrogen, and stored at -80 C until use. DNA was extracted from 80 mg S. halepense tissue using a modified previously described CTAB (cetyltrimethylammonium bromide) protocol (Purvis et al. Reference Purvis, Patterson and Burns2026). DNA was diluted to 20 and 10 ng µl−1 for PCR and CNV assays, respectively.
Primer Design for Target-Site Mutations and Abundance
A 1,200-bp EPSPS sequence from sorghum [Sorghum bicolor (L.) Moench] (Li et al. Reference Li, Chen, Wang, Qin, Hou, Yang, Jian, Gao, Liu and Mu2024) was analyzed for sequence homology against the S. halepense genome (Project ID no. 1335880) using BLASTN (v. 2.14.1). Coordinates corresponding to the top BLAST hit were extracted using Samtools v. 1.19.1 (Danecek et al. Reference Danecek, Bonfield, Liddle, Marshall, Ohan, Pollard, Whitwham, Keane, McCarthy and Davies2021), resulting in a 4,223-bp fragment. This sequence was used to design the primer pair EPSPS_JGF (5′-GGTGCAATAAACTAGCCCTGAAGG-3′) and EPSPS_JGR (5′-GTTTAGTAGCCAGTGCTCCCTG-3′) that simultaneously amplified a 620-bp fragment in both subgenomic regions that included the TIPS and TIAVPS known mutations (Gaines et al. Reference Gaines, Patterson and Neve2019).
Texas-R and Texas-S biotypes were amplified using 20-µl reactions consisting of 16 µl of 2X GoTaq G2 Green Master Mix (Promega, Madison, WI, USA), 1 µl of each forward and reverse EPSPS primer, and 2 µl of template DNA at 20 ng µl−1. Cycling consisted of an initial denaturation step of 95 C for 5 min, followed by 36 cycles of 95 C for 30 s, 60 C for 30 s, and 72 C for 1.5 min, with a final extension of 72 C for 8 min in a Bio-Rad T100 thermal cycler (Bio-Rad Laboratories, Hercules, CA, USA). Amplicons were purified using the Thermo Scientific GeneJET PCR purification kit (Thermo Fisher Scientific, Waltham, MA, USA). Products were diluted to at least 20 ng µl−1 and sent for nanopore sequencing (Oxford Nanopore Technologies, Oxford, UK). Each amplicon was sequenced >500 times, and the sequences were aligned and returned as a table for analysis where the first column was the predicted wild-type sequence, and the subsequent four columns were the number of reads with A, T, G, or C sequence. If a single-nucleotide polymorphism (SNP) frequency reached >25% of the nanopore reads, it was considered significantly above background error rate (∼1%) and potentially a true SNP. We especially focused on looking at previously identified codons that confer resistance (Tyr-102, Pro-106, etc.)
CNV Assay
Utilizing the same EPSPS fragment described earlier, qPCR primers were designed to amplify an 89-bp fragment: JG_EPSPSF (5′-GTAGGAAGTCCATGGGTATGTG-3′) and JG_EPSPSR (5′-CCCTCATTCTTGGTACTCCATC’3′). We utilized ALS, which is commonly utilized in CNV assays, as our housekeeping gene (Sulzback et al. Reference Sulzback, Borgato, Cutti, Hill, Burns and Patterson2024). A 1,949-bp fragment was used to design primers for a 131-bp fragment: JG_ALSF: (5′-AGCAACAGATCCGCCTTATC-3′) and JG_ALSR: (5′-GGAATCCCAGTCACAACTACTC-3′).
Reactions were assembled in 96-well plates, with each reaction consisting of 10 µl of SYBR Green qPCR master mix (Thermo Fisher Scientific), 1.8 µl of each forward and reverse primer, 5.4 µl of nuclease-free water, and 1 µl of template DNA in a total volume of 20 µl. Cycling consisted of the following conditions: 95 C for 3 min, 39 cycles of 95 C for 30 s, and 62 C for 30 s. A melt curve was performed starting at 65 C to 95 C, increasing 0.5 C every 5 s to ensure only one PCR product was formed. Reactions were performed in Bio-Rad CFX96 Real-Time System (Bio-Rad Laboratories). Fluorescence data on each EPSPS and ALS for each sample were chosen at the cycle where it crossed the critical threshold (Ct). For each resistant and susceptible biotype, five biological replicates and three technical replicates were utilized to determine the relative EPSPS copy number (Gaines et al. Reference Gaines, Barker, Patterson, Westra, Westra, Wilson, Jha, Kumar and Kniss2016). Primer efficiencies were calculated as 99% to 100% for both ALS and EPSPS (Supplementary Figure S1).
Glyphosate Quantification
Glyphosate was separated from S. halepense tissue collected from shoot or roots to understand differences in partitioning between tissue types. To quantify glyphosate in each biotype, plants were grown under the same greenhouse conditions described earlier. Once plants reached the 3- to 4-leaf stage, glyphosate (Roundup PowerMAX, 660 g L−1, Bayer) plus 2% (v/v) dry ammonium sulfate was applied at 0.25 times the field use rate of 867 g ha−1. Herbicide applications were made using a single-track sprayer (Generation 4) equipped with an 8001E TeeJet® flat-fan nozzle (TeeJet® Technologies) calibrated at 187 L ha−1 at 193 kPa of pressure. This rate was chosen to adequately detect glyphosate but not cause death of the susceptible biotype at 10 DAA. Plants were harvested at 3, 4, 7, and 10 DAA. Above- and belowground tissue was harvested separately, rinsed with water to remove any unabsorbed glyphosate, flash frozen in liquid nitrogen, and stored at −80 C until use. At each time point, five plants were ground and pooled together; this was repeated three times. In total, 0.5 g of ground tissue was used in glyphosate quantification.
Glyphosate was quantified using derivatization with fluorenylmethoxycarbonyl (FMOC) chloride as described in Barker and Dayan (Reference Barker and Dayan2019). First, 1 ml of aqueous S. halepense sample was spiked with [1,2-13C2 15N]glyphosate to a final concentration of 0.2 μg ml−1 in a 2-ml tube. Second, 400 μl of 5% sodium borate solution was added, and the mixture was vortexed at 3,200 rpm. Finally, 400 μl of FMOC-Cl in acetonitrile was added, and the solution was vortexed at 3,200 again. Each sample was then incubated at room temperature for 12 to 16 h. A glyphosate standard curve was made at concentrations of 0.05, 0.1, 0.5, 1, 2.5, and 5 μg ml−1 with [13C2 15N]glyphosate spiked in at a concentration of 0.2 μg ml−1 and derivatized. The samples were centrifuged at 15,000 × g for 10 min before analysis. Glyphosate concentrations were analyzed using a Waters Acquity I-Class UPLC system connected to a Waters Xevo TQ-XS tandem quadrupole mass spectrometer (Waters, Milford, MA, USA). The chromatographic separation was carried out with an Acquity UPLC BEH C18 column (100 mm by 2.1 mm, 1.7 μm; Waters, Dublin, Ireland). Solvent A consisted of water with 0.01 M ammonium formate, and solvent B was acetonitrile. The gradient started at 2% B for 1 min and increased to 45% B until 2 min, then increased to 52% B until 5 min, after which it was increased linearly to 98% B at 7 min and remained at 98% B until 8 min; finally, at 8.01 min, it was decreased to 2% B until the end of the 10-min run. The flow rate was set at 0.3 ml min−1, and column temperature was kept constant at 40 C. Mass spectra were acquired by electrospray ionization in negative mode with an multiple reaction monitoring of 390.09 > 168 and set for a cone voltage of 20 V, a collision energy of 10.0 V, and a dwell of 0.063 s.
Data Analysis
Texas-R and Texas-S dry biomass was utilized to generate dose–response curves using the drc package in R (Ritz et al. Reference Ritz, Baty, Streibig and Gerhard2015). Dry biomass was normalized as a percentage of the nontreated control within each treatment. ANOVA confirmed no significant differences between experimental runs; therefore, data were pooled across runs. Three- and four-parameter log-logistic models were fit to determine the trend of biomass reduction between biotypes (Equations 1 and 2).
Model fit was evaluated using the drc modelFit function in R, which is a lack-of-fit test; only models with P-values > 0.05 were chosen for analysis (Knezevic and Datta Reference Knezevic and Datta2015).
 $y = {d \over {1 + \;{\rm{exp}}\left[ {b\left( {{\rm{log}}\left( x \right) - {\rm{log}}\left( e \right)} \right)} \right]}}$
 $y = {{d - c} \over {1 + {\rm{exp}}\left[ {b\left( {{\rm{log}}\left( x \right) - {\rm log}\left( e \right)} \right)} \right]}}$
For both equations, y is the dry biomass, x is the herbicide dose, d is the maximum response, c represents the minimum response (Equation 2), b is the relative slope around e, and e is the inflection point (Equation 1). For Equation 2, e represents the point at which the response is halfway between c and d.
The cycle in which each biotype crossed a threshold (Ct) indicating exponential increase was recorded, and relative EPSPS copy number was quantified using the comparative Ct method (Schmittgen and Livak Reference Schmittgen and Livak2008) with ALS as the reference gene. For each sample, means and standard errors were calculated across technical replicates. Biological replicate means were then averaged within each biotype to determine the relative EPSPS copy number to ALS.
 $\rm \Delta {C_t}\; = \;{C_t}^{ALS} - {C_t}^{EPSPS}$
Glyphosate concentration data were analyzed using linear models in R (R Foundation for Statistical Computing, Vienna, Austria). Analyses were conducted separately for each tissue type (shoot or root). Glyphosate concentration was modeled as a function of biotype (Texas-R vs. Texas-S), days after application (DAA), and their interaction. DAA was treated as a categorical factor to enable direct biotype comparisons at each discrete sampling time. Estimated marginal means for each biotype at each DAA time point were computed using the emmeans package, and biotype differences (Texas-R vs. Texas-S) were evaluated using pairwise contrasts at individual DAA levels (Lenth et al. Reference Lenth, Singmann, Love, Buerkner and Herve2019). Model assumptions were evaluated using residual diagnostics. Statistical significance was assessed at α = 0.05. For this paper, we defined glyphosate translocation as the concentration of glyphosate to belowground tissue (Namiki et al. Reference Namiki, Otani, Motoki, Seike and Iwafune2018). This analytical approach was selected to provide biologically interpretable, time‑specific comparisons between biotypes within defined tissue contexts.
Results and Discussion
Differences in Glyphosate Sensitivity
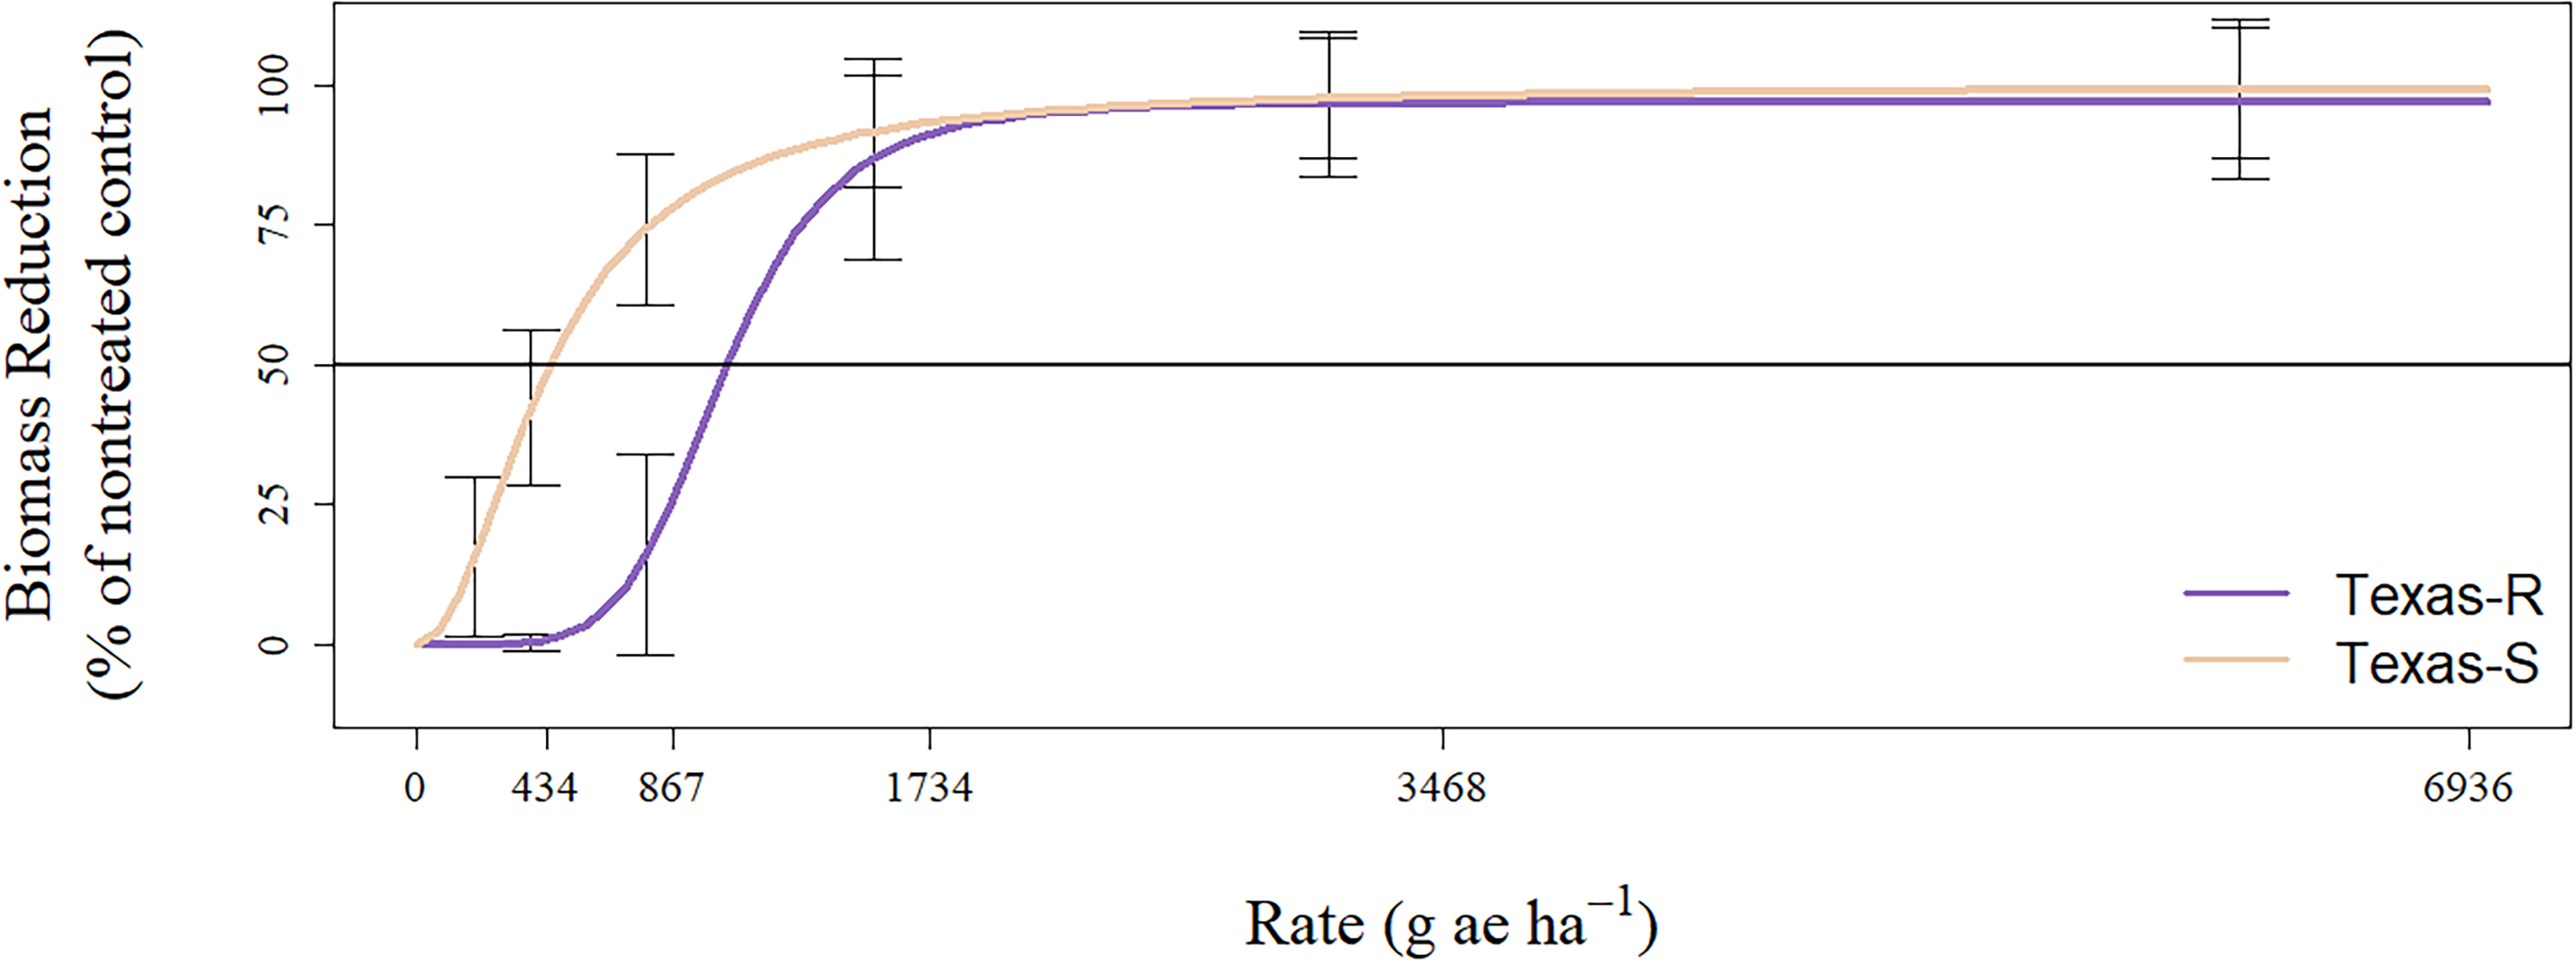
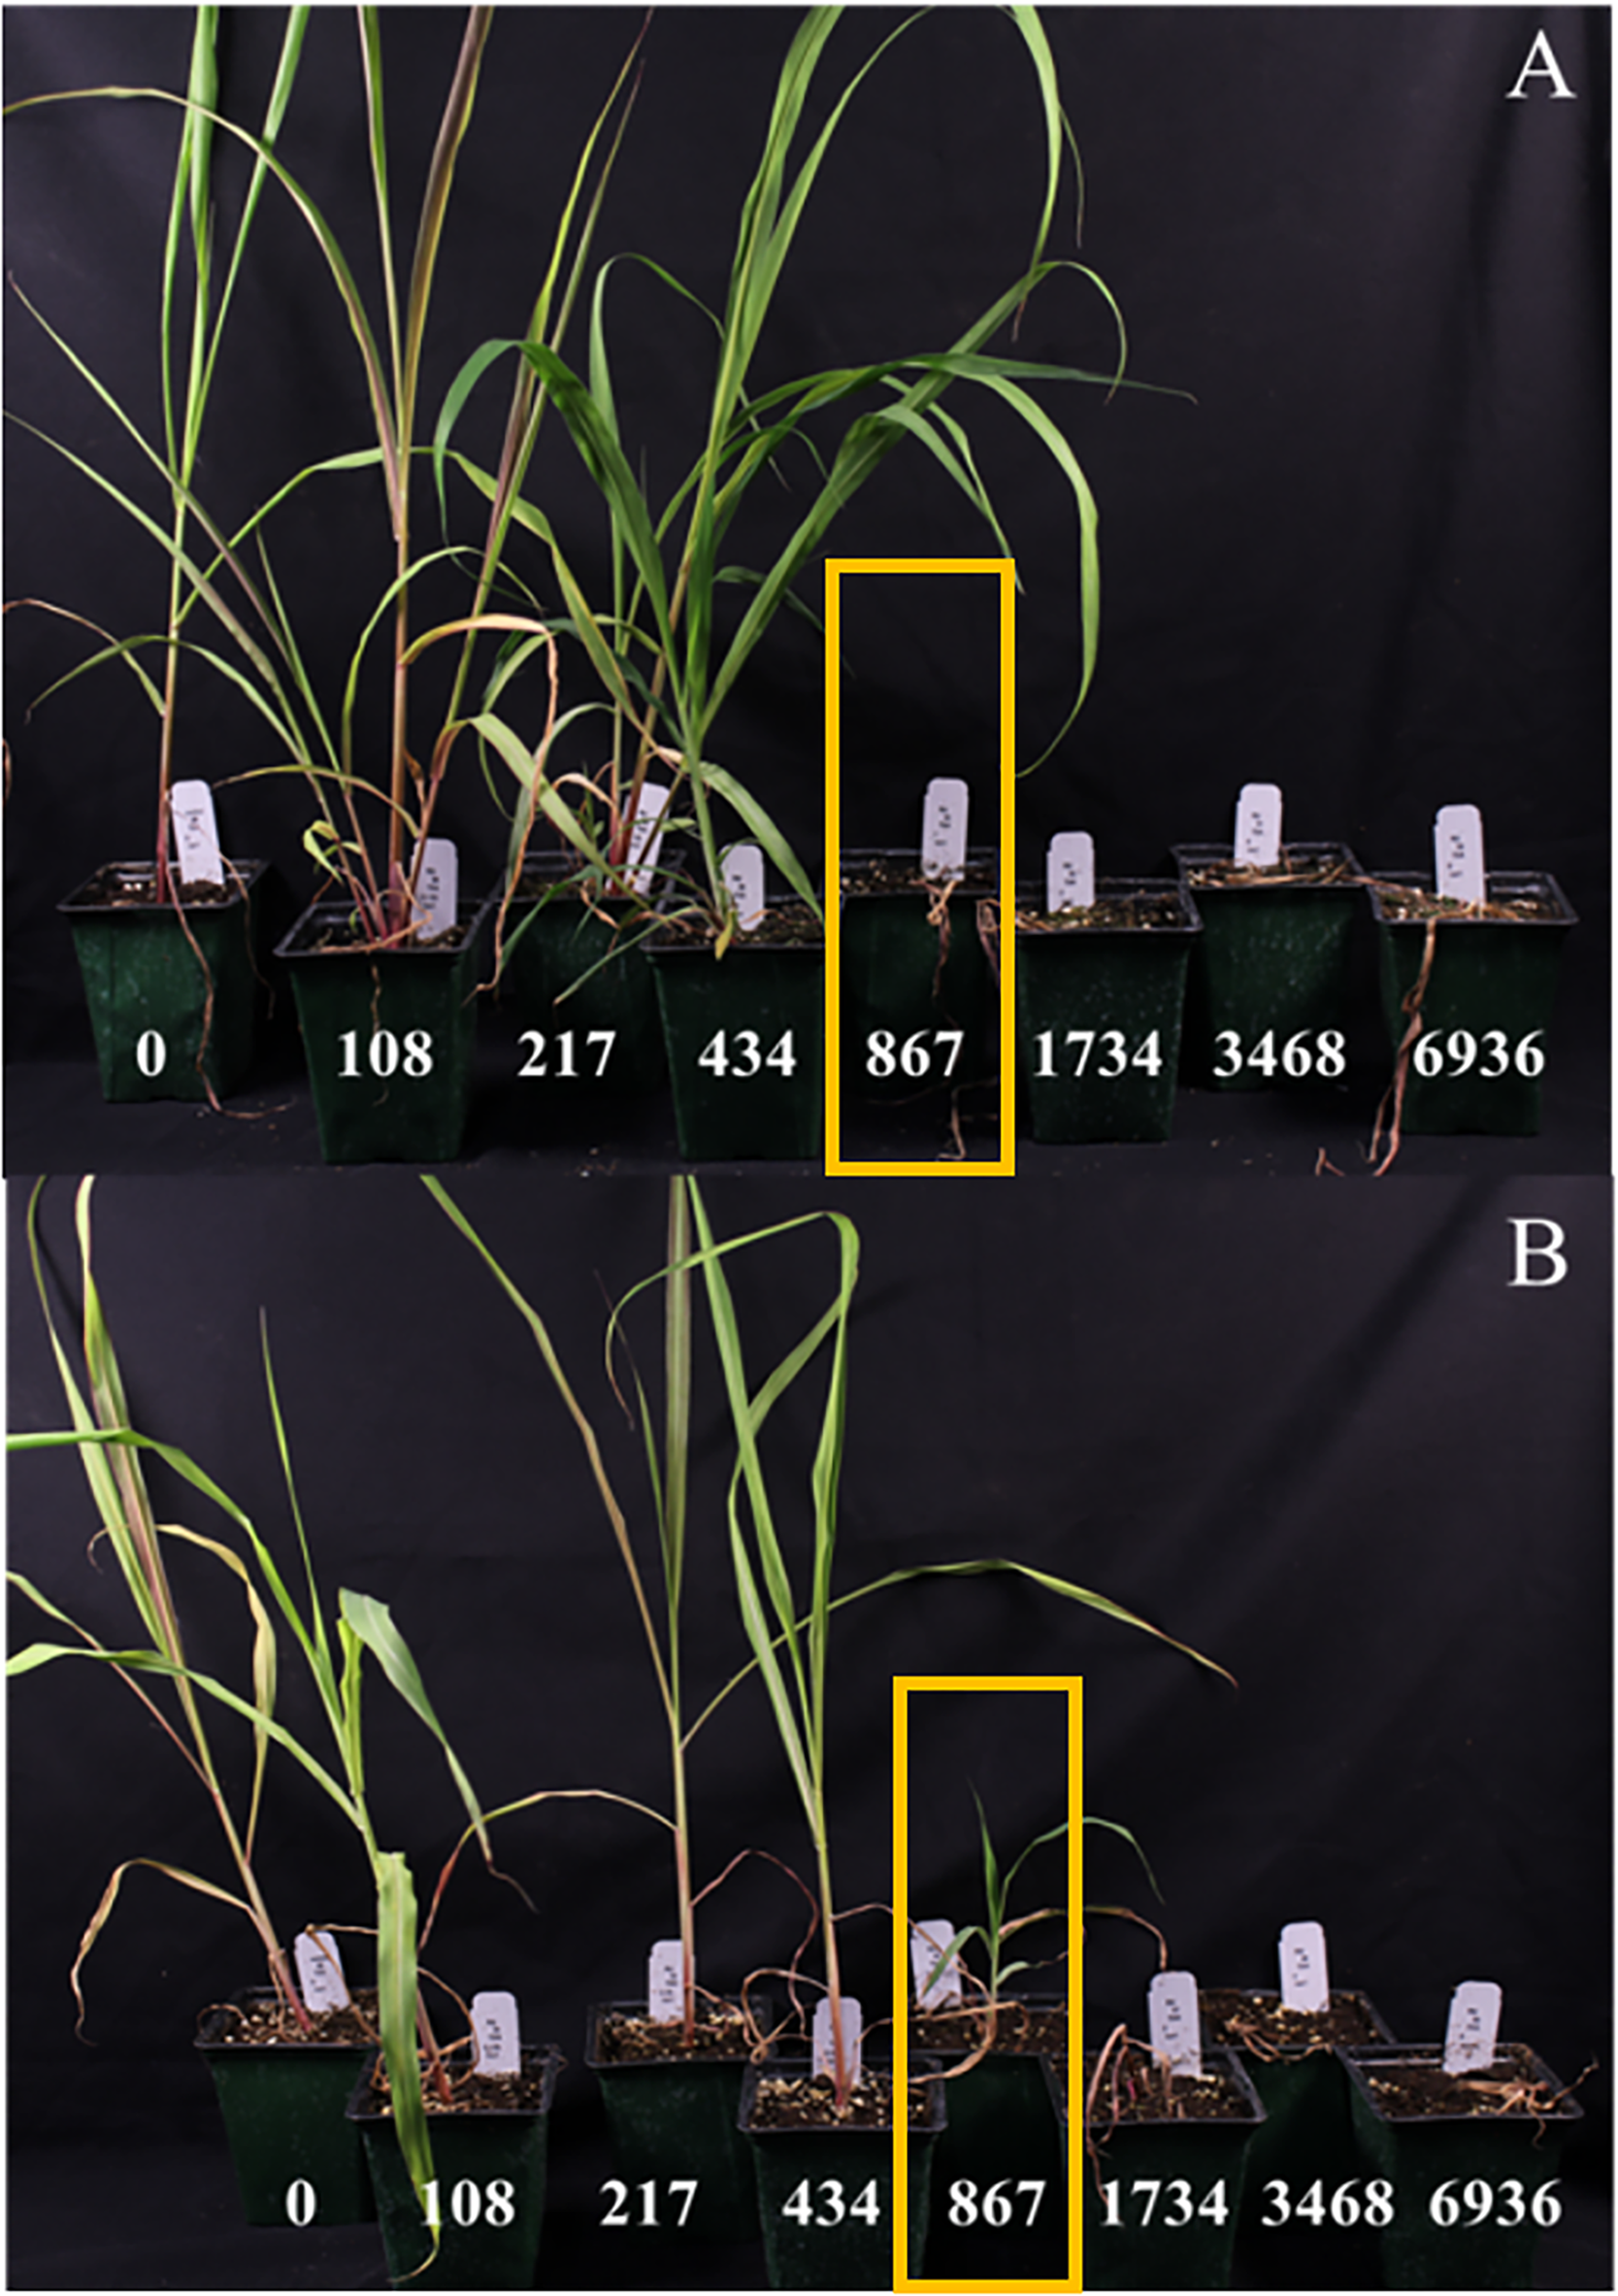
The ED50 values from dose–response assays for Texas-S and Texas-R were 443 and 1,036 g ha−1, respectively, with a corresponding R/S ratio of 2.3 (P < 0.01; Figure 1; Table 1). The glyphosate standard field use rate used in this study was 867 g ha−1, therefore Texas-R is 1.2-fold resistant, whereas Texas-S had an ED50 that corresponded to 0.51 times the field use rate (Figure 2). Low-level glyphosate resistance has also been observed in GR S. halepense biotypes from Arkansas and Argentina (Riar et al. Reference Riar, Norsworthy, Johnson, Scott and Bagavathiannan2011; Vila-Aiub et al. Reference Vila-Aiub, Balbi, Gundel, Ghersa and Powles2007). Riar et al. (Reference Riar, Norsworthy, Johnson, Scott and Bagavathiannan2011) observed GR50 values ranging from 1,780 to 2,920 g ha−1 when S. halepense was grown from rhizomes, while Vila-Aiub et al. (Reference Vila-Aiub, Balbi, Gundel, Ghersa and Powles2007) reported GR50 values ranging from 543 to 653 g ha−1 when S. halepense was grown from seed. In these studies, glyphosate was applied to larger, more developed plants. Riar et al. (Reference Riar, Norsworthy, Johnson, Scott and Bagavathiannan2011) treated plants at the 5- to 6-leaf stage, and Vila-Aiub et al. (Reference Vila-Aiub, Balbi, Gundel, Ghersa and Powles2007) applied glyphosate to individuals that were 30- to 50-cm tall. In contrast, our study applied glyphosate at an earlier developmental stage (3- to 4-leaf stage). Notably, Ahmadi et al. (Reference Ahmadi, Haderlie and Wicks1980) demonstrated that plant height at the time of herbicide application (10 vs. 20 cm) can reduce glyphosate effectiveness in barnyardgrass [Echinochloa crus-galli (L.) P. Beauv.]. Here, we provide evidence that this GR S. halepense biotype is capable of surviving glyphosate applications at early growth stages, underscoring the biological significance of the resistance level observed.
Dose–response assay of Sorghum halepense Texas-R (resistant) and Texas-S (susceptible) biotypes treated with glyphosate. Error bars represent the standard error of the mean at each dose; biomass reduction is expressed as a percentage of the nontreated control of each biotype.

Mean glyphosate dose required for 50% biomass reduction (ED50) in Texas-R and Texas-S Sorghum halepense biotypes.

Table 1. Long description
A table comparing ED50 values, resistance ratios, and P-values for two biotypes of Sorghum halepense. The table has three columns and two rows. The columns are labeled ED50, Resistance ratio, and P-value. The row labels are Texas-S and Texas-R. Row 1: Texas-S, ED50 443 g ae ha-1 (SE 63), Resistance ratio not applicable, P-value not applicable. Row 2: Texas-R, ED50 1,036 g ae ha-1 (SE 113), Resistance ratio 2.3, P-value less than 0.01.
a Field recommended labeled rate for glyphosate is 867 g ha−1.
b Ratio calculated by dividing Texas-R ED50 by Texas-S ED50.
Dose–response assay of a representative replicate of susceptible Texas-S (A) and resistant Texas-R (B) Sorghum halepense. Pots are labeled with corresponding glyphosate rates (g ae ha−1), the labeled recommended field use rate is 867 g ha−1.

EPSPS Gene Sequencing and CNV
We have developed species-specific primers for identifying target-site mutations in S. halepense, providing new tools for monitoring glyphosate resistance in future cases. The CNV assay described here is also novel in that it enables quantification of copy number in a polyploid species, in which distinguishing between subgenomes can be particularly challenging.
Primers were designed that amplified the fragments of the EPSPS genes that contain the typical resistance mutations from both subgenomic copies of EPSPS simultaneously (Supplementary Figure S2). Nanopore amplicon sequencing of the EPSPS gene revealed no amino acid substitutions between the susceptible and resistant biotypes in any of the nanopore reads. The sequences were consistent to those previously reported in resistant biotypes from Argentina (Vila-Aiub et al. Reference Vila-Aiub, Balbi, Distéfano, Fernández, Hopp, Yu and Powles2012), and no amino acid substitutions were detected at known positions of Thr-102 and Pro-106. In addition, cycle differences in CNV assays for both biotypes were less than one, indicating no increase in EPSPS gene abundance relative to ALS (0.43 ± 0.07 vs. 0.61 ± 0.09 in Texas-S and Texas-R, respectively; mean ± SE). These results suggest that the typical target-site resistance mutation of the Pro-106 residue is not responsible for glyphosate resistance in the Texas-R biotype. Furthermore, given that the ED50 value in this biotype does not indicate a high level of resistance, we suspect this biotype contains a non–target site resistance mechanism or a previously uncharacterized target-site mutation of minor effect (Sammons and Gaines Reference Sammons and Gaines2014). Non–target site mechanisms are typically complex, often polygenic, and often can confer low- to moderate-level resistance allowing survival at labeled rates, particularly during early stages of selection (Gaines et al. Reference Gaines, Duke, Morran, Rigon, Tranel, Küpper and Dayan2020; Jugulam and Shyam Reference Jugulam and Shyam2019).
Glyphosate Quantification
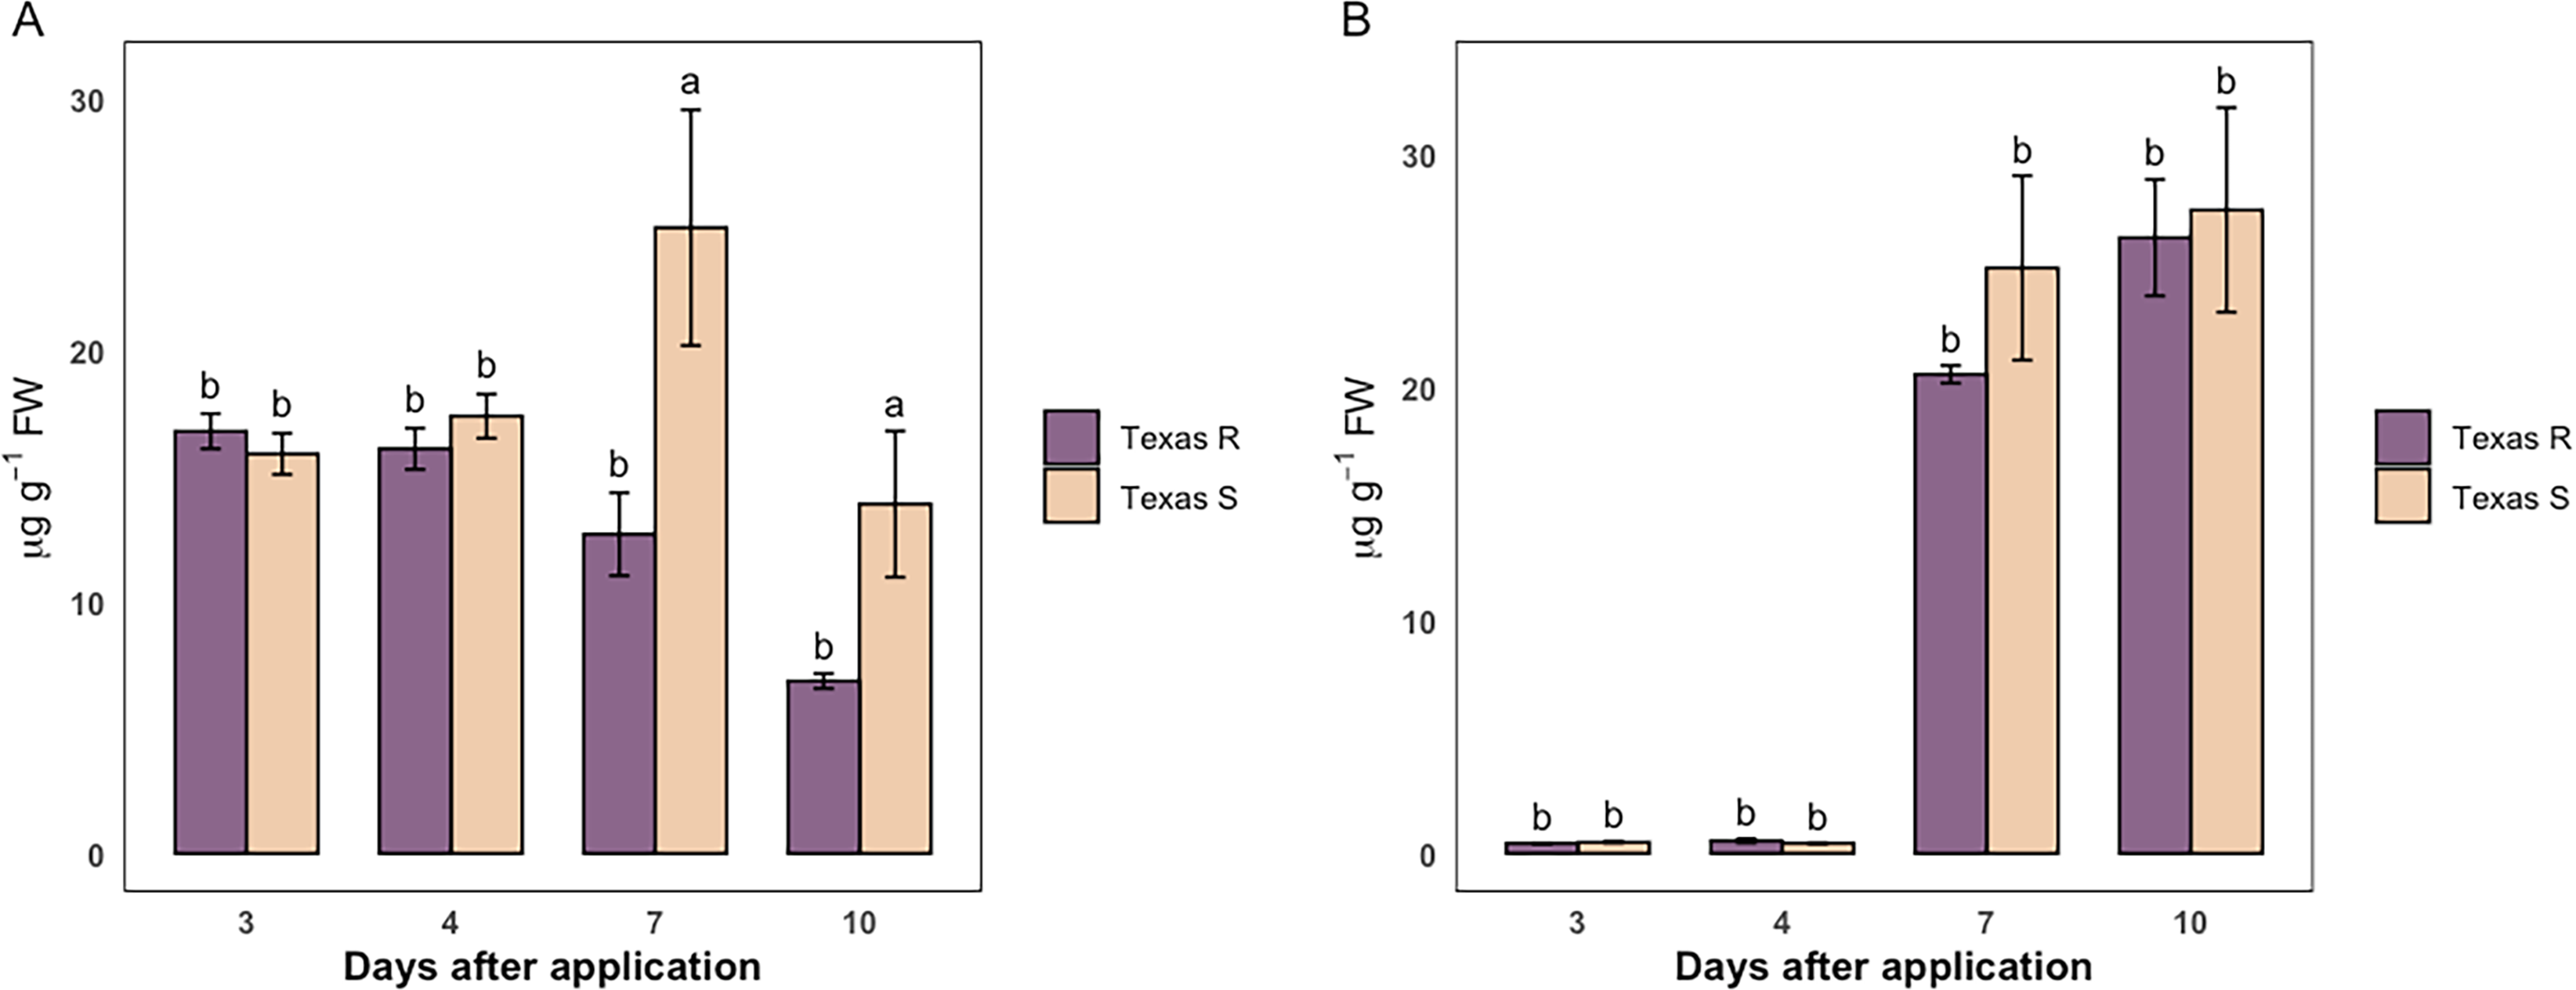
To determine whether differences in glyphosate absorption and/or translocation contributed to the resistance phenotype in Texas-R, glyphosate concentrations were quantified in shoot and root tissues across multiple points following application in both biotypes. There was no difference in shoot glyphosate concentration at 3 or 4 DAA between biotypes (Figure 3A), which indicates absorption is not the cause of resistance. However, by 7 DAA, the glyphosate concentration in Texas-R shoot tissue was 48% less than in Texas-S shoot tissue (12.70 vs. 24.90 μg g−1 FW), and this difference persisted 10 DAA, with Texas-R containing 50% less glyphosate than the susceptible biotype (6.86 vs. 13.90 μg g−1 FW). In contrast, glyphosate concentrations in root tissue increased between 4 and 7 DAA in both biotypes and continued to rise through 10 DAA, with no significant differences detected between Texas-R and Texas-S at any time point (Figure 3B).
Mean glyphosate concentration in shoot (A) and root (B) tissue types (μg g−1 FW) at 3, 4, 7, and 10 d after application (DAA) in Texas-R and Texas-S Sorghum halepense biotypes. Bars marked with different lowercase letters are significant at P-value < 0.05 between biotypes within a time point.

Results indicate that glyphosate is translocated to belowground tissues in both biotypes in similar amounts. Therefore, resistance in Texas-R is unlikely explained solely by reduced translocation. This is in contrast to prior research, which showed that glyphosate resistance in S. halepense was due to reduced translocation to belowground tissue (Vila-Aiub et al. Reference Vila-Aiub, Balbi, Distéfano, Fernández, Hopp, Yu and Powles2012). The exact mechanism causing reduced translocation has not been identified in S. halepense. Prior research measured translocation by quantifying the amount of [14C]glyphosate in belowground tissue using liquid scintillation detection, which detects total 14C but does not resolve its chemical fate (Vila-Aiub et al. Reference Vila-Aiub, Balbi, Distéfano, Fernández, Hopp, Yu and Powles2012). Here, we used tandem mass spectrometry to directly measure glyphosate within tissue samples. However, the divergence in shoot glyphosate concentrations at 7 and 10 DAA, in the absence of corresponding differences in root accumulation, suggests that glyphosate fate is different between biotypes.
Glyphosate metabolism has been demonstrated as a resistance mechanism in other grass species, including sourgrass [Digitaria insularis (L.) Mez ex Ekman] and E. colona, where metabolism of glyphosate to nontoxic compounds contributed to reduced herbicide efficacy and thus the resistance phenotype (De Carvalho et al. Reference De Carvalho, Alves, Gonzalez-Torralva, Cruz-Hipolito, Rojano-Delgado, De Prado, Gil-Humanes, Barro and Luque de Castro2012; Pan et al. Reference Pan, Yu, Han, Mao, Nyporko, Fan, Bai and Powles2019). Reduced glyphosate concentrations observed in Texas-R shoot tissue over time in this study are consistent with this mechanism, although direct identification and quantification of glyphosate metabolites will be required to confirm this hypothesis.
This research characterizes glyphosate resistance in an S. halepense biotype, integrating dose–response, molecular, and physiological approaches. The absence of EPSPS mutations and EPSPS CNV suggests that resistance in Texas-R is not mediated by known target-site mechanisms. Further, temporal patterns of glyphosate concentration indicate that resistance cannot be explained by impaired translocation but suggests a role for altered herbicide fate. Overall, these results are consistent with non–target site resistance mechanisms potentially playing a role in this biotype. Importantly, this work introduces species-specific molecular tools for reliably detecting EPSPS-based resistance in a polyploid weed, addressing a key limitation in resistance diagnostics for S. halepense. Although this biotype exhibits low-level resistance, survival at labeled glyphosate rates indicates that reliance on glyphosate alone will accelerate resistance evolution. Together, these findings advance both the mechanistic understanding and diagnostic capacity for glyphosate resistance in this species.
Supplementary material
To view supplementary material for this article, please visit https://doi.org/10.1017/wsc.2026.10133
Acknowledgments
We would like to thank Reagan Noland and Ryan Matschek at Texas A&M University for sending us biotype seeds for this work. Their collaboration and interaction was greatly appreciated in making this work possible. We would like to thank Tony Schilmiler and James O’Keefe from the MSU Mass Spectrometry Core. We thank the DOE Joint Genome Institute and collaborators for prepublication access to the genome of Sorghum halepense.
Funding statement
This research was supported by the Multiregional Soybean Checkoff Program and the United Soybean Board (Project no. 26-206-S-C-2-G) to undertake this collaborative effort.
Competing interests
The authors declare no conflicts of interest.



 Open access

