Introduction
The use of computer technology in design has been increasing for last few years. With broad use of computer-based methodology, we can now automate parts of the design process. Specifically, artificial intelligence (AI) has gained increasing attention in design technology, as it opens new productive ways to solve design problems (Amarel, Reference Amarel1990; Schank and Jona, Reference Schank and Jona1991). Among the different design challenges, AI can be especially useful for reducing human errors in areas such as value computing, multiple interacting goals, and posteriori evaluations of design success (Amarel, Reference Amarel1990). This paper touches on the issue of human bias and error in design value computing and discusses a possible avenue for future AI design automation.
Designers use various tools and methods to generate, present, and develop product ideas. In the product design realm, designers often, if not always, use visual presentations – such as sketches and prototypes – to communicate developing and/or final product ideas (Goldschmidt, Reference Goldschmidt1991; Ainsworth et al., Reference Ainsworth, Prain and Tytler2011). The use of such visual representations helps designers save cost and time before going into full production (Houde and Hill, Reference Houde, Hill, Helander, Landauer and Prabhu1997). Simultaneously, the incorporation of users’ feedback in design process has become highly appreciated during the past decade (Gould and Lewis, Reference Gould and Lewis1985). New design techniques involving audience interaction have been developed, including co-operative prototyping, the task analysis method, and the participatory design method (Muller, Reference Muller1991; Kyung, Reference Kyung and Carroll1995; Van der Veer et al., Reference Van der Veer, Lenting and Bergevoet1996). One of the techniques used to assess the creativity of ideas is the consensual assessment technique (CAT) (Amabile, Reference Amabile1983). With CAT, a group of judges, who are experts in the presented field, rate the creativity of the idea based on their experience and subjective criteria. Over the years, the use of this technique has increased in diverse fields, such as musical composition, writing, and product design (Amabile, Reference Amabile1983; Daignault, Reference Daignault1997; Priest, Reference Priest1997).
The increasing use of CAT and other user feedback demonstrates the shift of focus from the creator's expertise to the audience's experience. However, what is less understood is the psychology of the audience evaluation processes. To what extent do audiences understand the value of the idea? How does presentation skill play into this relationship? After all, the audience is given a summarized representation of the idea, whether the product is in an early phase or a final phase. Accordingly, can the audience actually tell the value of the idea or concept, even when the presentation is weak? If not, can people at least discriminate between the presentation and the content of the presentation? To begin to answer these questions, this paper focuses on the trichotomic relationship between the audience, the idea, and the presentation.
Answering and discussing this trichotomic relationship is important: If we cannot discriminate presentation from ideas, there is the risk of investing in less viable ideas or discarding strong ideas. In team settings, such tendency will result in slowing down of innovative breakthroughs and wasting of resources. In an industrial setting, the problem may continue in human resources (HR); if HR has difficulty discriminating between creative value of human capital and their presentation quality, the company may result in ineffective investment of time and capital. Moreover, valuable ideas can be obscured by inept presentation skills, resulting in the loss of good ideas. Such outcomes of discrimination have been discussed before in engineering literatures (Ainsworth et al., Reference Ainsworth, Prain and Tytler2011; Kudrowitz et al., Reference Kudrowitz, Te and Wallace2012).
In addition, previous literature on the visual presentation of idea concepts has focused on the early stages of idea generation. On the other hand, not enough literature focuses on the relationship between the quality of ideas and the quality of the final presentations. The visual presentation of an idea may become difficult at advanced stages, as the idea becomes more detailed and refined.
Thus, this paper examines this relationship between different kinds of presentations and the perceived quality of the concept being presented at different stages of the design process. This study was done in the context of a specific product design course offered in five consecutive years, during which teams presented concepts at different stages of development, and ideas were evaluated independently by audiences of expert reviewers.
The questions explored in this paper are:
• Can the viewers discriminate between the quality of presentation and the value of the idea being presented?
• Do different kinds of presentations (oral pitch vs. poster vs. prototype) influence the perceived quality of the idea differently?
• Is it more difficult for viewers to discriminate between a presentation and the concept when the concept is more refined and close to realization?
Background
Today, the ability to stand and effectively deliver information has become one of the most important aptitudes. As Reynolds (Reference Reynolds2011) mentioned in his writing, the modern era is the “presentation generation” (Presentation Zen). Engineers and designers also heavily rely on different kinds of presentations when developing a new product. The technologies that record and deliver the stages of product design are evolving; thus, the need for designers to learn presentation techniques is ever rising. This paper focuses on three frequently used presentation techniques: the idea pitch (specifically, elevator pitch), in which the presenter talks about the product idea in a limited time; the poster, in which the presenter uses visual aids to convey information about the product; and the prototype, in which the presenter uses physical materials to present a three-dimensional (3D) representation of the idea. In this study, we also explore three levels of prototype fidelity. Throughout the paper, we use the term presentation and by that term we are referring to all forms of presentation including the oral pitch, the visual posters, and a variety of prototypes.
Pitch
An idea pitch refers to delivering ideas for consideration in front of an audience. The word “pitch” is used in baseball when the pitcher throws the ball. As the root of the word, the pitch is often limited in time, and the presenter has to make the best of this time. Idea pitching has been used widely, especially in the business world, where ideas are often pitched to persuade investors to support the product idea. The pitch may or may not have visual aids, but the sole focus is usually on the presenter's talk.
An article from Harvard Business Review explains how a pitcher's ability to talk shadows the idea being pitched. In <150 ms, the audience is judging the pitcher's character and whether the ideas are going to be good based on that character (Elsbach, Reference Elsbach2003). As a result, if the pitch is good, the audience already thinks that the idea is good. If the pitch is bad, then so is the idea. Unfortunately, it is often said that idea pitching is harder than idea conceiving. A good pitch requires paying attention to time, being logical, and comprehensive; focusing on benefits instead of solutions; not apologizing for cost involved; avoiding unwarranted claims; and ignoring potential roadblocks while persuading and guaranteeing that the idea will work to a number of people who do not always welcome new ideas (Ramsey, Reference Ramsey1999). During a product design idea pitch, a good presenter will talk about the environment in which the product will be used, who will be using it, the problem that needs to be solved by the new product, and the result of using the product (Ullman and Bentler, Reference Ullman and Bentler2003).
This absurdly long list for a very short presentation is only a partial guideline to making a good pitch. Psychologists have done research on what makes a person persuasive and found that non-verbal cues, such as open-hand gestures and facial expressions, influence listeners’ attitudes toward the presenter (Davitz, Reference Davitz1964; Ekman et al., Reference Ekman, Friesen and Ellsworth1972). The difference in vocal tones, eye contact, knowledge of spontaneous cues, and the ability to express emotions were also instrumental in negotiations (Albert and Dabbs, Reference Albert and Dabbs1970; Scherer et al., Reference Scherer, Koivumaki and Rosenthal1972; Zuckerman et al., Reference Zuckerman, Porac, Lathin and Deci1978; Hall, Reference Hall1980). The combination of these experiments demonstrates that the audience is largely and frequently influenced by the presenter's behavior, regardless of what was being conveyed.
Based on this previous literature, this study examines if the audience can tell the difference between a good idea pitch and a good idea. Thus, the first hypothesis follows:
H1a.
Quality of presentation and perceived quality of the presented idea will be correlated, such that presenters’ pitch scores will be positively correlated with the concept scores.
Product drawing
The power of visual presentation is acknowledged by many experiments in various areas. Just as with the phrase “a picture is worth a thousand words”, cognitive psychologists believe that visual or graphical aids help the audience understand new concepts better (Finke, Reference Finke1996). Mayer and Anderson (Reference Mayer and Anderson1991, Reference Mayer and Anderson1992) found that visual presentations lead to more successful persuasion of an argument compared with when only aural material was presented. A recent article on consumer behavior also reported that consumers want to pay, on average, 50% more for items they could physically see. This article states that the brain knows the value of stimuli being present and computes in a different way (Clabby, Reference Clabby2017). Moreover, the visibility of ideas not only helps the viewer better understand the concept but also the person who generated the idea. Designers predominately use sketches to inspect and revise their own ideas. In a sense, a designer uses sketches to have a conversation with themselves – providing self-feedback and revising based on it (Goldschmidt, Reference Goldschmidt1991; Suwa and Tversky, Reference Suwa and Tversky1997; McKoy et al., Reference McKoy, Vargas-Hernández, Summers and Shah2001; Shah et al., Reference Shah, McLeod and Yoon2001).
As a result, the visual presentation of concepts is critical throughout the design process: from an ambiguous and unstructured sketch, the visual presentation is refined into a more detailed and complete representation of the idea. Many experiments from various areas demonstrated the impact of such visual presentations on the perceived quality of ideas. For example, Tovey et al. (Reference Tovey, Porter and Newman2003) summarized that the clarity of the sketch reflects the stage of the idea development. By looking at the quality and the complexity of the sketch, the audience can understand how detailed and realistic the idea has become. In another study, viewers rated the most complex sketches as having the most complete and detailed ideas, as opposed to abstract and minimalistic sketches, which they saw as having less developed ideas. In other words, the quality of product sketches influences the perceived creativity (or the quality) of a product idea (Kudrowitz and Wallace, Reference Kudrowitz and Wallace2010). Thus, it is safe to say that the audience is heavily influenced by the quality of visual presentation when rating the ideas; no matter how creative the idea is, if the visual presentation fails, the idea fails (Malamed, Reference Malamed2015). Accordingly, the second hypothesis follows:
H1b.
Quality of presentation and perceived quality of the presented idea will be correlated, such that presenters’ poster scores will be positively correlated with the concept scores.
Prototype
Studies on prototypes are well established compared with posters. Prototypes are the early forms of the idea realization. Prototypes range from sketch models (fast, lo-fi models made of inexpensive materials, such as foam and cardboard) to sophisticated works-like and looks-like models, which are sometimes 3D printed with high resolution (Ullman and Bentler, Reference Ullman and Bentler2003; Goel, Reference Goel1995; Yang, Reference Yang2005). The technology for building prototypes is evolving: CAD, laser cutting, electron discharge machining, and 3D printing in plastic/metal are all part of today's new technology that enable making prototypes (Venus and Riat, Reference Venus and Riat1997).
Prototypes may or may not work like the real product, depending on the purpose of the prototype. Prototypes allow the viewers to recognize the overall “image” of the product. Traditionally, the key function of prototypes was to understand how a product would look and feel when the final product was made (Houde and Hill, Reference Houde, Hill, Helander, Landauer and Prabhu1997). Depending on the sophistication of the prototype, viewers can explore and understand the product better by interacting with the prototype (Buchenau and Suri, Reference Buchenau and Suri2000). By constructing a prototype during different stages of design, designers can interact with a physical representation of their ideas, eventually producing better outcomes (Yang, Reference Yang2005).
On the other hand, recent research focus is shifting to presenting the prototype to the audience for feedback. With more advanced technology to produce more realistic prototypes, the business communities are emphasizing the importance of prototyping in product innovation (Leonard and Rayport, Reference Leonard and Rayport1997). For example, prototyping is important in a product's development in corporate environments – such as Apple and Xerox Parc – and their presentation of those prototypes has become similar to a theatrical show rather than the conventional experience survey (Burns et al., Reference Burns, Dishman, Johnson and Verplank1995). Extended research also has focused on different levels of fidelity, the different combination of audiences, and the context of product development (Wagner, Reference Wagner and Laurel1990; Muller, Reference Muller1992; Wong, Reference Wong1992).
Broadly, previous literature has categorized prototyping into three different kinds. First are the throwaway prototypes, which are cheap, rough, and easy to make with only a purpose of developing an idea. In the second category are the evolutionary prototypes that let designers iterate, modify, and reiterate repeatedly to find better solutions for all parts. These prototypes are often built as the following stage of the throwaway prototypes. Incremental prototypes – the third stage – are prototypes that modify or improve products that already exist or are on the market. Accordingly, the incremental prototypes may come after making evolutionary prototypes (Sommerville, Reference Sommerville1995). The three stages may differ in sophistication or completeness, yet the quality of how the prototype is made (at any stage) will heavily influence the audience when evaluating the idea. Thus, the third hypothesis follows:
H1c.
Quality of presentation and perceived quality of the presented idea will be correlated, such that presenters’ prototype execution scores (the quality of the model) will be positively correlated with the concept scores.
Prototype stages
In our study, we additionally analyzed if the correlation between presentation quality and concept scores changes throughout the product development stages. In the class, product ideas and the presentations are refined as the semester progresses: as mentioned in the prior sections, presentation concepts evolved from 2D images to throwaway sketch models to more evolutionary models, then to more advanced looks-like/works-like final prototypes. In a way, the idea becomes more refined and specific, while the representation of it becomes more similar to a real product. The question is, do these changes in the development stage affect the audiences’ ability to discriminate presentation quality from the idea quality? If so, how and why?
The expected pattern is that the audience would have more difficulty in discriminating the concept from the presentation as both become more realistic and realizable. The perception of product quality is dependent on how the prototypes are executed, as consumers define quality as “fitness for use” when exploring prototypes. In summary, this means that the perceived product quality is also known to be dependent on the consumer's knowledge of the product's functions (Gupta et al., Reference Gupta, Kota and Mishra2016). As the prototype becomes closer to a final product, the audience is able to understand and imagine the final use better. This will then enable the audience to better appreciate the value of the idea. On the other hand, it would be harder for the designers to tell if the audience is simply enjoying the execution of the idea or the idea itself.
H2.
Participants will have more difficulty discriminating the quality of concept from the quality of presentation as the concepts become more refined, such that there will be a linear increase in presentation–concept correlation.
Method
Data collection
Data were collected from year 2013 to 2017 in a single multidisciplinary product design course at a university. During the 5 years, participants comprised 347 undergraduate and graduate students from various departments, including engineering, design, business, and humanities. Data consist of a series of semester-long individual and team presentation scores and idea concept scores that were collected in four phases throughout a design process taught in the class. In the class, students were randomly assigned to teams with group sizes of five or six. They are tasked with developing new product ideas for a real client from a provided theme. Over the 5-year period, there were a total of 59 teams.
Each year, in the second week of class, the teams are presented with the theme in the form of a minimally constrained design prompt provided by a real industry partner. The following are the five themes that were given to the class in the years from 2013 to 2017:
2013 – Toys that help people create or be creative (no specific age).
2014 – Toys that enable children to be makers in any domain (no specific age).
2015 – Pole-mounted playground equipment for ages 2–12.
2016 – STEM-related toys for ages 5+.
2017 – Playful family products for summer, winter, or Halloween.
In each year, the design prompt is the starting point for the four phases of the design process used in the class. At the end of each phase, the concepts, presentations, and drawings/prototypes are reviewed independently by a group of industry professionals (primarily designers and engineers) on creativity and quality metrics. The four phases of the course are described below:
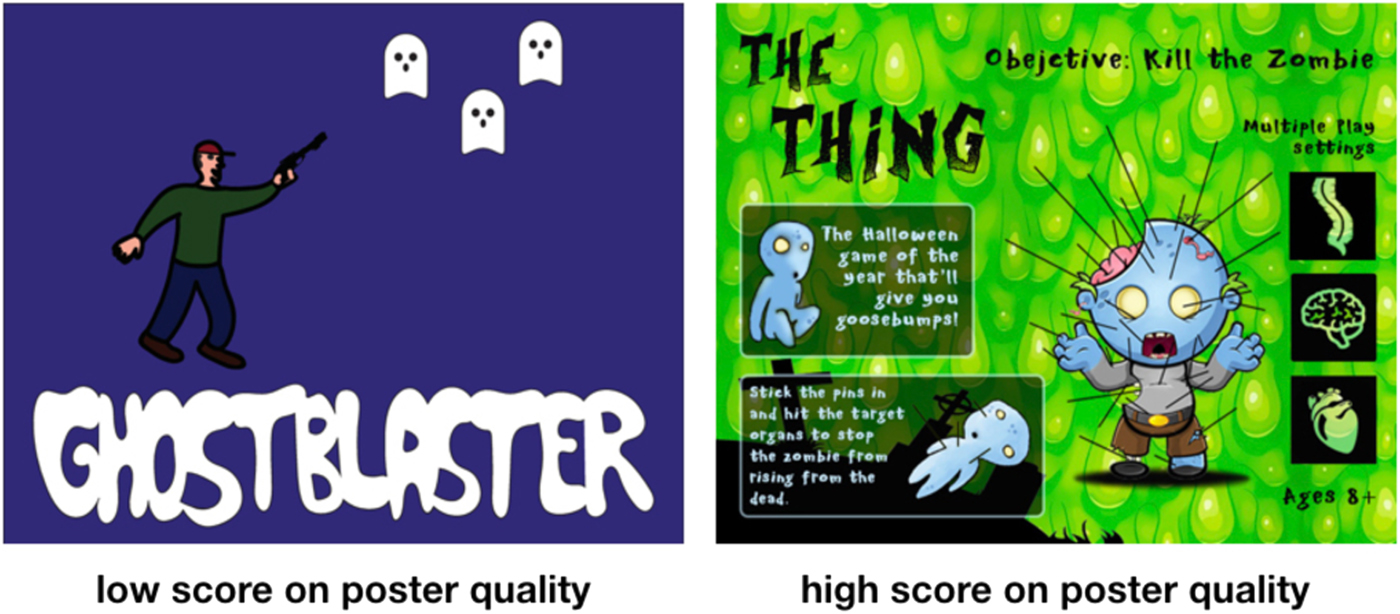
Phase 1. At this review, the team has generated many ideas and decided on the top 5–6 concepts to present to the industry and the client. These ideas are represented as drawings or illustrations on a screen. The members of team have 30–60 s to pitch each of their ideas verbally using one image, a poster. At this review, the reviewers scored the oral presentation, the poster, and the concept separately with a written note and oral reminder to try to separate the concept quality from the poster and oral presentation quality, and to score these three items separately. Examples of posters with a low-quality score and a high-quality score are presented in Figure 1.
Examples of low versus high scored concept posters.

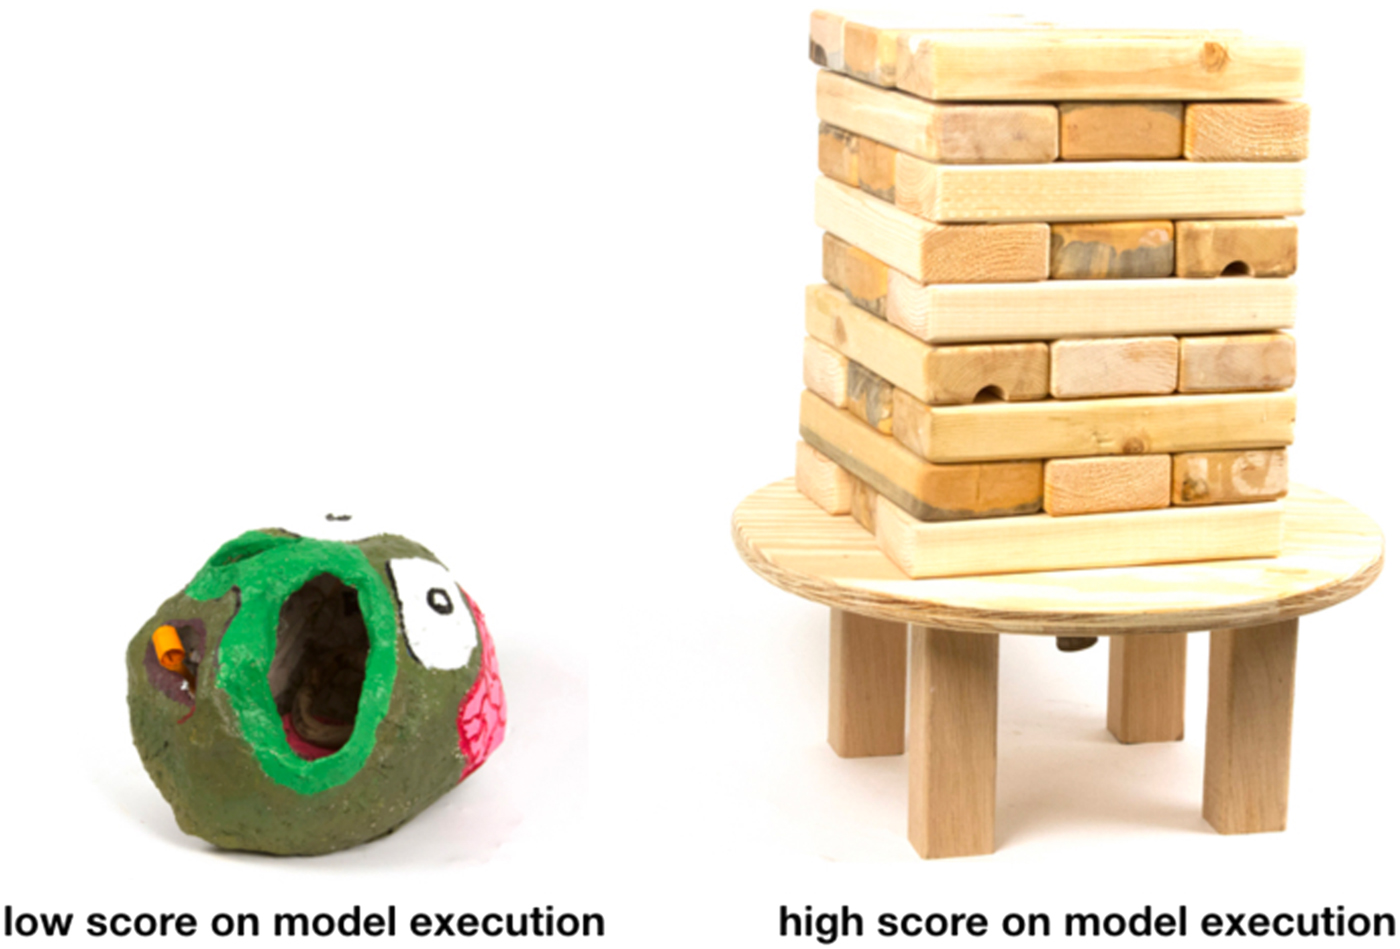
Phase 2. After the first presentation, teams used feedback from the review to focus on two of the ideas and developed 5–6 different sketch models based on these two original ideas. After 3 weeks, the team presented these sketch models again to a group of reviewers from the industry. The reviewers evaluated the quality of the model execution and the quality of the idea. Again, reviewers were asked orally and in a written note to separate the concept from the model quality when providing scores. Examples of sketch models with a low model execution score and a high model execution score are shown in Figure 2. The model to the left is a papier-mâché door-knocker that requires the user to put their hand in the nose of the face to use it. The model to the right is a large version of the game Jenga that involves attaching a garden hose, which adds additional water play elements.
Examples of low versus high scored sketch models.

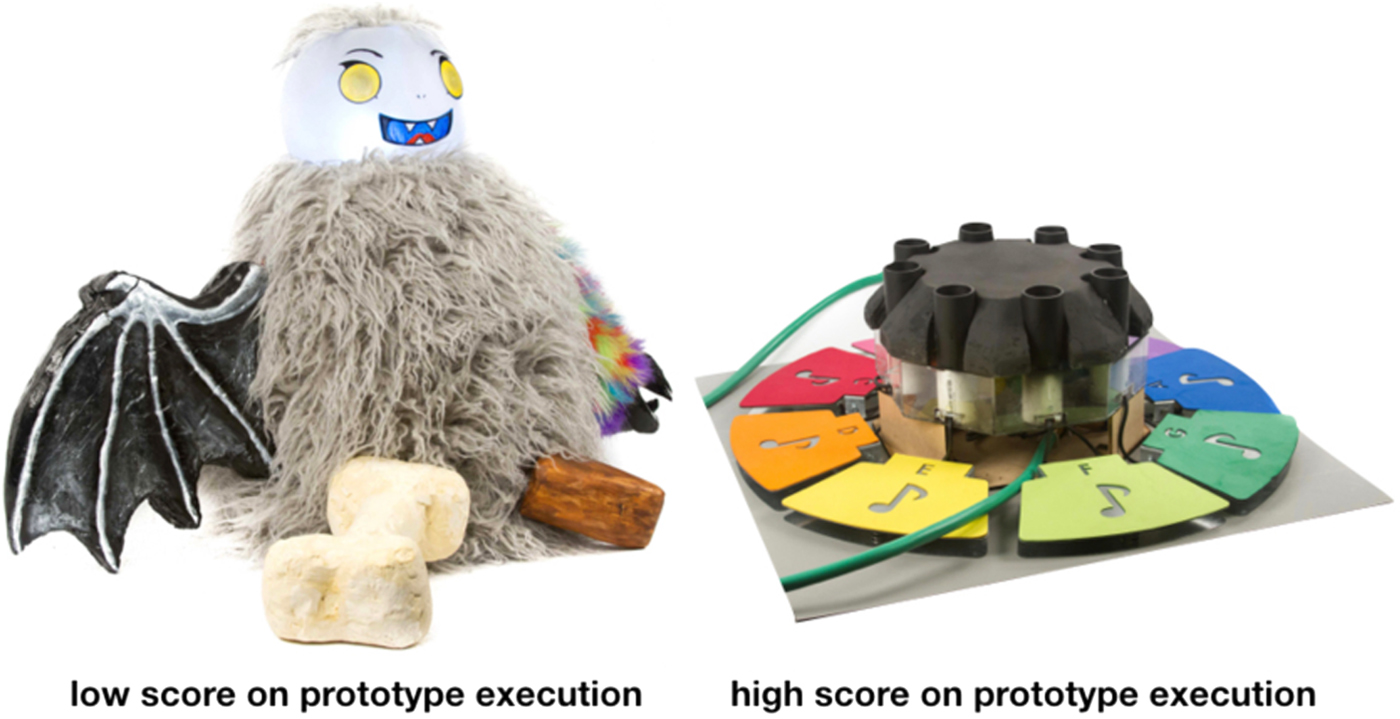
Phase 3. Based on the feedback from the second review, the teams then selected two of the best concepts. During the following 3 weeks, the teams discussed and refined these two concepts to create more refined prototypes that worked as intended. At the end of the 3 weeks, the teams presented their prototypes to a group of reviewers from the industry. The reviewers evaluated the quality of the prototype execution and the quality of the idea. Again, reviewers were asked orally and in a written note to separate the concept from the prototype when providing quality scores. Examples of refined prototypes with a low prototype execution score and a high prototype execution score are shown in Figure 3. The model to the left is a Halloween decoration that is a customizable monster, which sits on one's porch. The model to the right is a water sprinkler that plays music and ejects water when users step on the foot pedals.
Examples of low versus high scored refined prototypes.

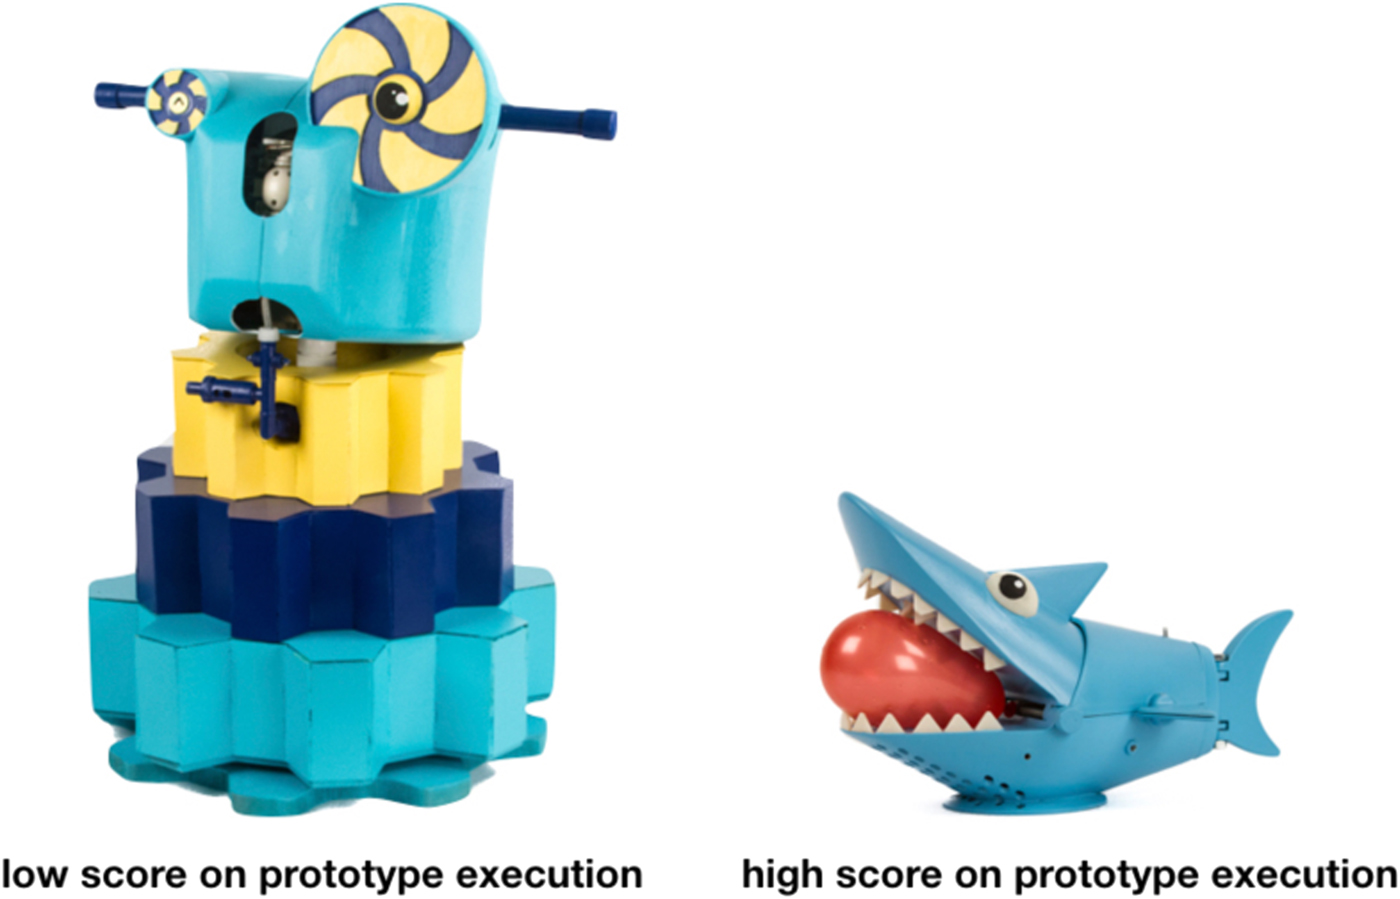
Phase 4. Based on the industry feedback and team discussion, the team selected the best idea to refine and further develop for a final presentation. On the final day of class, each team presented a final product prototype, which should look and work like a real product, to an audience of ~350 industry professionals. The audience evaluated each team on the presentation, prototype execution, and concept. Again, the audience was asked to separate the oral presentation, the prototype, and the concept. Examples of final prototypes with a low prototype execution score and a high prototype execution score are shown in Figure 4. The model to the left is a robot-themed sprinkler that shoots water at random times. The model to the right is a “hot-potato” game in which the shark-themed hat is passed between players each cranking down a turn on the shark's mouth, which eventually pops a water balloon on someone's head.
Examples of low versus high scored final prototypes.

Data collection and procedure
From phase 1 to 4, as mentioned above, we collected scores for concepts, pitches, posters, and prototypes from industry professionals. The number of industry professionals at each review varied between phases as well as between years. For each phase from 1 to 3, the number of industry professionals evaluating the work varied between 40 and 60 at each review session over the 5-year span. As the presentations of phase 4 take place in a theatre and are heavily promoted, the number of industry professionals reviewing phase 4 was much higher than phase 1–3 and ranged between 250 and 350 at each review session over the 5-year span. In each phase, the reviewers were asked to rate the quality of the presentations/posters/prototypes as well as the creativity of the concepts on a scale of either 0–5 or 0–6 points, which were later all recomputed into 0–5 scale. For the creativity metric, 0 was indicated to be the “least creative” and 5 and 6 were identified as being the “most creative”. Although it was up to the reviewers to decide what is “creative”, often creativity in product design is something that is “novel, valuable, and feasible”. Inspired by the CAT (Amabile, Reference Amabile1983), no other written criteria were provided for rating creativity. The industry professionals were to score each presentation with their own criteria for creativity, which were formed from experience as a professional designer or engineer. Similar rating instructions were used for quality.
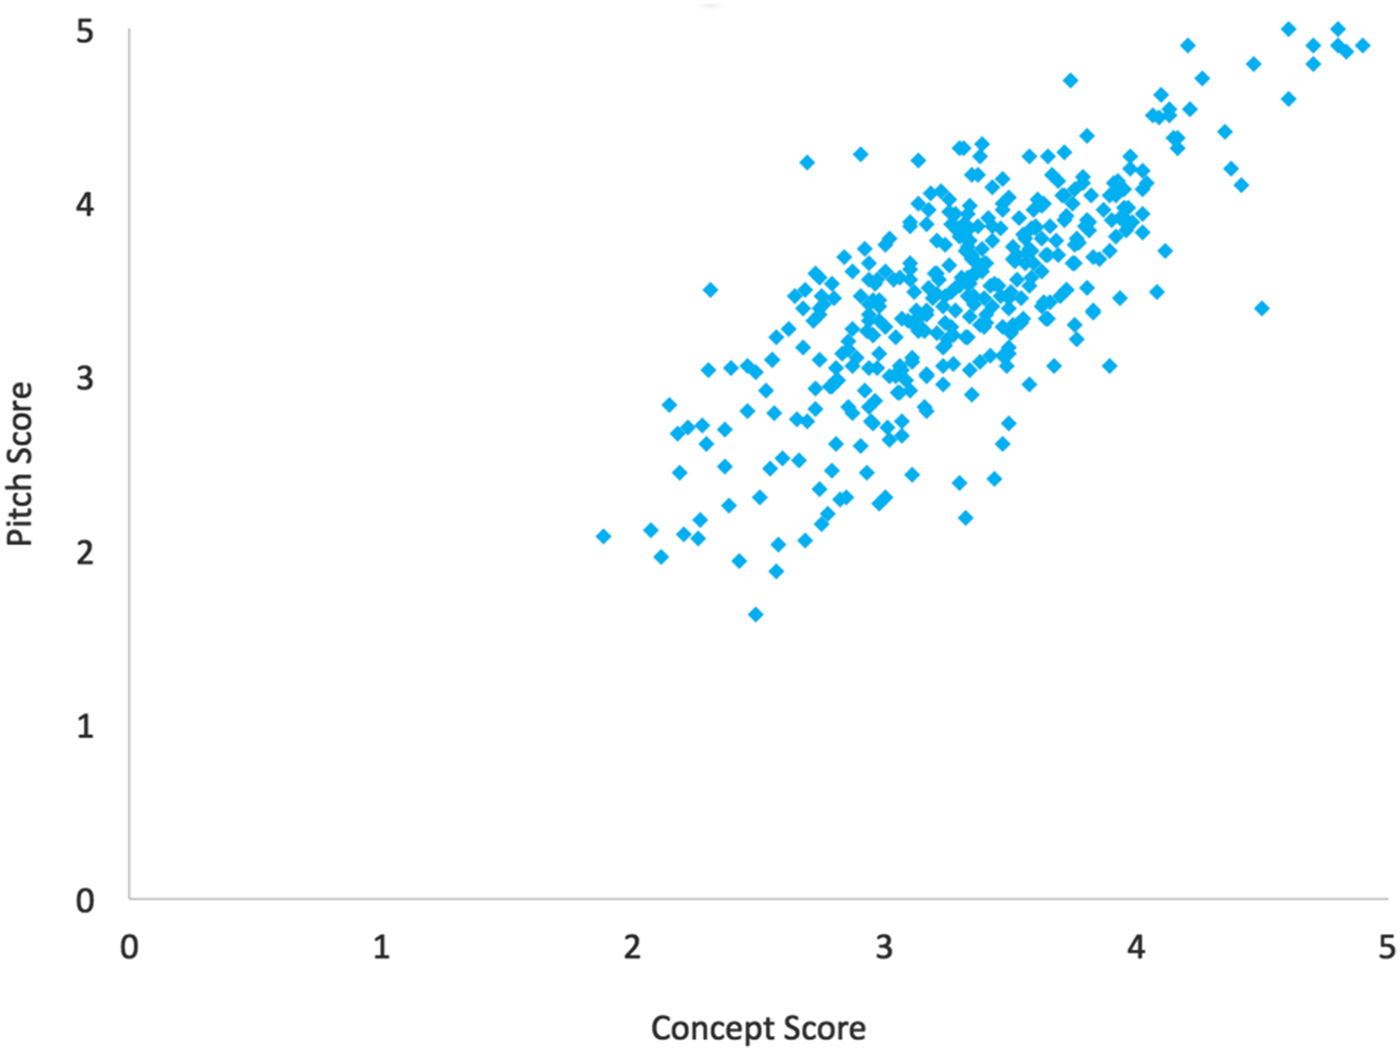
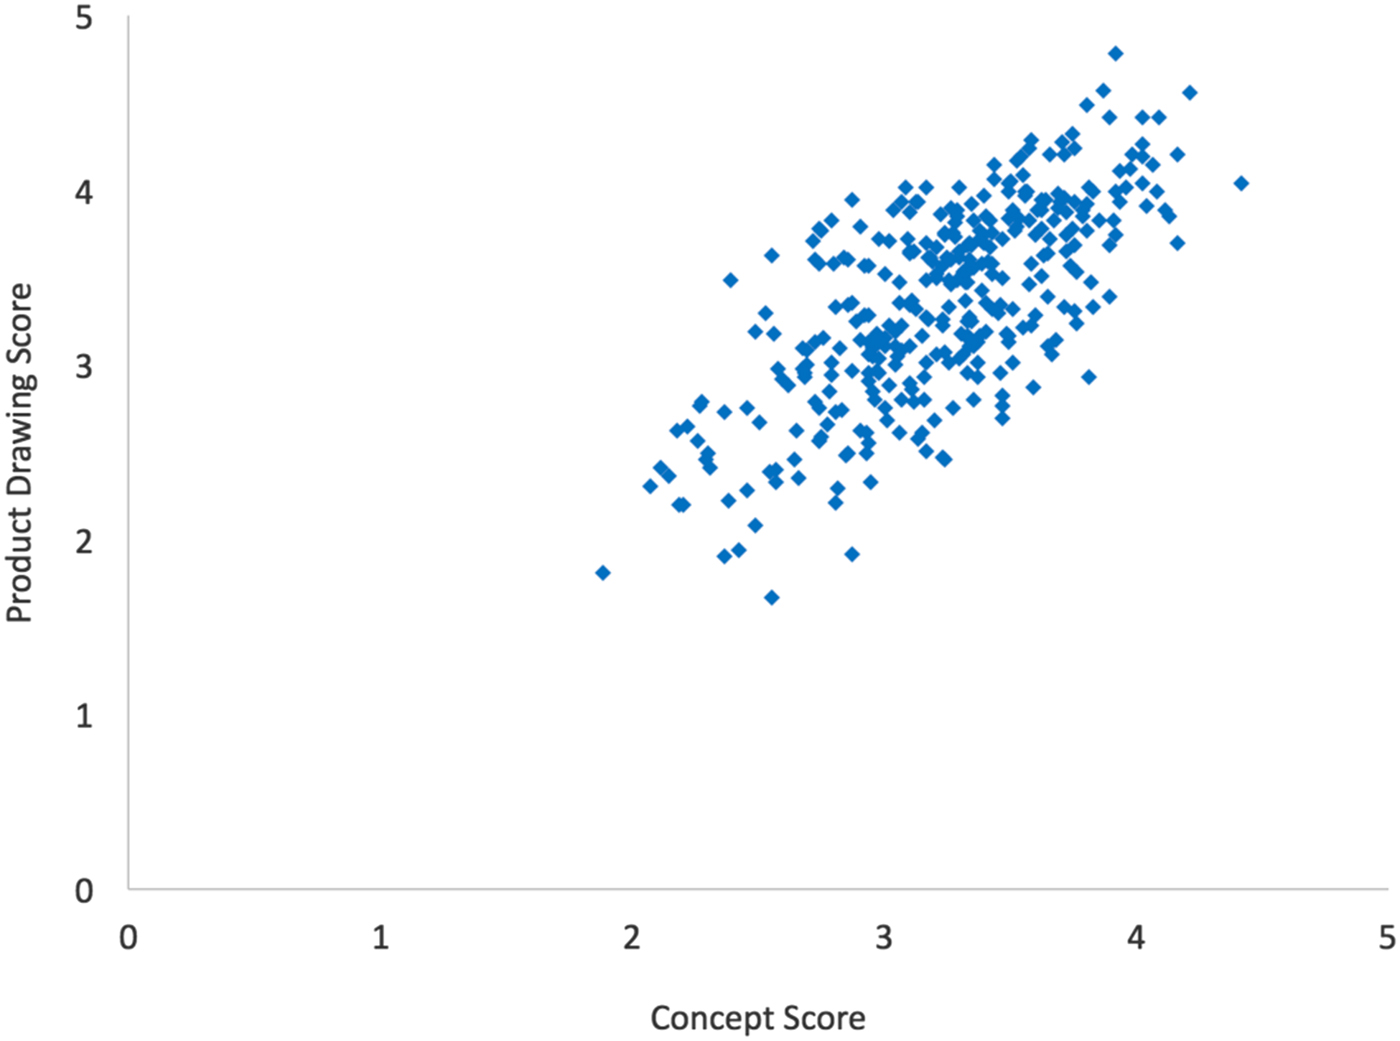
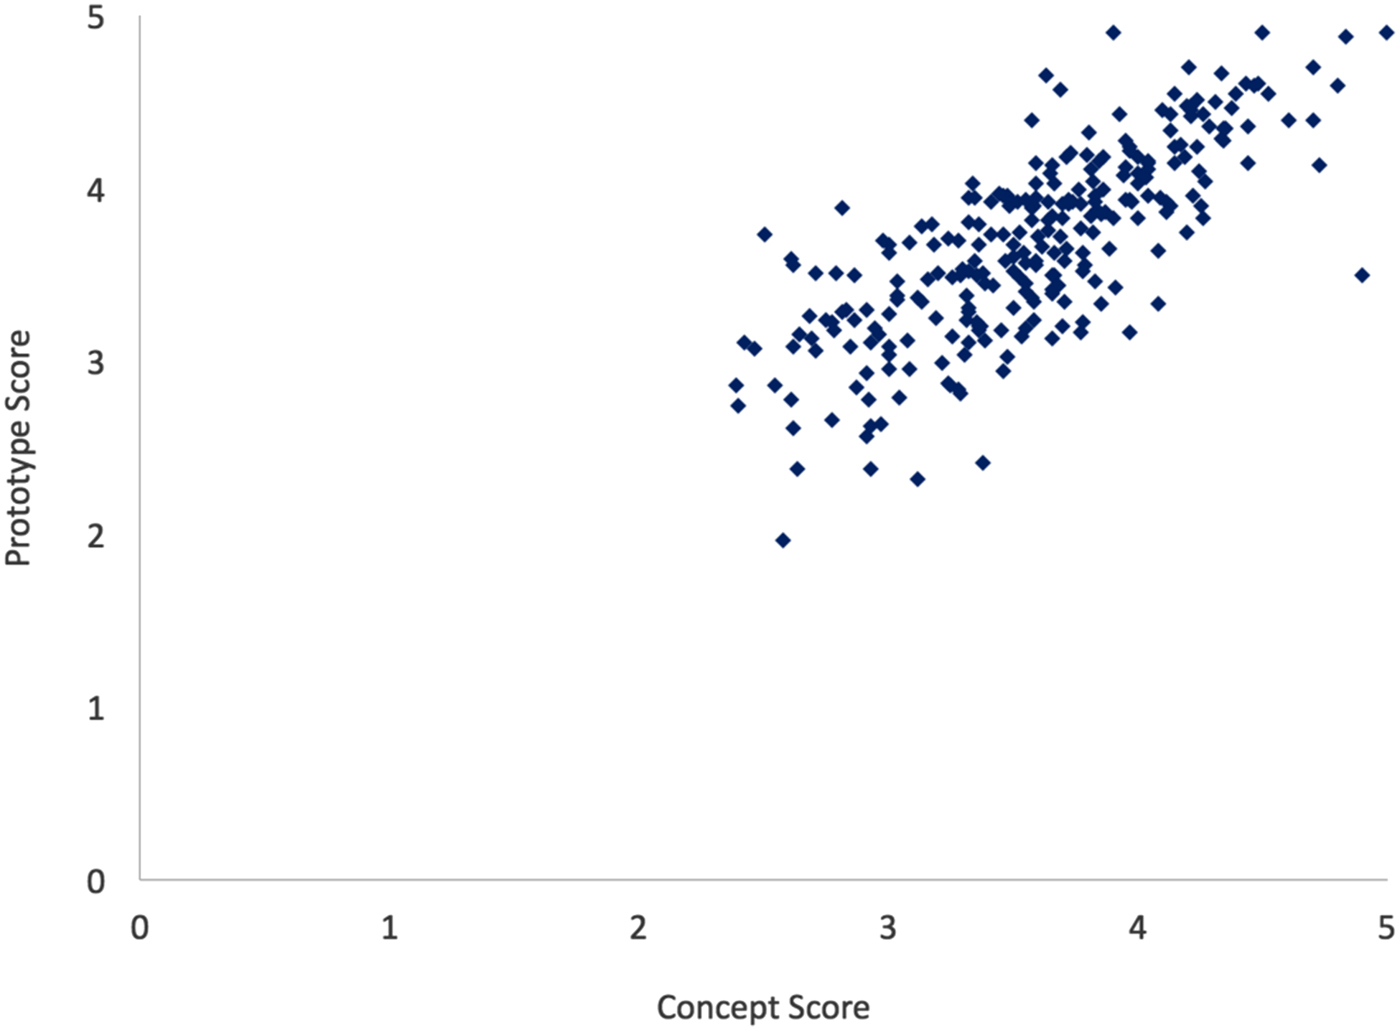
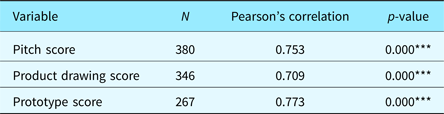
For analyses, all concepts, pitches, posters, and prototype scores were combined into one dataset. Three sets of data (2013 phase 1, 2013 phase 4, and 2014 phase 4) were on a 0–6 point scale and were converted to a 0–5 point scale. Then for each idea, the scores were averaged across all judges. Combining all phases of all years, there were 613 idea–presentation evaluations (613 concept scores, 380 pitch scores, 346 poster scores, 267 prototype scores). For hypothesis 1, a correlation analysis (Table 1) with plotting between concept score–pitch score, concept score–poster scores, and concept score–prototype scores was completed using SPSS (Figs. 5–7). For hypothesis 2, the prototype data were divided into the three phases (phase 2, 3, and 4) in which we specifically collected prototype scores across three stages of prototype evolution. Phase 2 had a total of 165 idea/prototype evaluations, phase 3 had 58, and phase 4 had 44 idea evaluations. The number decreases between phases as teams work on fewer prototypes at a higher resolution for each subsequent stage in the design process. For hypothesis 2, each phase's data were analyzed for a correlation. For the results report, we examined if there is a trend for R 2 values that changed from phase 1 to 4. We also conducted a regression analysis between score differences (presentation vs. concept) by phase, and these results are reported in the next section.
Correlation plot between pitch scores and concept scores.

Correlation plot between product drawing scores and concept scores.

Correlation plot between prototype scores and concept scores.

Correlation analysis for presentation types and concept score p-value

Dependent variable: concept scores.
*<0.1, **<0.05, ***<0.01.
Results
The analyses supported hypotheses 1a, b, and c. The correlation between concept scores (N = 613, M = 3.384, SD = 0.526) and pitch scores (N = 380, M = 3.476, SD = 0.605) was statistically significant (H1a). As the pitch scores increased, the concept scores increased, and Figure 5 shows a clear linear correlation between the two variables. This means that there was a high correlation between pitch scores and concept scores (Fig. 5).
The correlation between concept scores and product poster scores (N = 346, M = 3.361, SD = 0.561) was also statistically significant (H1b). The reviewers were likely to score the quality of the product posters and the value of the ideas similarly (Fig. 6).
A strong correlation was also found between the concept scores and the prototype scores of all phases (N = 267, M = 3.699, SD = 0.560), supporting our hypothesis (H1c). Figure 7 shows a scatterplot of the evaluations, forming a clear pattern, and a strong linear relationship between the two can be seen.
The summary of the analyses is found in Table 1. The correlation for all three variables was high, explaining more than half of the concept scores (p*** < 0.001).
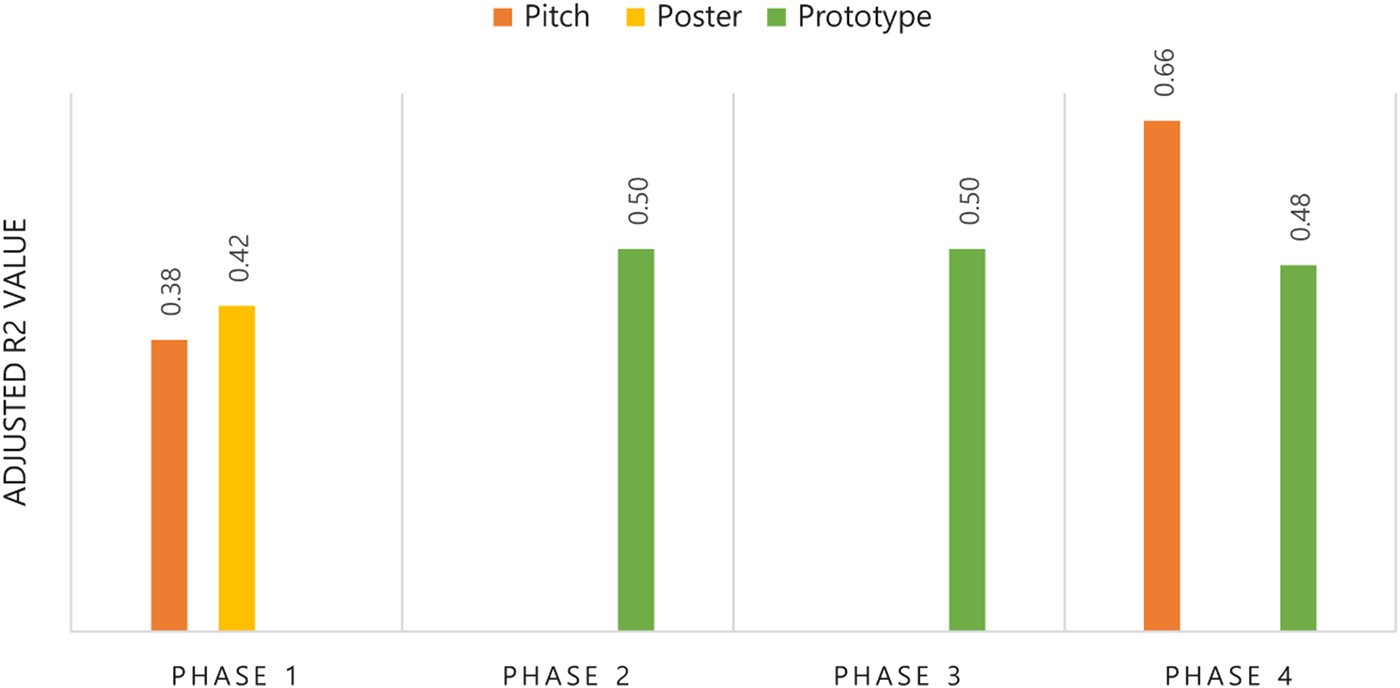
The analysis by the four phases of design did not support hypothesis 2 (see Fig. 8). No clear pattern was shown throughout the phases. Although we found a possible increase in pitch–concept score regression between phase 1 and 4, the score differences on phase 1 scores (concept and pitch) and phase 4 scores (concept and pitch) were statistically insignificant (p = 0.427).
Presentation–concept correlation change through different phases. **The prototype scores and concept scores correlation did not become stronger as the idea was refined. A possible trend in pitch–concept correlation was found (an increase from phase 1 to 4), but the increase of R 2 values between presentation–concept scores was statistically insignificant.

Discussion
The aim of our study was to see if the viewers could discriminate between the quality of presentation and the creativity of an idea. We found a high correlation between perceived quality of presentation and quality of the idea. Such a pattern was present in all three kinds of presentation: pitch, poster, and prototype. From our experimental design, we cannot claim that viewers are unable to discriminate between the quality of presentation and creativity of the idea; however, the data show that reviewers do score these items consistently similarly. The true cause of the correlation between the two variables is unknown. It could be true that many of the creative students are also more prepared for presentations and put more effort into posters and models. However, this explanation cannot account for team diversity over the years. Our study was conducted over 5 years with multiple groups. Randomly assigned teams produced the presentations and prototypes with individual members that may or may not have been creative or strong presenters. It is highly unlikely that creative teams are always excellent presenters, since team presentations qualities are often heavily influenced by team dynamics (Scott et al., Reference Scott, Tichenor, Bisland and Cross1994; Maldonado et al., Reference Maldonado, Lee, Klemmer and Pea2007; Georgiadis, Reference Georgiadis2014). The team dynamics will vary every time the teams are built. The chance that the most creative teams always have the team dynamics that yield the best presentation outcome is low. As a result, it seems reasonable that the judges are swayed by the presentation quality when evaluating the ideas.
Our second question was to see if this correlation between presentation quality and perceived idea quality changes as the ideas get more refined. If the ideas are more refined and the judges are able to understand the idea in more detail, then this correlation may change. The theory is (a) the correlation becomes stronger because judges will believe that the presented product would be closer to the final outcome, or (b) the correlation becomes weaker because judges will be able to understand the concept better, and thus it will be easier to evaluate presentation quality with complete independence from the perceived concept.
To see if the correlation changes, we examined if there was a change in correlation strengths as the ideas became more refined (from phase 1 to 4). We found no evidence that the correlation changes due to product development phase. In summary, we found an interesting correlation between perceived presentation quality and concept evaluations. We additionally looked at the pitch–concept correlation progress by the design phase. There was a possible trend, showing that the more refined the idea, the harder for the audience to separate pitch quality from idea quality. Yet, the trend was not statistically significant.
The findings agree with the previous literature on sketch quality and perceived idea creativity (Kudrowitz and Wallace, Reference Kudrowitz and Wallace2010). In prior works by Kudrowitz and Wallace (Reference Kudrowitz and Wallace2010, Reference Kudrowitz and Wallace2012), the highest quality of sketches induced the highest evaluation of the idea, regardless of the idea. Similarly, low-quality sketches received the lowest scores for the creativity of the idea, regardless of the idea. As an explanation for such findings, Kudrowitz and Wallace (Reference Kudrowitz and Wallace2012) suggested that high-quality sketches are more realistic. That is, the viewers were able to better imagine the final product from the high-quality sketches, and as a result, they were able to focus on the value of the idea (instead of interpreting the sketch in different ways).
However, the second part of our research demonstrated that this is not the case. The level of refinement and completeness of the visual presentations did not affect the correlation between presentation and the perceived value of the idea. The viewers were profoundly influenced by the prototype quality, whether the prototype was in its early or final stage. In summary, the audience tends to see the quality of a presentation and the quality of an idea in a similar way regardless of the idea and the completeness of the idea.
The implication of the results is critical in the product design and engineering fields. In the design process, pitching, sketching, and prototyping are popularly used in every stage of idea development. If the quality of such presentations (or representations) get in the way of evaluating the true value of the idea at certain stages, the risk of losing strong ideas is high.
The allegation of the main effect may also challenge the reliability of the CAT. In the CAT, ideas presented are often written, drawn, or prototyped. Yet, if the experts are heavily influenced by the quality of the sketches or the quality of the prototype, worthy ideas may be shadowed. Imagine the same mistakes made in the context of corporate R&Ds. The loss of good ideas due to weak presentations may result in millions of dollars and time lost.
The discussion of such human bias and errors in design evaluations is important in machine-learning and AI application in three aspects. First, we can discuss how to eliminate the errors and maximize the investment in “good ideas” through modifying AI's design selection processes. In a computational paradigm known as case-based reasoning (CBR), AI is used to analyze previous design data to construct reasoning for future design. The first step of CBR is to identify the problems in design process. The human tendency and risks associated with such tendencies can be encoded in CBR processing, thus improving overall design selection process of the AI. Secondly, we can discuss the use of AI to eliminate human errors. How can we teach AI to ensure all ideas to be presented with equal quality, so that humans can see through the actual value of the idea? Lastly, we can approach the topic from AI development perspective. If we are not trying to eliminate human errors, but in fact trying to design AIs to act more like humans, this study gives a more complete view of human decision-making processes.
This study is not without its limitations. The evaluation of each idea was based on the individuals’ subjective criteria, yet not much has been known about the variability of these criteria. One viewer may think a pitch is good based on the presenter's facial expression and hand gestures, while another viewer may think it is good based on the word choice and content. The use of which tool to evaluate the presentations by may impact the perception of idea quality. As a result, future research should focus on the actual elements that make the presentations more persuasive. The details regarding how these presentations were scored are somewhat vague. Each individual had his or her own criteria, but scholars agree that certain components are commonly considered as the “elements of good visual presentation” (Alvarez et al., Reference Alvarez, Baldonedo, Bear, Solis, Alvarez and Jorge2004; Eissen and Steur, Reference Eissen and Steur2007). For example, a recent study by Kudrowitz et al. (Reference Kudrowitz, Te and Wallace2012) implied that line work, perspective, and proportions may play roles in the perceived creativity of the sketch. Others demonstrated that the level of realism – or the fidelity – is important in prototype quality (Yang, Reference Yang2005). In addition, the number of judges varied across years and between phases, which may have impacted the results. Future research could control the number of judges, as well as their specific expertise.
Another limitation may be possible confounding factors. In analyses, we did not control possible confounding factors such as team's overall experience with presentation, gender, and design processes. It is highly unlikely that these factors influenced correlation between team presentation quality and idea quality, since (a) the data were collected over years, with hundreds of various students randomly assigned to groups, (b) all idea generation and presentation preparation were done in highly controlled classroom environment. Yet, we acknowledge that the baseline creativity and presentation skills of teams may have confounded the correlation.
Although we have found a statistically significant correlation between presentation quality and perceived concept quality, this study does not show the causal relationship between two factors. Future research can use manipulation design to uncover a causal relationship between people's perception of the presentation quality and the idea quality. If such study demonstrates clearly how presentation quality effects perceived idea quality, we may be able to look at the effect gradient (β) and tell how strong the influence is. More specifically, future studies can examine the β of lower dimensions in presentation quality that affects perceived idea quality (e.g., refinement of the visual aid, use of language, body gestures, eye contact, etc.). Such study can greatly help us understand the human internal value criteria when evaluating ideas.
Conclusion
In this section, we will re-evaluate the questions raised in the introduction.
1. Can the viewers discriminate between the quality of presentation and the value of the idea being presented? Our findings show that the viewers tend to rate the quality of a presentation and the quality of an idea in a highly correlated fashion. Such trend does not necessarily say that viewers cannot discriminate between presentation quality and creativeness of idea. However, it is also highly unlikely that the teams with great presentation skills are always the teams with greatest creativity. From our experiments, we can carefully suggest that the viewers tend to see good presentations as good ideas and good ideas as good presentations. Specifically in design, the execution of an idea is a critical part of the idea. This correlation was true for all presentation types, whether it was in oral pitch, poster, or prototype format, the higher the perceived presentation quality, the higher the perceived quality of the idea.
2. Do different kinds of presentations (oral pitch vs. poster vs. prototype) influence the perceived quality of the idea differently? As mentioned above, we found that the viewers tend to rate the presentation value and the creativity of concept with a high correlation, whether the presentation was a verbal pitch, sketch, or prototype. The strengths of the correlation were similar for these three types of presentation, showing no one significant format being more strongly correlated with the perceived idea creativity.
3. Is it more difficult for the viewers to discriminate between a presentation and the concept when the concept is more refined and close to realization? Our data analysis showed that the development phase did not influence the correlation. Whether the concept was in its early stage (sketch model), mid-stage (refined prototype), or later stage (final prototype), the viewers rated presentation and idea with a similar correlation.
From a metacognition perspective, one cannot convey an idea without some medium of presentation. Is it possible that the idea itself cannot be separated from the embodiment of the idea and thus the rating of the presentation is the rating of the idea?
Jieun Kwon Ph.D. Candidate in Human Factors and Ergonomics program at University of Minnesota, Twin-Cities, Minneapolis, MN. M.S. in Organizational Behavior at Seoul National University, South Korea. B.A. in Psychology and Visual Arts at Columbia University, New York, NY.
Barry Kudrowitz Land-Grant Associate Professor of Product Design at College of Design, University of Minnesota, Minneapolis, MN. Ph.D. Mechanical Engineering, Massachusetts Institute of Technology (MIT), MA. M.S. in Mechanical Engineering, Massachusetts Institute of Technology (MIT), MA.