I. INTRODUCTION
Carbon nanotubes (CNTs) have potential applications in many fields, e.g., as electron emitters in the field of emission display, scanning probe microscopy tips, sensors, etc.Reference Lee, Chung, Han, Kang, Choi, Kim, Park, Jin, Yi, Yun, Jung, Lee, You, Jo, Lee and Kim1–Reference Alwarappan, Prabhulkar, Durygin and Li4 CNTs can also be applied as fillers for polymer composites, because an addition of CNTs to polymer matrix improves mechanical properties of composite. As pristine nanotubes are insoluble in many liquids such as water and most solvents, it is difficult to disperse them in a polymer matrix. To make nanotubes more easily dispersible in liquids, functionalization processes are carried out. Functionalization results in the attachment of molecules or functional groups to CNTs’ sidewalls.
For the oxidative modification of CNTs, a gas- or liquid-phase oxidation method can be applied. Various acid agents, such as nitric acid (HNO3), HNO3 and sulfuric acid (H2SO4), perchloric acid (HClO4), H2SO4 and potassium dichromate (K2CrO7), H2SO4 and potassium permanganate (KMnO4) are used as oxidants in the liquid phase. Oxidation reactions generate functional groups, such as: −COOH, −OH, −C=O, and eliminate metal particles.Reference Osorio, Silveira, Bueno and Bergmann5–Reference Wang, Iqbal and Mitra8
Another method of CNTs’ functionalization is based on a modification of CNTs’ surfaces using halogens: fluorine or chlorine. Barthos et al.Reference Barthos, Méhn, Demortier, Pierard, Morciaux, Demortier, Fonseca and Nagy9 proposed the functionalization of single-walled carbon nanotubes (SWCNTs) in agate ball mill using alkyl halides, such as trifluoromethane, trichloromethane, tetrachloroethylene, and hexafluoropropene. For the sake of comparison, chlorination was also performed using chlorine gas. It was concluded that this method gives functionalized SWCNTs in the range of 0.3–3.5% wt% of fluorine and 5.5–17.5 wt% of chlorine and it was proved that liquid materials containing halogen are more effective as functionalizing agents than gases. Direct fluorination of CNTs was carried out using hydrofluoric acidReference Yin, Shen, Song and Jiang10 or fluorine gas.Reference Michelson, Chiang, Zimmerman, Boul, Lozano, Liu, Smalley, Hauge and Margrave11–Reference Hamwi, Alvergnat, Bonnamy and Béguin13 However, this process can lead to products that hardly allow any further reactions.Reference Michelson, Chiang, Zimmerman, Boul, Lozano, Liu, Smalley, Hauge and Margrave11 Chlorine addition to MWCNTs was performed by Kónya et al.Reference Kónya, Vesselenyi, Niesz, Kukovecz, Demortier, Fonseca, Delhalle, Mekhalif, Nagy, Koós, Osváth, Kocsonya, Biró and Kiricsi14 The authors reported that ball milling induces functionalization of MWCNTs in reactive atmospheres giving rise to formation of short CNTs containing different chemical functional groups, including chlorine. A method to purify MWCNTs involving chlorine water and ammonia water treatment was described in.Reference Yuan, Chen, Chen, Fan, Yang and Chen15 The authors indicated that catalyst particles, amorphous carbon and carbon particles were almost completely eliminated and some carboxyl group and C–Cl bonds were introduced. Functionalized CNTs with dichlorocarbene (CCl2)Reference Lee, Kim, Lee, Lee, Haddon and Reucroft16 and thionyl chlorideReference Wang, Iqbal and Malhotra17, Reference Dettlaff-Weglikowska, Benoit, Chiu, Graupner, Lebedkin and Roth18 can be converted with other chemical agents to add the corresponding functional group. Tang et al.Reference Yu, Zhang, Wang, Jiang, Liu, Wang, Wan and Tang19 used CNTs together with nickel oxide (Ni2O3) to reduce flammability of propylene.
In this article, we present a functionalization of CNTs’ surface using chlorination method, which enables a simultaneous purification of MWCNTs from metal impurities. Details regarding the influence of experimental conditions (liquid or gas phase) and in the case of the gas phase—the effect of temperature, on the removal degree of metal particles and the amount of chlorine is presented. A quantitative analysis of metal impurity content was validated by means of thermogravimetric analysis (TGA). The presence of chlorine species on the surface of chlorinated samples was confirmed by x-ray photoelectron spectroscopy (XPS).
The functionalized materials are scheduled to be applied as fillers for the preparation of polymer nanocomposites using the in situ polycondensation method. Accordingly, a sedimentation experiment was performed in ethylene and butylene glycol for checking the dispersibility of CNTs.
II. EXPERIMENTAL
Multiwalled carbon nanotubes (MWCNTs) were obtained by decomposition of ethylene on nanocrystalline iron at 700 °C. The detailed information about preparation of catalyst, experimental conditions for producing MWCNTs and their characteristics is described elsewhere.Reference Pełech20
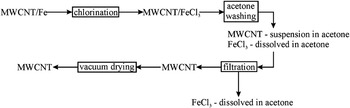
The chlorination processes were performed in the gas and liquid phase for 2 h. During gas chlorination, the sample was placed in the furnace and chlorine gas was supplied. Temperature of the process was kept at 50, 150, 250 and 450 °C. After 2 h, the supply of chlorine was cut off and the sample was cooled to the room temperature under vacuum. In the next stage, the samples were washed with acetone and distilled water several times and dried under vacuum at 120 °C.
During liquid-phase chlorination, the sample was placed in the flask filled with 100 mL of carbon tetrachloride (CCl4). The flask with the content was heated to the boiling point of CCl4. After 2 h, CCl4Reference Pang, Saxby and Chatfield21 was distilled and the sample was washed with acetone and distilled water several times, and then dried under vacuum at 120 °C.
The schematic representation of chlorination processes in gas and liquid phase is presented in Fig. 1.
The scheme of chlorination process.

The raw material and the chlorinated samples were ultrasonically dispersed in: ethylene or butylene glycol for 60 min. The concentration of all the samples was fixed to be 1 mg/mL.
The phase composition of the samples was determined using the x-ray diffraction method (XRD; X’Pert PRO Philips diffractometer) using a Cu Kα radiation. The morphology of carbon nanomaterials was studied using Transmission Electron Microscopy (TEM; JEOL JEM 3010). The iron percentage in the samples after chlorination process was determined using TGA, which was performed on DTA-Q600 SDT TA Instruments apparatus with the heating rate of 10 °C/min from room temperature to 900 °C in air. The x-ray photoelectron spectra were obtained using Mg Kα (hν = 1253.6 eV) radiation with a SES 2002 spectrometer operating at constant transmission energy (EP = 50 eV).
III. RESULTS AND DISCUSSION
MWCNTs were obtained on the nanocrystalline iron catalyst using ethylene as a carbon source at 700 °C. The details of the preparation and characterization of these structures are available in Ref. Reference Pełech20. The chlorination processes were performed in the gas and liquid phase. The processes in the gas phase were conducted at 50, 150, 250, and 450 °C, whereas chlorination in the liquid phase at the boiling point of CCl4. The raw material is hydrophobic and is not wettable with water. As a result, the treatment in aqueous solutions is very difficult. Therefore, the reaction was conducted in CCl4. CCl4 can also minimize the reaction between solvent and chlorine. So it can be assumed that the reaction will proceed only between chlorine and carbon material.
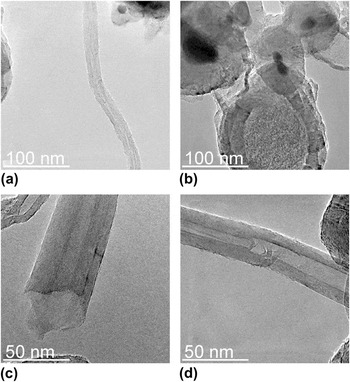
The morphology of carbon material after chlorination was investigated using TEM technique. The TEM images of the sample after chlorination at 150 and 250 °C are presented in Figs. 2(a) and 2(b) and Figs. 2(c) and 2(d), respectively. Generally, in the samples after the chlorination, the bamboo-like MWCNTs with external diameter in the range of 20–50 nm were still present [Figs. 2(a) and 2(d)]. During the chlorination process, the closed tips of CNTs were opened [Fig. 2(c)] due to the existence of carbon penta- and heptagons, which are less stable than carbon hexagons of CNTs.Reference Pang, Saxby and Chatfield21 As a result the metal catalyst’s particles embedded in the tip were eliminated. Some of CNTs had an empty inner core, but in the others a part of metal particles were found inside [Fig. 2(c)]. Besides CNTs, nanoparticles surrounded by graphitic layers above 100 nm in the diameters were observed [Fig. 2(b)]. Their walls were partially destroyed which led to the removal of metal particles. However, inside smaller nanoparticles (diameter about 50 nm) the catalyst particles were still observed.
TEM images of the samples after chlorination at 150 °C (a–b) and 250 °C (c–d).

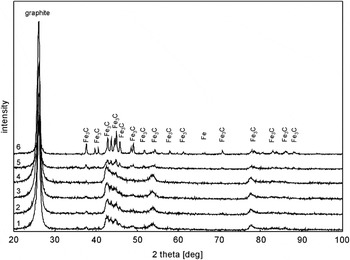
The phase composition of the samples after chlorination process was investigated using x-ray diffraction method. The spectra are presented in Fig. 3 (1–5). The diffraction pattern of a raw sample is presented in Fig. 3 (6). Additionally, diffraction reflexes coming from graphite (002) plane were measured in the narrow range. The interplanar distances and subsequently the graphitization degrees were determined using EquationReference Ermakova, Ermakov, Chuvilin and Kuvshinov22:

XRD spectra of the raw sample (6) and the samples after chlorination process in the gas phase at 50 °C (1), 150 °C (2), 250 °C (3), 450 °C (4), and in the liquid phase (5).

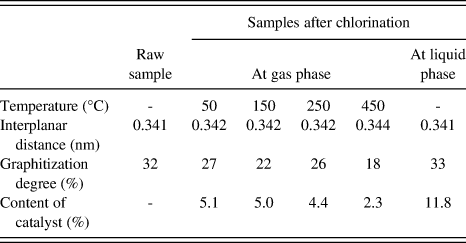
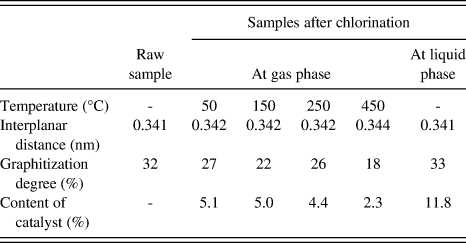
where: d hkl is the interplanar distance (nm), g is the graphitization degree (%). The calculated values of graphitization degrees are shown in Table I. In all the investigated samples the calculated interplanar distances were greater than those in the ideal graphite structure, i.e., 0.335 nm. In the raw sample, the graphitization degree was about 32% and in the sample after chlorination at liquid phase it was found to be 33%. The graphitization degree varied between 18% and 27% in the chlorinated samples (gas phase functionalization) and the lowest value was obtained for the sample treated at 450 °C. According to Ref. Reference Ermakova, Ermakov, Chuvilin and Kuvshinov22, if the value of the interplanar distance is equal to 0.335 nm, then graphitization degree equals 100%. The limiting value of interplanar distance is 0.344 nm. Above this value a disordered structure of carbon materials is obtained. The authors stated that the graphitization degree could be lower when the extreme curvature of graphite layers is present. Probably, in our case a lower graphitization degree was noticed because the bamboo-like MWCNTs were observed by TEM for the raw sampleReference Pełech20 as well as for the samples after chlorination [see Fig. 2(d)]. Moreover, the empty carbon capsules contained strongly damaged graphite layers [see Fig. 2(b)].
Interplanar distance, graphitization degree, and catalyst’s content for the sample before and after chlorination process.
From XRD analysis it was found that material after ethylene decomposition consisted of graphite phase, cementite and a small amount of iron particles. After chlorination, cementite is still observed and this resistance can be explained by the protective effect of graphite layers surrounding cementite nanoparticles. The same problem with a complete removal of cementite has been also observed during traditional purification using acids.Reference Pełech and Narkiewicz23
After chlorination cementite peaks become broader, which indicates that the experimental conditions could lead to a reduction of Fe3C agglomeration. Together with an increase of chlorination temperatures the intensity of graphite peak (002) increased. A similar dependence was observed by Chen et al.,Reference Yuan, Chen, Chen, Fan, Yang and Chen15 who noted that the diffraction intensity of the peaks at 25.952° increased dramatically after purification, which can indicate that the purity of MWCNTs improved and the crystal structure of MWCNTs remained unchanged as a result of purification.
Ferric chloride has not been identified in the samples. It was found that during the chlorination process in the liquid phase, the color of solution has been changed (from green to brown). This is indicative of the reaction of chlorine with iron particles producing iron (III) chloride, which is easily soluble in tetrachloride. After reaction in the gas phase, the presence of characteristic, dark green, shiny crystals of iron chloride has been established. The crystals of FeCl3 were easily dissolved in acetone during washing of material. Acetone changed color to dark red, what confirmed the dissolution of FeCl3.
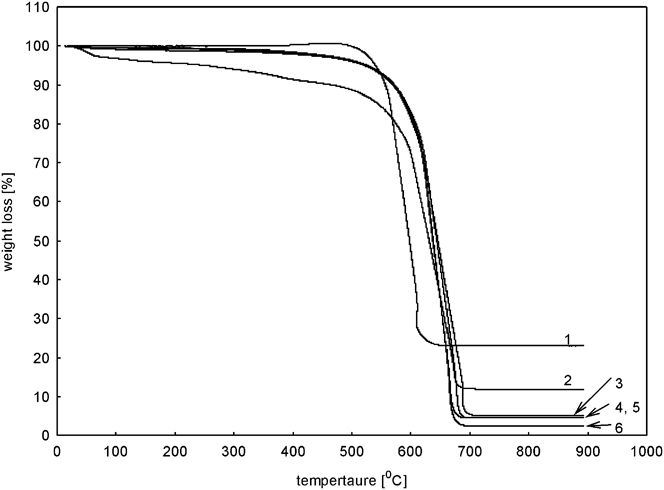
For determining the amount of metal particles that remained in the samples after the chlorination process, the material was investigated using a thermogravimetric method. The removal degree is presented in Table I and the TG curves in Fig. 4. It was found that the sample after chlorination at liquid phase contained about 11.8% of catalyst particles, whereas after chlorination in the gas phase the content of remaining catalyst’s particles was lower. There is practically no influence of the temperature of chlorination on the amount of catalyst in the samples. At the temperature of 50, 150, and 250 °C, a similar degree of removal was achieved in the range from 5.1% to 4.4%. Somewhat better results were obtained at 450 °C. The amount of catalyst in the sample was 2.3%.
TG curves of the raw sample (1), samples after chlorination in the liquid (2) and gas phase at 50 °C (3), 150 °C (4), 250 °C (5), 450 °C (6).
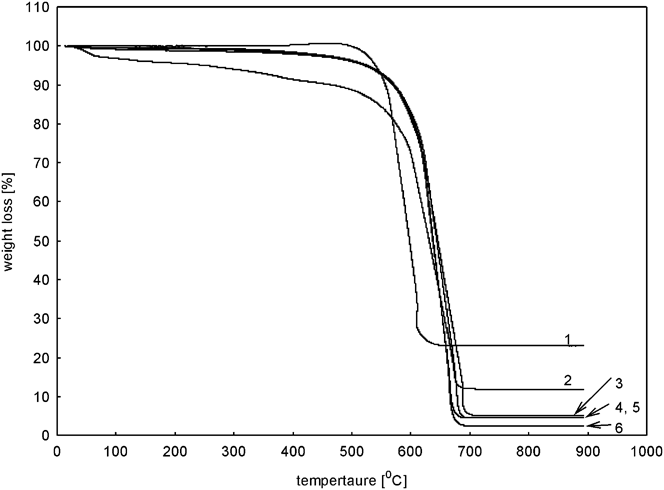
TG curves corresponding to the chlorinated samples (with the exception of the sample chlorinated at the liquid phase) exhibited an identical trend upon comparison with the raw sample and clearly show that the weight loss of the samples was stabilized at higher temperatures. This indicates that functionalized samples are more stable against oxidation than the samples before chlorination process. According to Barthos et al.Reference Barthos, Méhn, Demortier, Pierard, Morciaux, Demortier, Fonseca and Nagy9 the stabilization effect can be explained by the passivation of defect sites on nanotubes by the attached functional groups. Defect sites have smaller resistance and are attacked first by oxygen. However, the authors of Ref. Reference Dillon, Gennett, Jones, Alleman, Parilla and Heben24 stated that metal particles embedded in raw samples acted as oxidation sites and initiated oxidation reaction.
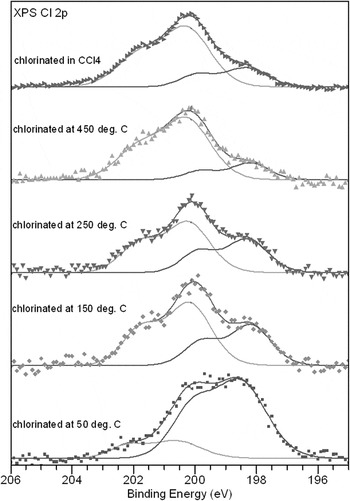
The XPS analysis revealed the presence of chlorine species on the surface of chlorinated samples. The XPS spectra of Cl 2p lines for the samples treated in gas in the temperature range between 50 and 450 °C as well as for the sample chlorinated in the liquid are shown in Fig. 5. Two components (each consisting of the 3/2 and 1/2 level with a spin-orbit splitting of 1.6 eV) are required to obtain a reasonable fit of the Cl 2p core level spectra. The binding energies of 3/2 components are 198.3 ± 0.2 eV and 200.3 ± 0.2 eV, respectively. The latter component corresponds well to chlorine atoms covalently bonded to sp 2 carbon.Reference Papirer, Lacroix, Donnet, Nansé and Fioux25–Reference Vasquez, Cruz, Olayo, Timoshina, Morales and Olayo27 The low-binding energy component at approx. 198.3 eV is in the range usually ascribed to chloride ions.Reference Moulder, Stickle, Sobol and Bomben28 However, there is a noticeable decrease in the relative intensity of low-binding energy component with the increase of treatment temperature. In the sample chlorinated in the gas phase at 50 °C the low-binding energy component at 198.3 eV amounts to about 80% of the total intensity of Cl 2p peak, whereas this component found in the spectrum for the sample treated at 450 °C equals to only 18% of Cl 2p peak intensity. It suggests that the chemical species corresponding to the low-binding energy component decomposed or desorbed with the temperature rise. Moreover, there is a lack of metal cations in the XPS spectrum, which suggests some other origin of the low-binding energy component. In the literature, the position of 198.0 eV is ascribed to the features associated with atomic chlorine adsorbed on the surface.Reference Piao, Adib and Barteau29 At higher temperature, part of the chlorine that is weakly bonded with the surface presumably desorbs, but the other part of covalently bonded chlorine remains in the material, which corresponds well with the above observations.
XPS Cl 2p lines for samples chlorinated under gas chlorine at temperatures 50, 150, 250, and 450 °C as well as for sample chlorinated in CCl4.

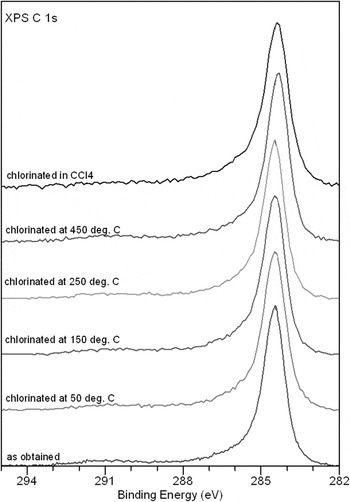
Chlorination of carbon-containing materials usually results in a pronounced change of XPS C 1s line.Reference Lee, Kim, Lee, Lee, Haddon and Reucroft16 In the present study, there is virtually no difference in the XPS C 1s spectra of untreated and chlorinated materials (Fig. 6). XPS C 1s line is positioned at 284.5 eV and corresponds well to the sp 2-hybridized carbon atoms and carbon atoms bonded to hydrogen, observed in nanocrystalline carbon materials.Reference Kónya, Vesselenyi, Niesz, Kukovecz, Demortier, Fonseca, Delhalle, Mekhalif, Nagy, Koós, Osváth, Kocsonya, Biró and Kiricsi14
XPS C 1s lines for nonchlorinated sample, for samples chlorinated under gas chlorine at temperatures 50, 150, 250, and 450 °C as well as for sample chlorinated in CCl4.

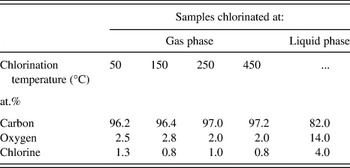
The quantitative analysis of the surface composition was performed for all samples. The obtained values are presented in Table II. It was found that the amount of chlorine for all the samples treated at gas phase was between 1.3 and 0.8 at.%. However with the increasing temperature of chlorination a slightly decreasing trend in chlorine concentration on the surface is seen. Higher concentration of chlorine was observed on the surface treated at liquid phase—4 at.%. It shows that the chlorination at liquid phase was probably quite efficient. Some previous reports indicate that chlorination of CNTs from the liquid phase is possible but very small amount of chlorine was incorporated into the carbon matrix. Chen et al.Reference Yuan, Chen, Chen, Fan, Yang and Chen15 introduced chlorine water and ammonia water to the treatment of CNTs. On the basis of energy-dispersive x-ray (EDX) spectra, they reported that some C–Cl bonds were introduced but the amount of chlorine element was very low and amounted to only 0.23%. After reaction with CCl2,Reference Lee, Kim, Lee, Lee, Haddon and Reucroft16 1.6% of chlorine atoms were detected, whereas in the case of sulfurochloridic acid (HSO3Cl) Reference Porro, Musso, Vinante, Vanzetti, Anderle, Trotta and Tagliaferro6 about 0.9%. Kónya et al.Reference Kónya, Vesselenyi, Niesz, Kukovecz, Demortier, Fonseca, Delhalle, Mekhalif, Nagy, Koós, Osváth, Kocsonya, Biró and Kiricsi14 used ball-milling method in the presence of the chlorine gas to obtain chlorine-functionalized tubes, but the quantitative analysis of functional groups is not presented in the publication. In that light of these reports, the present results show equal or even higher concentration of chlorine introduced into CNT substrate.
Surface composition of the samples after chlorination at gas and liquid phase calculated upon XPS data.

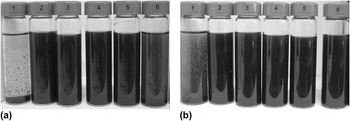
Functionalization of CNTs was carried out to improve the dispersion of CNTs in the polymer matrix. This is very important because, in case of problems with CNTs′ dispersion in polymer matrix, and formation of agglomerates of CNTs, these produce disadvantageous effect on the properties of nanocomposites so obtained. In our studies, nanofillers have been dispersed in monomers (diols).Reference Narkiewicz, Pełech, Rosłaniec, Kwiatkowska and Arabczyk30 Therefore, carbon material was mixed with ethylene or butylene glycol and its sedimentation was observed after 2 mo. Figure 7 shows images of the samples after 2 mo. of sedimentation experiment in ethylene [Fig. 7(a)] and butylene [Fig. 7(b)] glycol. The raw material fell on the bottom of the containers after 1 day in ethylene glycol and 10 days in butylene glycol while the samples after chlorination (regardless of a process temperature) formed a stable dispersion for a long time. Simultaneously it was observed that the sample chlorinated at the liquid phase settled after 3 days in ethylene glycol.
Dispersion of the raw sample (1), the samples after chlorination in the gas phase at 50 °C (2), 150 °C (3), 250 °C (4), 450 °C (5), and liquid phase (6) in ethylene (a) and butylene (b) glycol.

Carbon nanomaterials obtained in these studies will be tested as fillers to polymer nanocomposites prepared in a polycondensation reaction (in situ) in a poly(ether-ester) matrix.
IV. CONCLUSIONS
In this work, a simple chlorination method for a simultaneous removal of metal particles and introduction of a functional group onto the surface of CNTs is presented. It was found that chlorination in the gas phase is more effective than that in the liquid phase in respect of the catalyst removal. An increase of the reaction temperature led to a more efficient elimination of the catalyst’s particles. The ratio of the remaining catalyst was in the range from 2.3% to 5.1%. Using XPS method, the presence of chlorine species on the surface of chlorinated samples was demonstrated. The highest concentration of chlorine on the surface was achieved after liquid-phase chlorination. Modified samples formed a stable dispersion for 2 mo in ethylene and butylene glycol.
ACKNOWLEDGMENTS
The authors are grateful to Dr. E. Borowiak—Paleń (West Pomeranian University of Technology, Institute of Chemical and Environment Engineering) for the studies using High Resolution Transmission Electron Microscopy. This research was carried out under the funding of Polish Ministry of Science and Higher Education (NN 205 112 135).