Introduction
The rare earth elements (REE) are considered to be ‘critical’ because of supply risk and their importance in many high-tech industries, e.g. magnets in electric vehicles (Hoshino et al., Reference Hoshino, Sanematsu and Watanabe2016; Simandl et al., Reference Simandl, Simandl and Paradis2021). Deep-sea sediments enriched in REE have been reported from several regions in the Pacific and Indian oceans (e.g. Kato et al., Reference Kato, Fujinaga, Nakamura, Takaya, Kitamura, Ohta, Toda, Nakashima and Iwamori2011; Yasukawa et al., Reference Yasukawa, Liu, Fujinaga, Machida, Haraguchi, Ishii, Nakamura and Kato2014; Zhang et al., Reference Zhang, Tao, Shi, Li, Huang and Huang2017), attracting a great deal of attention as a potentially new REE source. The host minerals for Ce have been reported as Mn-Fe oxide (Toyoda and Masuda, Reference Toyoda and Masuda1991; Takahashi et al., Reference Takahashi, Shimizu, Usui, Kagi and Nomura2000) and clay minerals (Zhang et al., Reference Zhang, Tao, Shi, Li, Huang and Huang2017). The host minerals of REE other than Ce that have been reported from these deep-sea sediments are iron oxyhydroxide and phillipsite (Kato et al., Reference Kato, Fujinaga, Nakamura, Takaya, Kitamura, Ohta, Toda, Nakashima and Iwamori2011; Yasukawa et al., Reference Yasukawa, Liu, Fujinaga, Machida, Haraguchi, Ishii, Nakamura and Kato2014) and apatite (Kashiwabara et al., Reference Kashiwabara, Toda, Fujinaga, Honma, Takahashi and Kato2014; Kon et al., Reference Kon, Hoshino, Sanematsu, Morita, Tsunematsu, Okamoto, Yano, Tanaka and Takagi2014). Most published studies have reported that the main REE host mineral is apatite, which is biogenic in origin and which makes up fish debris (e.g. Wright et al., Reference Wright, Schrader and Holser1987; Kashiwabara et al., Reference Kashiwabara, Toda, Fujinaga, Honma, Takahashi and Kato2014; Kon et al., Reference Kon, Hoshino, Sanematsu, Morita, Tsunematsu, Okamoto, Yano, Tanaka and Takagi2014).
The International Mineralogical Association Commission on New Minerals, Nomenclature and Classification (IMA-CNMNC) report of Burke (Reference Burke2008) suggested tidying up names that used prefixes and so the three calcium-phosphate minerals, known as fluorapatite, hydroxylapatite/hydroxyapatite and chlorapatite, were renamed as apatite-(CaF), apatite-(CaOH) and apatite-(CaCl), respectively. In the published literature the terms used extensively to describe the mineral portions of bones and teeth of vertebrates are ‘carbonate-fluorapatite’ and ‘carbonate-hydroxylapatite’. The (CO3)2– anion is known to occur as a subordinate component in members of the apatite group (e.g. Knudsen and Gunter, Reference Knudsen and Gunter2002; Pan and Fleet, Reference Pan and M.E2002) and the general formula is represented as Ca10–a(PO4,CO3)6–b(OH,F,CO3)c (Kono et al., Reference Kono, Sakae, Nakada, Kaneda and Okada2022). The apatite supergroup nomenclature was reassessed by the IMA (Pasero et al., Reference Pasero, Kampf, Ferraris, Pekov, Rakovan and White2010) and the original extensively used terms fluorapatite, hydroxylapatite and chlorapatite were re-instated and are used here in this work. However, according to the IMA-CNMNC (Pasero et al., Reference Pasero, Kampf, Ferraris, Pekov, Rakovan and White2010) the validity of ‘carbonate apatite’ as a distinct mineral species belonging to the apatite group has been under question, and, after Burke (Reference Burke2008), both ‘carbonate-fluorapatite’ and ‘carbonate-hydroxylapatite’ were discredited.
Apatite found in teeth and bones incorporates REE in some geological environments. Generally, apatite, IXM14VIIM26(TO4)6X 2 (Z = 1), is known to incorporate rare earth elements (REE) due to the similarity between the number of M1 and M2 sites and the ionic radii of the REE (e.g. Hughes et al., Reference Hughes, Cameron and Mariano1991). In the case of REE substituting for M1 and M2 in apatite, the ratio of LREE (La to Eu) to HREE (Y and Gd to Lu) is not significantly different from the ratio in the environment (Reynard et al., Reference Reynard, Lécuyer and Grandjean1999), that is: LREE are generally more abundant in apatite because the amount of LREE in the environment is greater than that of HREE. Britholite-(Ce) of the apatite supergroup is also rich in LREE. However, it has been reported that the amounts of HREE and LREE found in apatite from fish debris from deep-sea sediments are nearly equal (Kon et al., Reference Kon, Hoshino, Sanematsu, Morita, Tsunematsu, Okamoto, Yano, Tanaka and Takagi2014). As REE in apatite of biogenic origin has been inferred to be formed from seawater, the abundance of REE may reflect the composition of deep-sea floor seawater. This seems reasonable if REE in apatite are considered to exist through substitution at Ca sites. Moreover, a high-resolution Z-contrast imaging in Transmission Electron Microscopy study of REE-rich mud from the central North Pacific Ocean indicated that REE substitute for Ca in hydroxylapatite (Liao et al., Reference Liao, Sun, Li, Sa, Lu, Lin, Xu, Zhan, Pan and Xu2019). When REE are present in apatite, they may exist in the structure through ionic substitutions, such as REE3+ + Na+ ↔ 2Ca2+ or REE3+ + SiO44– ↔ Ca2+ + PO43– (Ronsbo, Reference Ronsbo1989; Reynard et al., Reference Reynard, Lécuyer and Grandjean1999; Pan and Fleet, Reference Pan and M.E2002; Trueman and Tuross, Reference Trueman and Tuross2002; Hughes and Rakovan, Reference Hughes and Rakovan2015).
However, X-ray absorption fine structure (XAFS) spectroscopic analyses of REE-rich deep-sea sediments from the Pacific Ocean show that the REE in those sediments were adsorbed mainly onto apatite (Kashiwabara et al., Reference Kashiwabara, Toda, Fujinaga, Honma, Takahashi and Kato2014, Reference Kashiwabara, Toda, Nakamura, Yasukawa, Fujinaga, Kudo, Nozaki, Takahashi, Suzuki and Kato2018). As apatite in sediments can be enriched in REE as a result of degradation of other materials and apatite acts as a trace element sink for many elements, it adsorbs more REE compared to the surrounding sediment (Kohn and Moses, 2013). The REE contents in fish teeth are known to be variable and apatite in fish tooth enamel inhibits adsorption into the tissue because of its lower porosity and well-grown crystals compared to dentine and bone, whereas apatite in dentine readily absorbs REE (Toyoda and Tokonami, Reference Toyoda and Tokonami1990). Thus, the occurrence of REE in apatite should be considered carefully. Moreover, the question of whether substitution or adsorption is the more effective mechanism for REE concentration in apatite from deep-sea sediments remains unresolved.
The relationship between carbon and REE in biogenic apatite found in fish debris from deep-sea mud has not been discussed, but carbon may be involved in the substitution of REE in apatite, e.g. via the reaction Ca2+ + P5+ ↔ REE3+ + C4+ (Anenburg et al., Reference Anenburg, Panikorovskii, Jennings, Shendrik, Antonov and Gavrilenko2024). In addition, REE adsorption on organic matter, which is a constituent of the apatite of biogenic origin, should also be considered. Therefore, the quantity of carbon within apatite in the REE-rich mud, which has not been investigated systematically, may help to identify its important role in the concentration of REE within apatite in REE mud.
In the present study, the authors investigated the mode of occurrence of REE-bearing apatite in the teeth and bone from fish debris of the Japanese Exclusive Economic Zone around Minami-Tobishima Island; they analysed the abundance and distribution of REE in teeth and bone debris focusing, in particular, on the REE-concentrated apatite in the bone debris, which is known to contain more REE than tooth enamel. In addition, the role of C in the enrichment of REE in the bone debris, which has been overlooked in previous studies, was also examined. The study was performed using REE-extraction experiments, FE-EPMA, TEM-EDX, LIBS, FTIR and XANES analysis.
Experimental methods
In the present study, inductively coupled plasma mass spectrometry (ICP-MS) was used to quantify the concentrations of ion-exchangeable elements in apatite and elements that were released by dissolution of apatite in the deep-sea mud samples. The chemical compositions, element distributions and internal textures of teeth and bone debris were examined using FE-EMPA and HR-TEM with EDX. To select REE-rich samples for HR-TEM and LIBS, REE abundances were analysed in fish debris samples using micro X-ray fluorescence (micro-XRF) spectrometry. To investigate the relationship between C and REE contents, we used LIBS analysis and element-distribution maps by EPMA. To evaluate the relative proportions of REE contained within the apatite crystal structure and those adsorbed onto the surface of apatite grains, the authors used XANES analyses of the fish debris. Yttrium (Y) is the most abundant REE in our samples and a useful indicator due to its similar chemical properties and geochemical behaviour to HREE, as well as its relative abundance. Therefore, in this study, Y was measured as a representative of HREE in each analysis.
Sample preparation
In the present study, we investigated the fish debris in the REE-rich mud collected from the deep sea, ∼1900 km southeast of Tokyo within the Japanese Exclusive Economic Zone around Minami-Torishima Island as part of a project conducted by the Japan Organization for Metals and Energy Security (JOGMEC). The deep-sea mud samples in the present study are the same as those of Kon et al. (Reference Kon, Hoshino, Sanematsu, Morita, Tsunematsu, Okamoto, Yano, Tanaka and Takagi2014), who extracted five fractions (KS-1 to KS-5) from the REE-rich unconsolidated mud, collected from a few metres below the surface of the unconsolidated deep-sea mud. The mud samples were sieved to 70–200 μm grain size and washed to remove all mud. The fish debris made of apatite was then picked from the washed mud samples. These samples do not exhibit sufficient crystallinity to be considered fossilised.
The selected fish debris samples were mounted using plastic resin (Petropoxy) and polished with alumina polishing paper for microscopic observation and EPMA. The samples for LIBS analysis were mounted directly onto sample holders using double-sided adhesive tape to avoid carbon contamination. The absence of interference with the tape was confirmed using quartz of similar size to the samples. For TEM observation and XANES analysis, REE-rich apatite with an irregular shape and tooth-shaped REE-poor apatite were separated manually. The apatite grains selected were crushed and placed on sample holders.
Extraction experiments
Extraction experiments were carried out to determine the state of existence of REE. Elements adsorbed on the mineral surface were examined using (NH4)2SO4, whereas elements dissolved from apatite were examined using HCl. Single-step extractions of REE with (NH4)2SO4 and HCl reagents (Table 1) were performed in the laboratory of the Geological Survey of Japan (GSJ) in Tsukuba.
Experimental conditions for the two single-step REE extraction methods

Extraction with ammonium sulfate
The REE-rich deep-sea mud samples were dried at room temperature to allow evaporation of water until there was no change in weight. Individual 5 g samples were then soaked in 40 mL of 0.5 M (NH4)2SO4 solution (pH 5.7) in a 50 mL centrifuge tube. The centrifuge tubes were agitated mechanically at room temperature for 24 h to allow sufficient time for the sample to react with the solution. Solids were extracted from the solution by centrifugation at 2000 rpm for 15 min in a 50 mL centrifuge tube. The solution was then filtered through a cellulose acetate membrane filter (φ = 0.45 μm) and the filter was rinsed repeatedly in 50 mL of ultra-pure water.
Extraction with hydrochloric acid
Individual 5 g samples were soaked in 40 mL of 0.5 M HCl in a 50 mL centrifuge tube. The centrifuge tubes were then shaken mechanically at room temperature for 3 h to allow sufficient time for the sample to react with the acid.
The elemental composition of the REE-rich sea-mud samples before and after the extraction was measured and the percent extracted was calculated from the difference between the two. As it was difficult to recover all the samples after the extraction, it was assumed that the TiO2 concentration was constant before and after the extraction. The elemental composition of the samples was measured using the following procedure.
For the whole-rock analyses of major- and trace-element compositions, fused glass-beads (1:10) were prepared by mixing 0.5 g of sample powder with 5.0 g of lithium tetraborate (Li2B4O7, Spectromelt A10) flux. The sample and lithium tetraborate mixture was heated to 1200°C in a 95% Pt and 5% Au crucibles using an automated high-frequency bead sampler (HAG-M-HF, Herzog Co. Ltd.).
Major and trace elements were analysed using XRF spectrometry (ZSX Primus III+, Rigaku Corp.) and laser-ablation ICP-MS (LA-ICPMS) at GSJ, respectively. A quadrupole-based ICP-MS (Agilent 7500cx) was connected with the in-house laser ablation system (IFRIT, Cyber Laser Inc.), based on a 230 femtosecond Titanium-Sapphire regenerative amplifier system operating at a third harmonic generation (THG) wavelength of 260 nm. Further information about this glass-bead ablation method has been given by Kon and Hirata (Reference Kon and Hirata2015).
Electron probe microanalysis
Compositional analyses of the fish debris samples were performed using a JEOL JXA-8530F EPMA at GSJ. The equipment was operated at an accelerating voltage of 15 kV with a 20 nA beam current and 2 μm beam diameter. The standard materials used are apatite for Ca (CaK α1) and P (PK α1), celestine for Sr (SrL α1) and S (SK α1) and albite for Na (NaK α1) and Si (SiK α1). Other standard materials are synthetic hematite for (FeK α1), manganese-ferrite for Mn (MnK α1), periclase for Mg (MgK α1), tugtupite for Cl (ClK α1), fluorite for F (FK α1), synthetic YP5O14 for Y (YL α1), LaP5O14 for La (LaL α1) and CeP5O14 for Ce (CeL α1), respectively. The ZAF method was used for data correction.
Element-distribution maps were obtained under the same accelerating voltage and beam current. These images were analysed using a wavelength-dispersive spectrometer on an EPMA at the beam diameter of 1 µm. Alumina was used for polishing the sample, and gold was used for coating.
Laser-induced breakdown spectroscopy
For LIBS analysis, the teeth and bones were separated and mounted directly on tape to avoid carbon contamination. Semi-quantitative analyses of Y and C were performed with a J200 LIBS (Applied Spectra Inc.) equipped with a 266 nm Nd:YAG laser at Gem Research Japan Inc. The laser pulse energy was 5 mJ at 10 Hz, with beam diameter of 50 µm. Helium gas was used for ablation at a flow rate of 0.8 L min−1. The laser-induced spectra were counted using six-channel CCD detectors. For every laser shot, full spectra were recorded over wavelengths from 185 to 1051 nm. Gate delay and gate width were 2 μs and 1.05 ms, respectively. Carbon and yttrium emission spectra were observed at wavelengths of 247.86 and 324.23 nm, respectively.
Fourier-transform infrared spectroscopy
Fourier-transform infrared spectroscopy was conducted using a JASCO FT/IR-6600 instrument equipped with an ATR PRO ONE (JASCO Corporation), installed at the Faculty of Textile Science and Technology, Shinshu University. Infrared radiation was supplied by a standard light source and detection was achieved using a mercury cadmium telluride (MCT) detector. The FTIR spectra were measured in transmission mode, covering a wavenumber range of 4000–500 cm⁻1 with a resolution of 4 cm⁻1. A total of 64 scans was averaged to obtain spectra. Prior to data interpretation, the FTIR spectra were corrected for ATR effects and atmospheric interferences including H₂O and CO₂ using the instrument’s built-in correction algorithms. The selected apatite grains were crushed into powder and mounted on the high-efficiency diamond prism (PDK-D1) for analysis.
High-resolution transmission electron microscopy
The HR-TEM examinations of the samples were performed using an FEI Tecnai Osiris system operated at 200 kV and equipped with EDX and a high-angle annular dark-field scanning transmission electron microscopy (HAADF-STEM) system with a probe diameter of ∼1 nm. The element-distribution maps of Y, P and Ca by EDX were obtained using their Kα peaks.
X-ray absorption near-edge structure analyses
The XANES spectra of REE-bearing apatite in the teeth and bone debris were collected using the BL01B1 beamline at SPring-8, Hyogo, Japan. The white beam from the bending magnet was monochromatized with a Si (111) double crystal monochromator with a Rh-coated mirror for collimation, focusing and harmonic rejection. The intensities of incident and transmission X-rays were monitored with ionization chambers both upstream and downstream of the samples, and fluorescence X-rays were monitored with a 19-element Ge solid-state detector placed at 90° to the incident X-rays. To compare the Y K-edge XANES spectra of the REE-bearing apatite in the teeth and bone debris with those of the reference materials, all spectra were normalised by setting the absorbance at 17,000.5 eV to zero and that at 17,200.5 eV to one. The REE-bearing reference samples are: (1) YPO4 precipitates obtained from a mixture of two aqueous solutions containing equal amounts of phosphate ions (0.20 M) and Y3+ ions (0.20 M), respectively, at pH 7; (2) xenotime obtained from Pear Ridge, Texas; (3) Y3+ adsorbed on apatite (hexagonal) obtained by adding 10 mL of a Y3+ solution (200 ppm) to 100 mg of synthetic hydroxylapatite; and (4) Y3+ co-precipitated with apatite was obtained by mixing a CaCl2 solution containing Y3+ (Y/Ca molar ratio = 0.002) and a NaH2PO4 solution at a constant Ca/P molar ratio (= 1.67) at pH 11.
Results
Extraction experiments
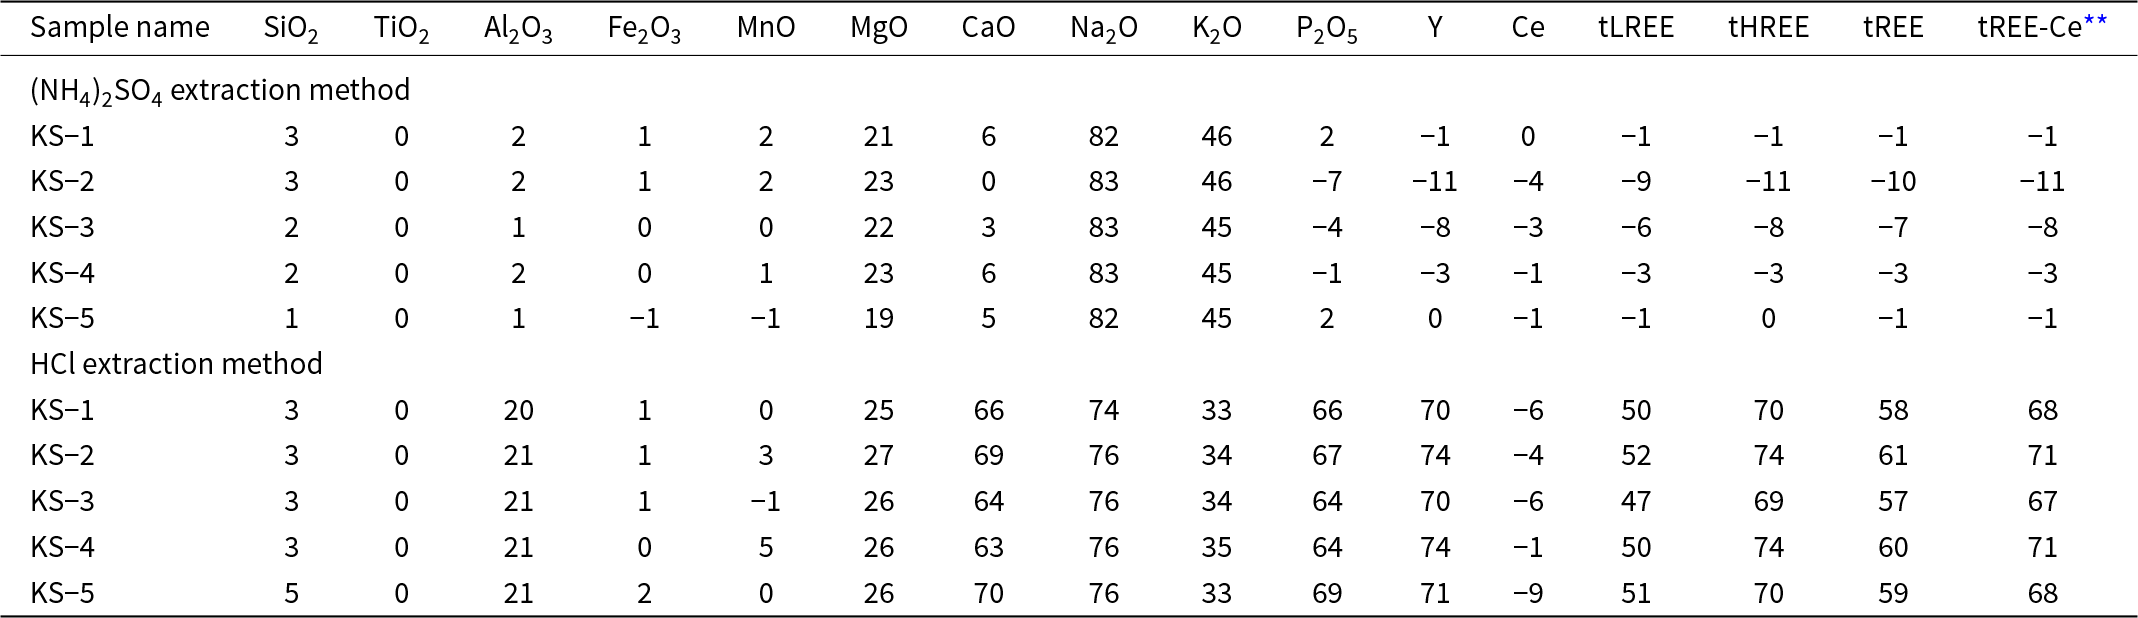
The extraction percentages for samples KS-1 to KS-5 of Kon et al. (Reference Kon, Hoshino, Sanematsu, Morita, Tsunematsu, Okamoto, Yano, Tanaka and Takagi2014) are listed in Table 2. For the experiment using (NH4)2SO4 as the reagent, the percent of total REE extracted is zero, implying that there were no ion-exchangeable REE in the REE-rich mud. In contrast, for the extraction experiments using HCl reagents, the amount of Ca and P extracted are 63–70% and 64–69%, respectively, and those for total REE are 57–61%, suggesting that the REE were extracted from fish debris. The extraction of Fe2O3, MnO and Ce are low for these two reagents, as Ce contents in Mn-Fe oxides are typically high.
Elements extracted (%) from apatite in the REE-rich mud using the two different methods*

* Calculated as: Extraction percent of element X = (Original X Conc. – Residual X Conc.)/Original X Conc. × 100. Any negative values are attributed to measurment errors, as the values before and after extraction are nearly identical
** Total LREE less Ce
Examination of the morphology of apatite
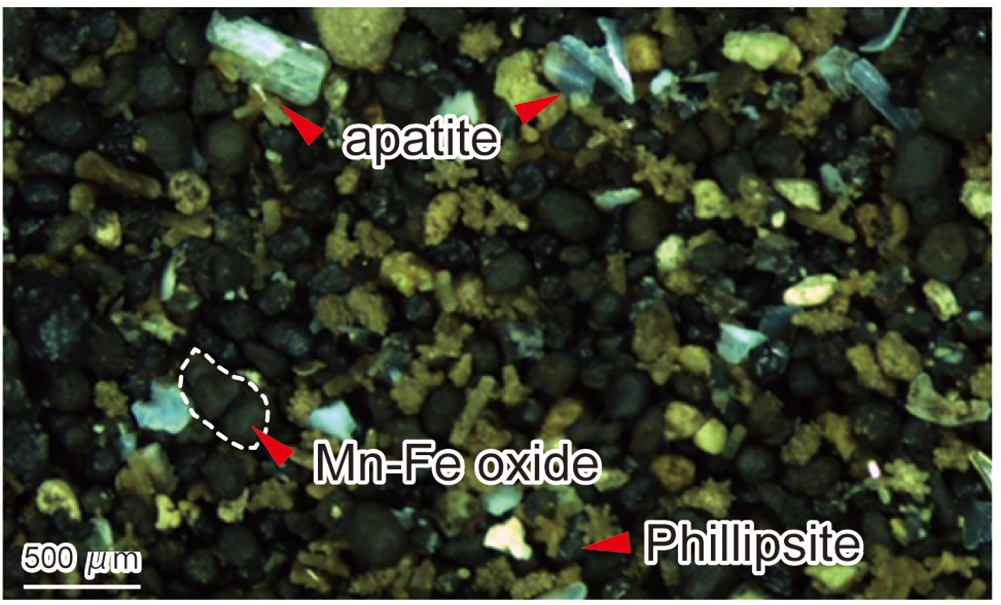
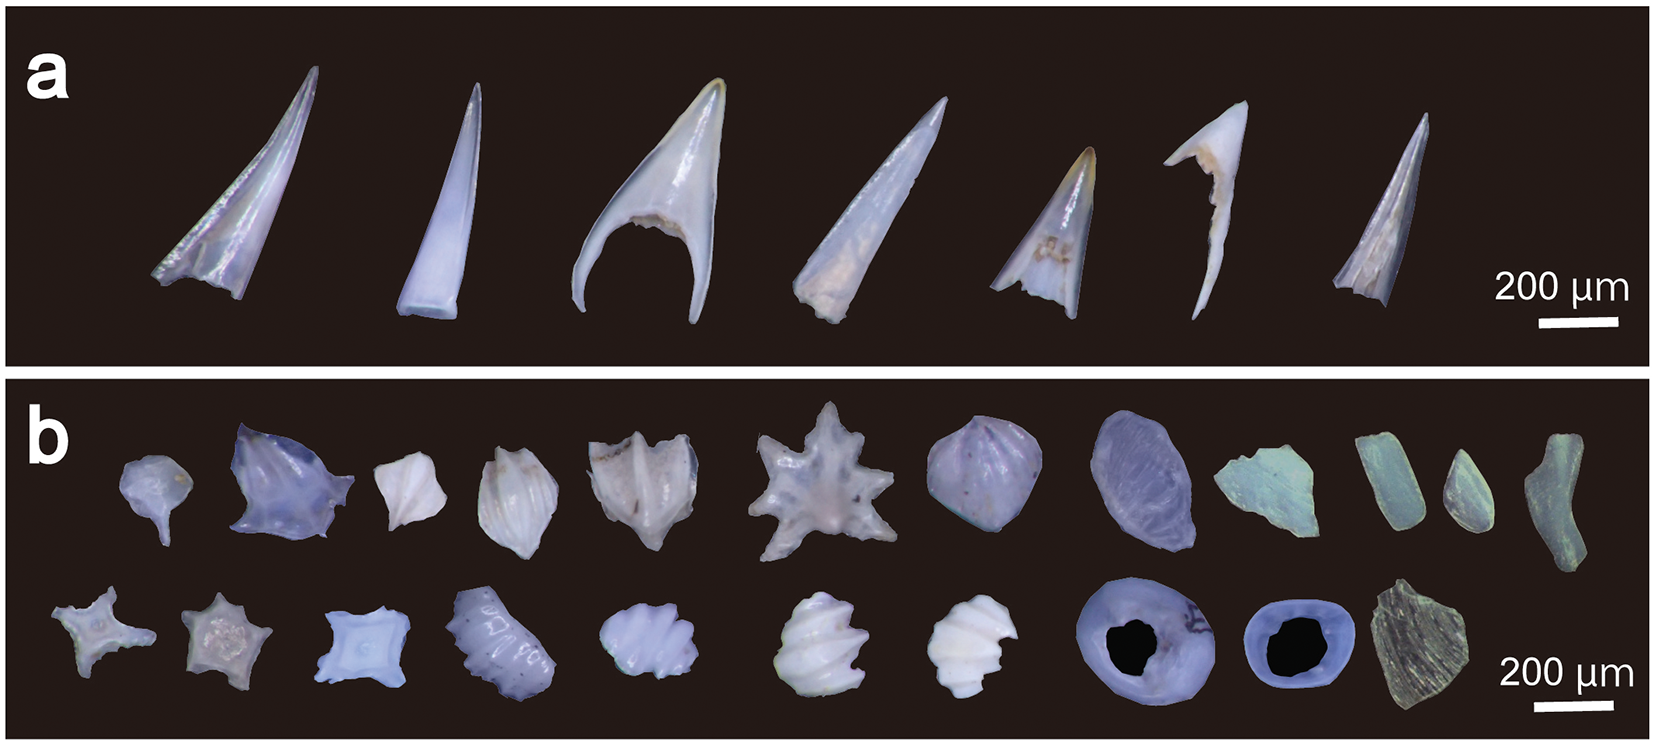
The REE-rich deep-sea muds are mainly composed of apatite, Mn-Fe oxide, euhedral phillipsite and clay minerals (Fig. 1). Fragments of fish debris with fang-like morphology are classified as teeth (Fig. 2a), and those of other complex forms as bone debris (Fig. 2b). These fragments are transparent, white, or pale yellow in colour. A lot of the fish debris is enclosed by Mn-Fe oxide (Fig. 1).
Photomicrograph of the residue of a washed (mud-free) sample of REE-rich deep-sea mud from the Minami-Torishima area. The dashed white line shows the outline of the Mn-Fe oxides.

Stereomicroscope images of apatite picked from the washed REE-rich deep-sea mud: (a) teeth, (b) bone fragments. Images captured under reflected light using a binocular microscope.

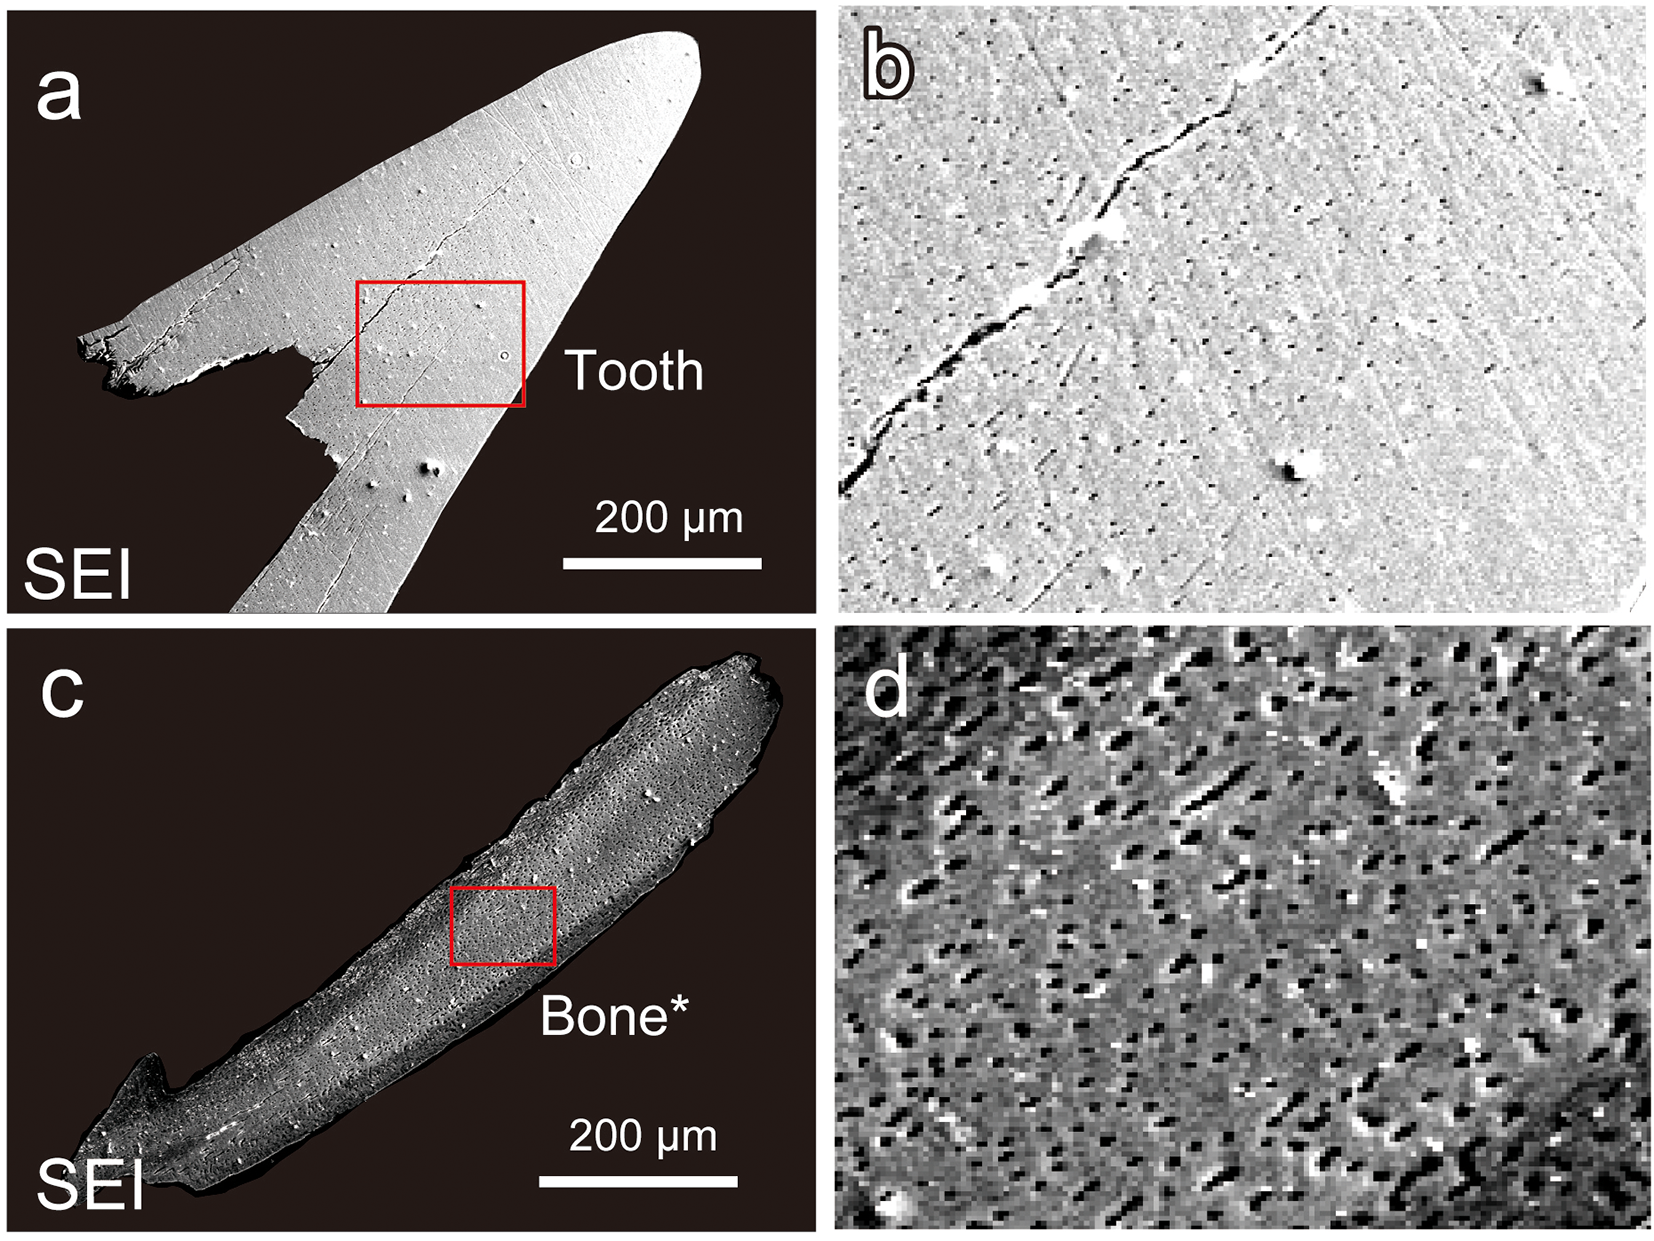
Under an optical microscope, the teeth appear to be dense and massive (Fig. 3a). However, high-magnification SEM examination showed that the fish teeth are more porous towards the interior (Fig. 3b). In contrast, the fish bones appear to be porous throughout (Fig. 3c, d).
Secondary electron images of a tooth (a, b) and of a bone fragment (c, d). Parts b and d are enlargements of the red-boxed areas in parts a and c, respectively.

EPMA of fish teeth and bone debris
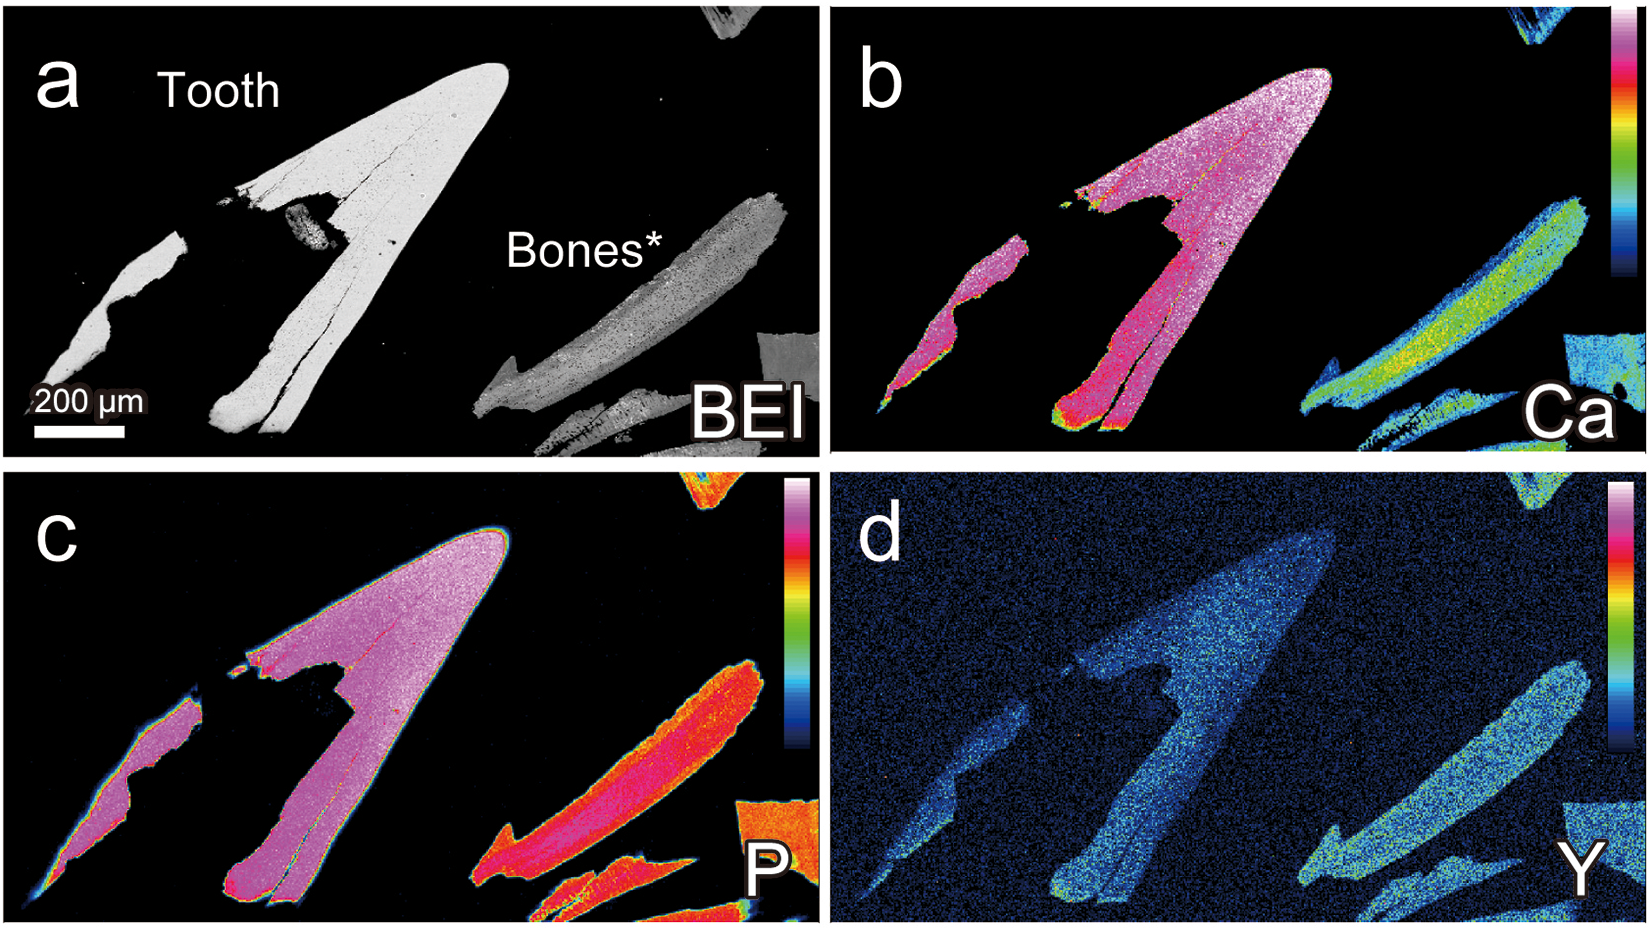
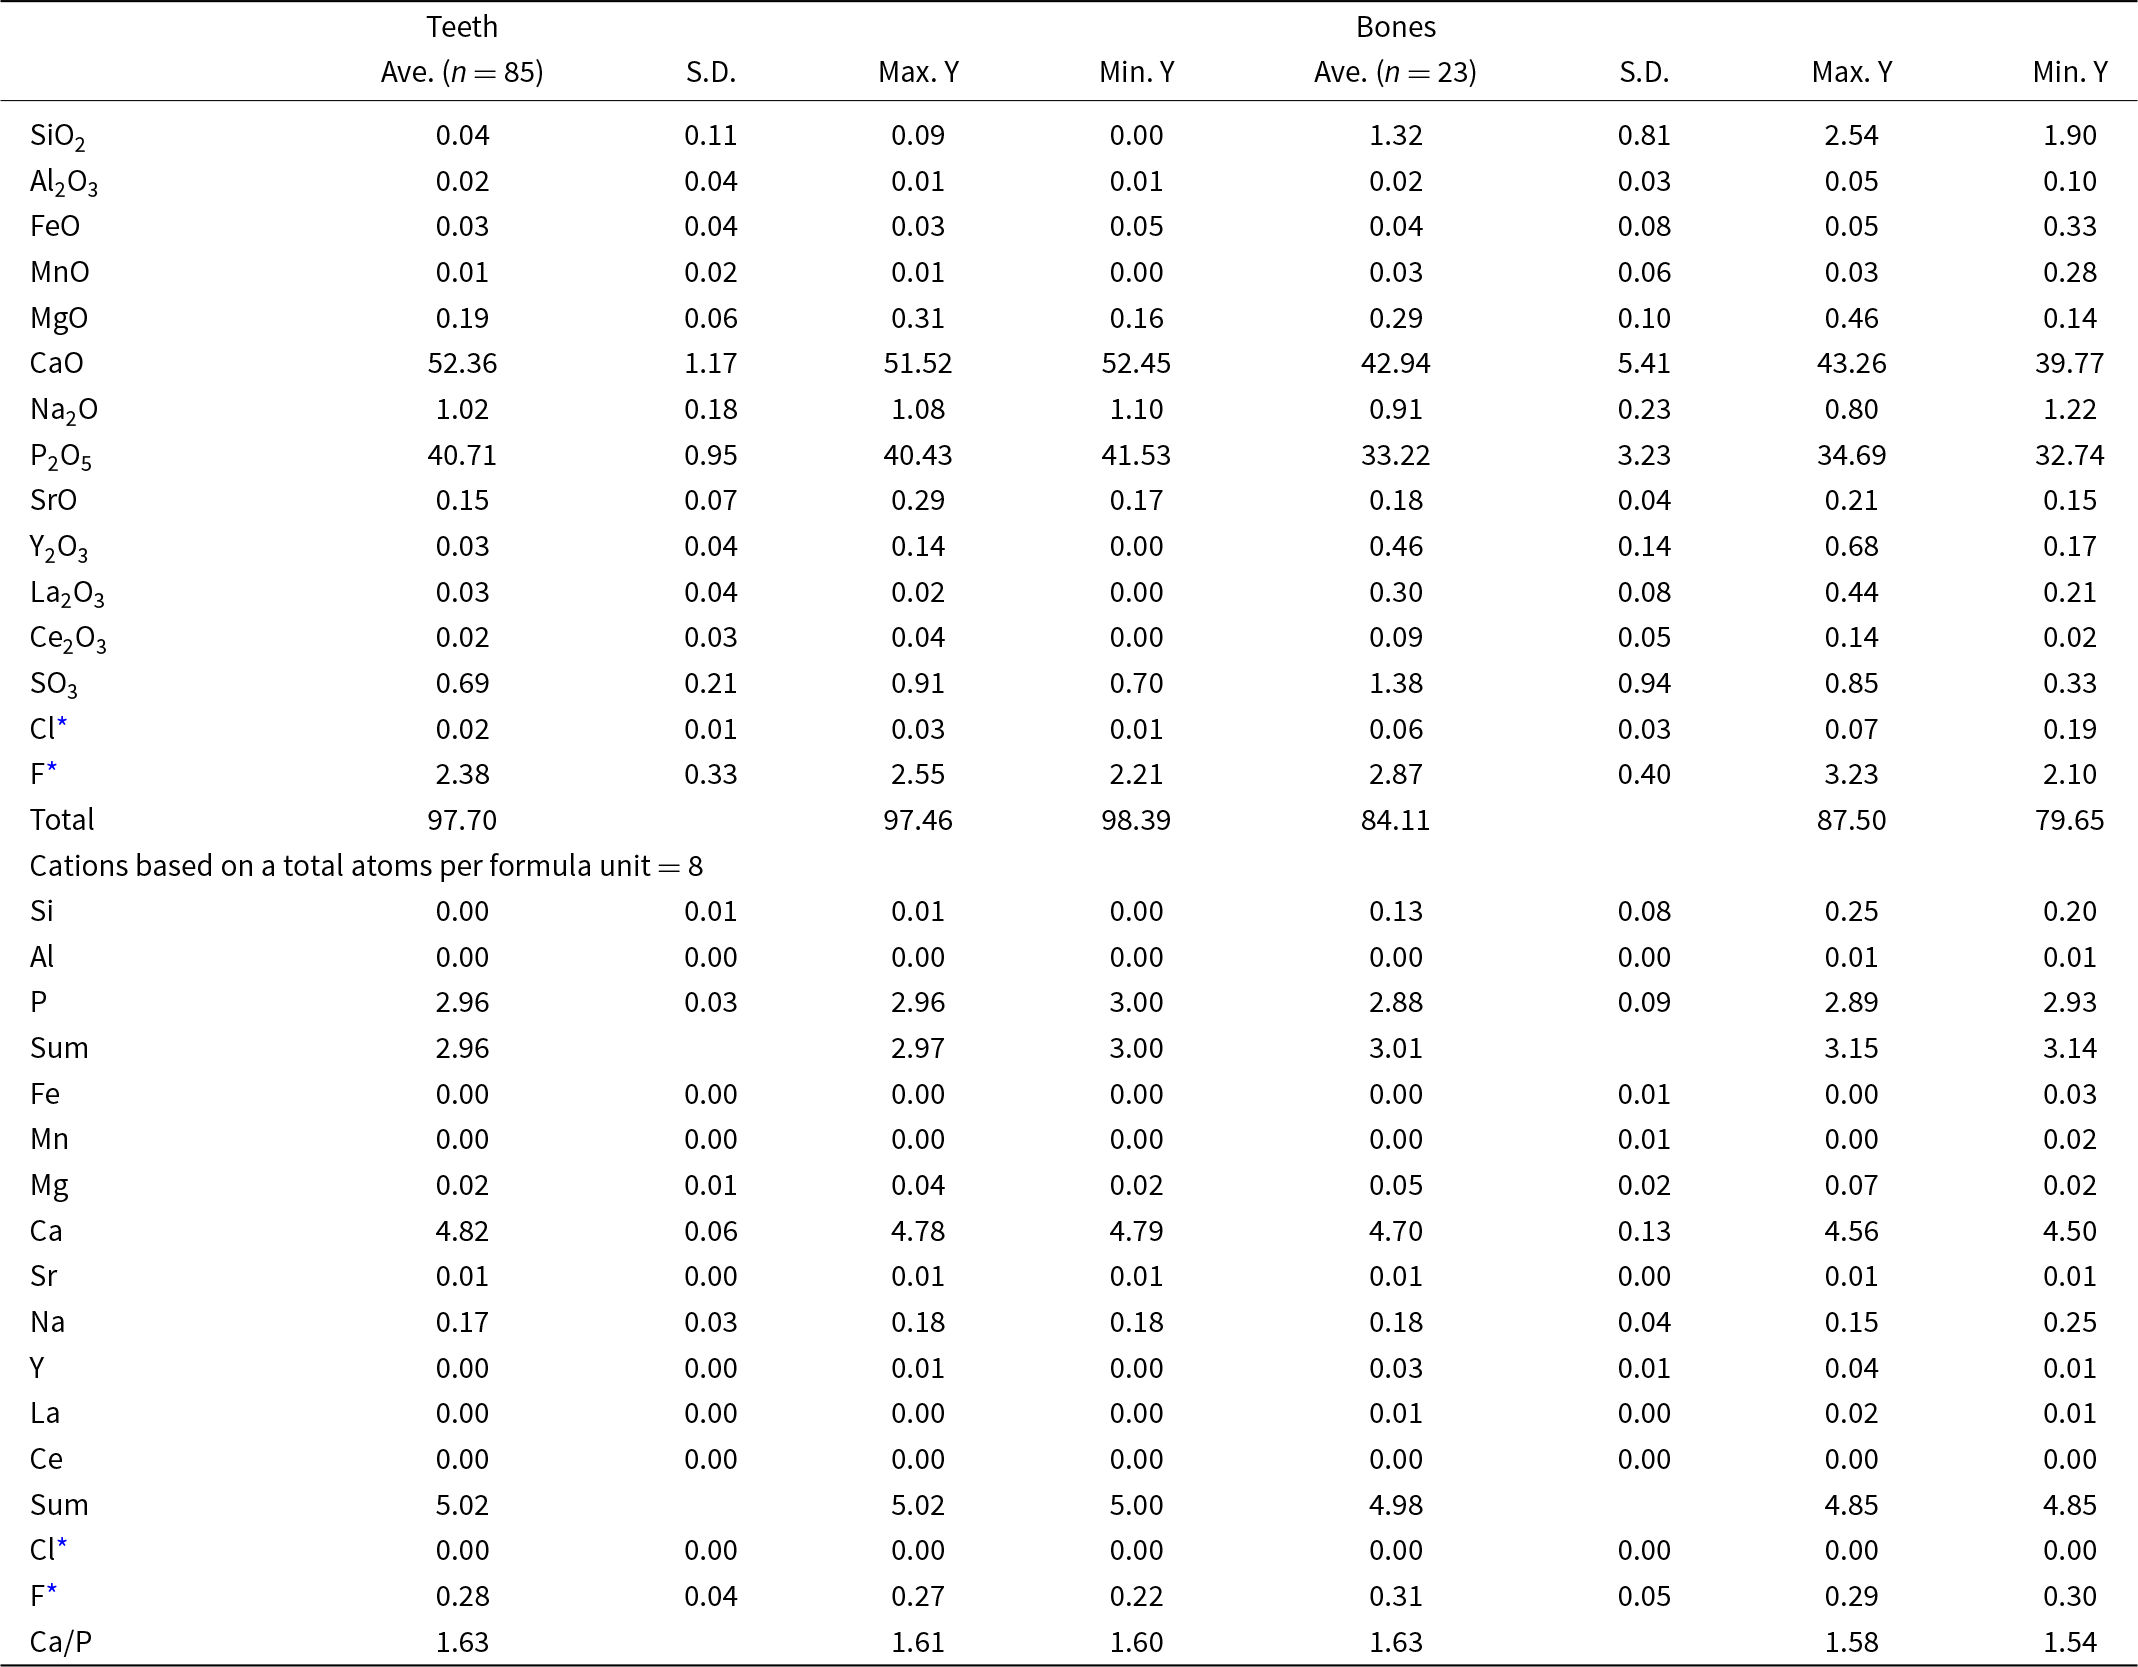
The EPMA data for apatite, the main constituent of both the fish teeth and bone debris, are shown in Table 3. The average CaO and P2O5 contents are 51.36 ± 1.17 wt.% and 40.71 ± 0.95 wt.% (N = 85), respectively, for the fish teeth, and 42.94 ± 5.41 wt.% and 33.22 ± 3.23 wt.% (N = 23), respectively, for the fish bones. Both fish teeth and bones have Ca/P atomic ratios close to 1.63, which is in the range for Ca/P ratios of biogenic apatite. The smaller CaO and P2O5 contents of the bone debris can be attributed to the sparser distribution of apatite crystals in the bone debris due to its porous internal texture, which reflects the fact that such internal texture is originally that of organic tissue such as nerve tissue (Figs 3, 4).
Back-scattered electron images (BEI) of apatite from a tooth and bones extracted from REE-rich mud samples: (a) Ca, P and Y element-distribution maps (parts b, c and d, respectively). In each image, the left side shows the tooth and the right side shows the bone fragments. The colour scale bars in the diagram show higher concentrations at the top and lower concentrations at the bottom. These images were obtained from EPMA using a wavelength-dispersive spectrometer.

Compositions of apatite (wt.%) in the teeth and bones from the REE-rich mud

* F and Cl are semi-quantitative values.
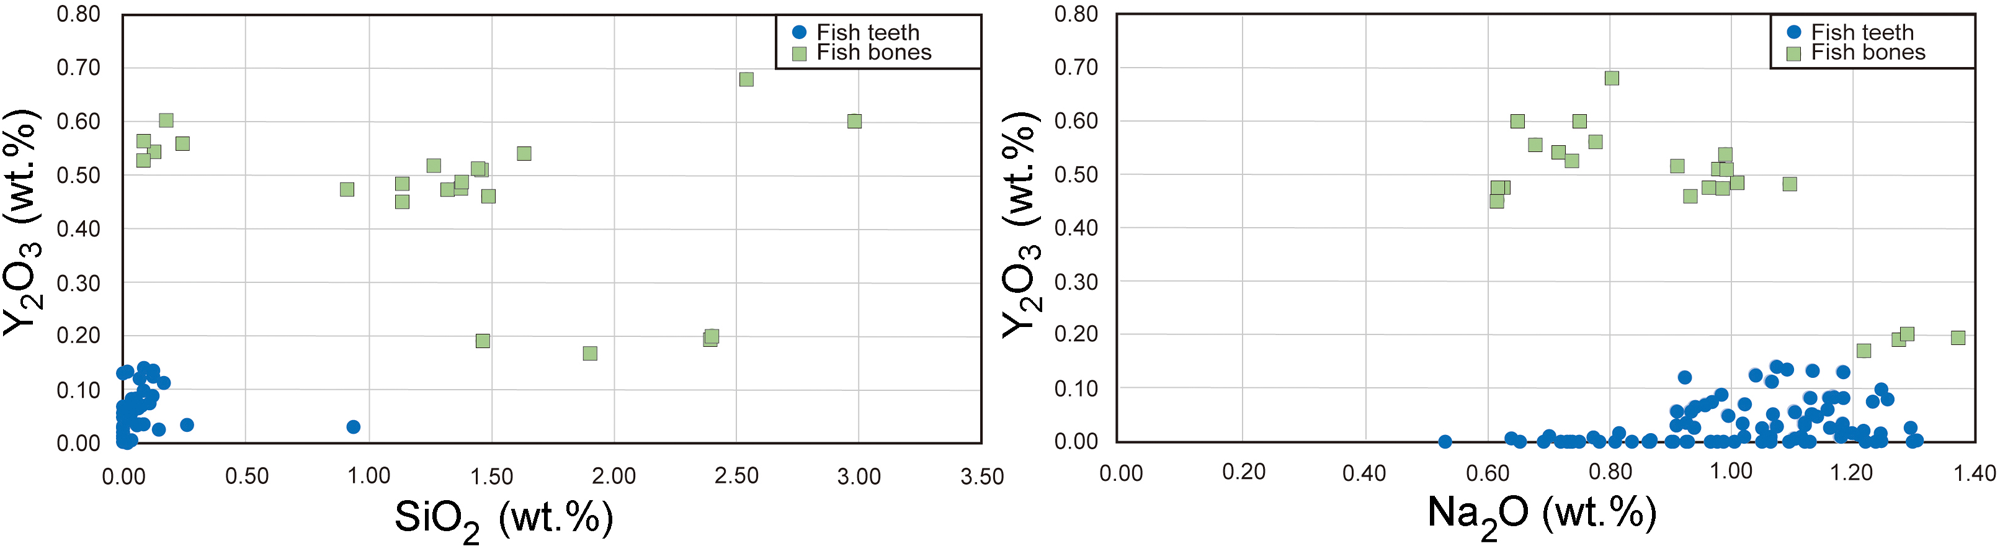
The Y content in apatite shows a bimodal distribution: apatite containing less Y is typically <0.2 wt.% and that with more typically has >0.4 wt.% (Fig. 5). Therefore, in this study, apatite with less Y is referred to as REE-poor apatite, while that with more Y is referred to as REE-rich apatite.
Correlations of Y2O3 content with: (a) SiO2 and (b) Na2O contents in apatite of the fish teeth (green mark) and bone debris (blue mark) from the REE-rich mud.

The maximum Y2O3 contents of the fish teeth is 0.14 wt.%, and thus, the apatite of the fish teeth are classified as REE-poor apatite. On the other hand, the maximum Y2O3 content of apatite in the fish bones is 0.68 wt.%, and most of the analysis point data indicate the fish bone apatite to be classified as REE-rich apatite. Note that the Y2O3 content of apatite in the fish bones is ∼0.2 wt.% at its lowest, but the fish-bone apatite with such low Y contents is rare (Fig. 5). There is no correlation between the Y2O3 and SiO2 contents or between the Y2O3 and Na₂O contents in apatite (Fig. 5).
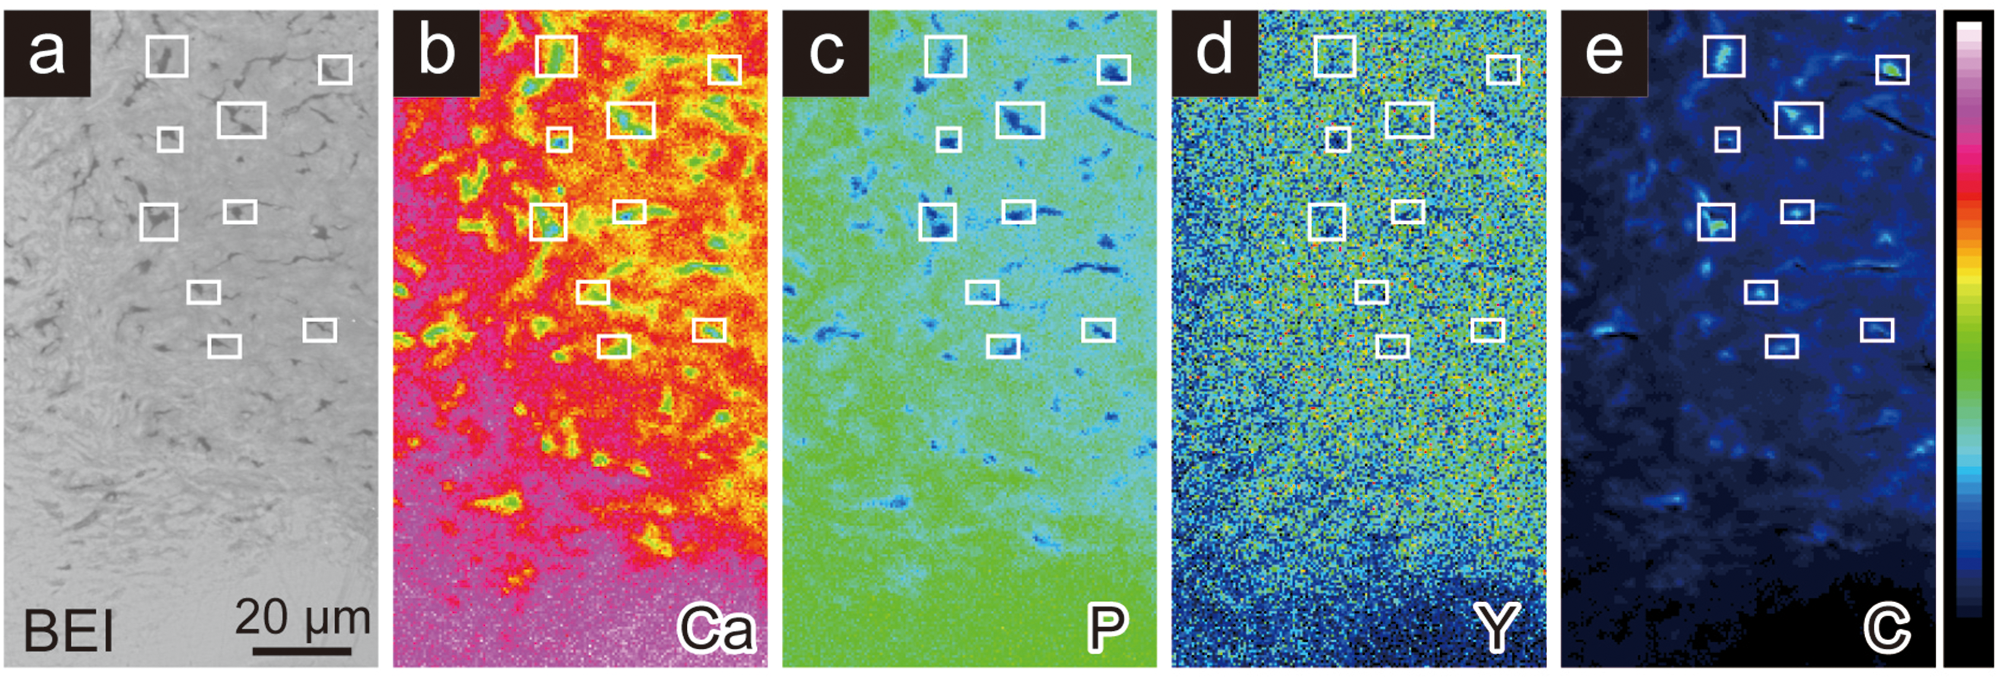
Most bone debris does not contain visible carbonaceous material under electron microscopic observation (Fig. 3d) but visible carbonaceous material exists on the placoid scale classified as bone debris (Fig. 6a). Figure 6 shows the distributions of Ca, P, Y and C in the placoid scale. The areas indicated by rectangles, characterized by high C and low Ca and P concentrations, suggest the presence of carbonaceous material. As these areas do not exhibit significant enrichment of Y, it is inferred that REE are not concentrated preferentially in the carbonaceous material. Furthermore, apatite is divided into Y-rich apatite and Y-poor apatite regions. Carbon is present in larger amounts in Y-rich apatite regions.
Back-scattered electron image (BEI) (a), and element-distribution maps for Ca, P, Y and C (parts b, c, d and e, respectively) of the bone debris. The colour scale bar in the maps represents element concentration: top, highest; bottom, lowest. The scale bar is 20 mm. The white squares indicate nine representative high-C positions in the carbon distribution map (e) and the corresponding positions in the BEI and Ca, P and Y distribution maps.

LIBS analysis of Y and C in apatite of fish teeth and bone debris
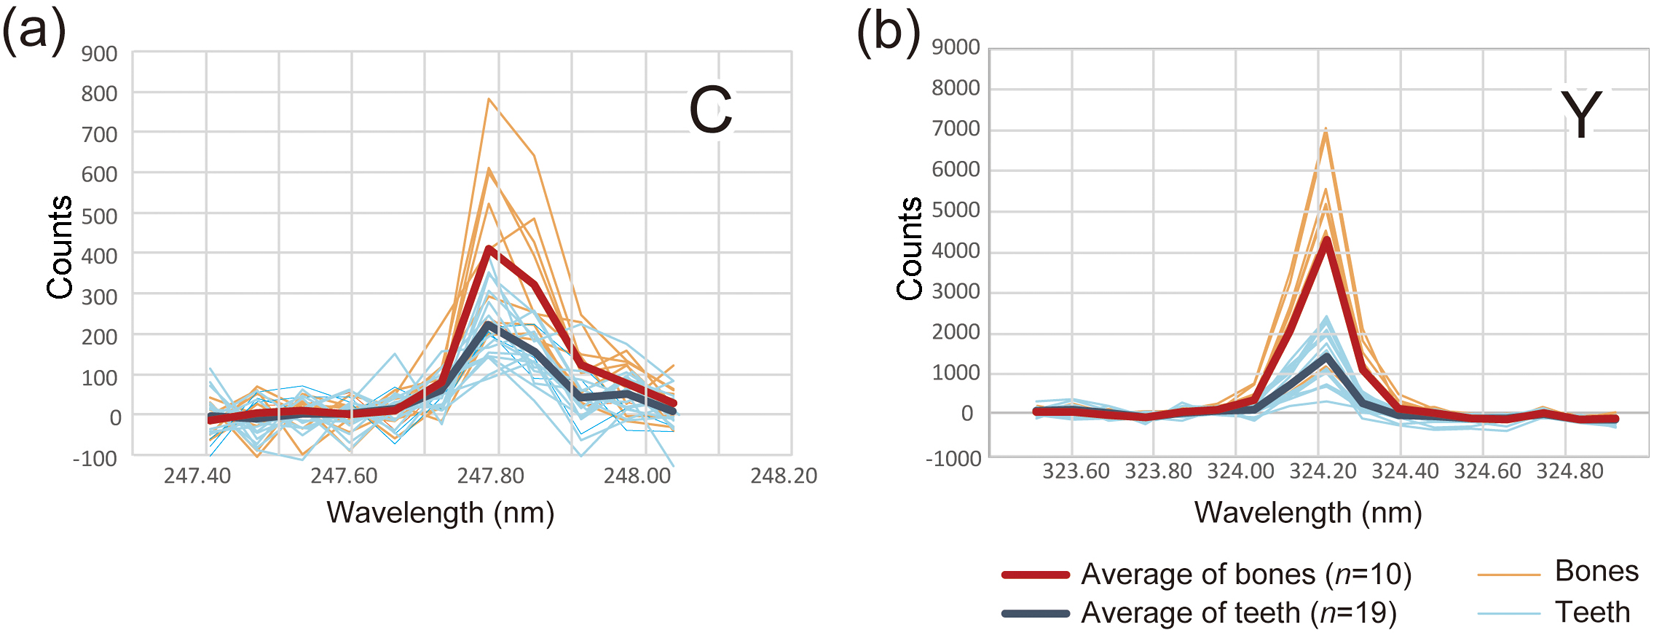
The LIBS spectra of Y and C in the fish teeth and bone debris indicate that Y is more dominant in the bone debris than in the fish teeth. The LIBS analysis detects C in both bone debris and teeth, but the intensities of the LIBS spectra of the bone debris are stronger than those of fish teeth (Fig. 7).
LIBS spectra of carbon (a) and yttrium (b) showing counts vs laser pulse energy (wavelength, nm). Red line: average C and Y spectra for apatite in the fish bones; Blue line: average C and Y spectra for apatite in the fish teeth. Orange lines: individual C and Y spectra for apatite in the fish bones; Light blue line: individual C and Y spectra for apatite in the fish teeth.

Infrared spectroscopic analysis of apatite in fish teeth and bone debris
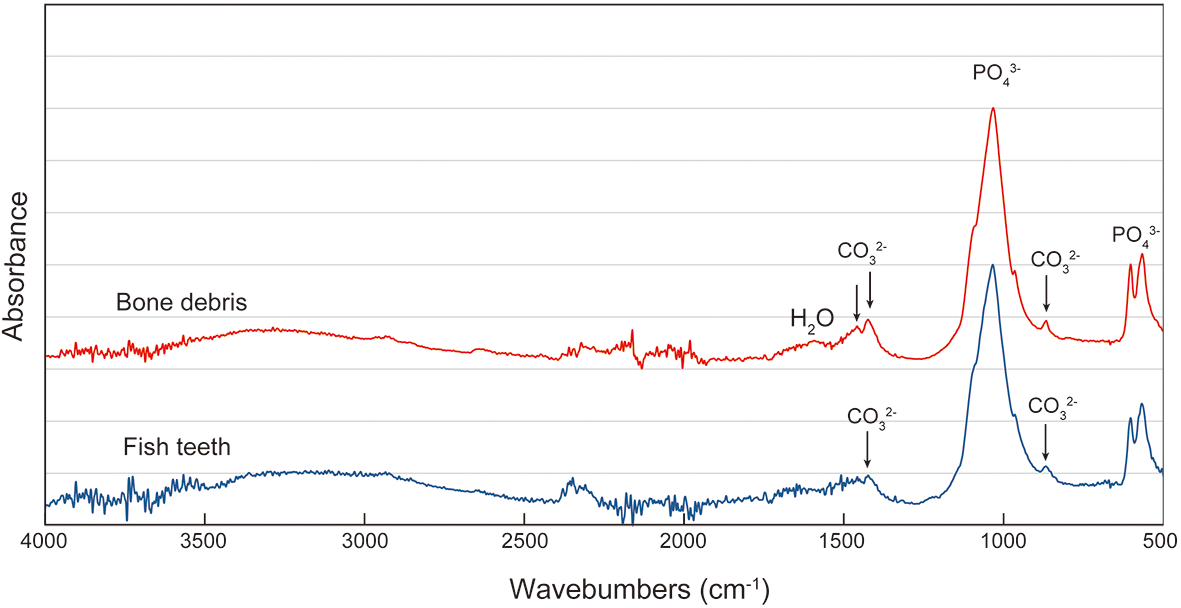
FTIR spectra of apatite are shown in Fig. 8, showing characteristic absorption bands associated with phosphate group minerals. The ν₃ asymmetric stretching mode of PO₄3⁻ appears prominently at ∼1030 cm⁻1, while the ν₄ bending mode is observed near ∼600 cm⁻1. The characteristic absorptions corresponding to CO32– bonding in apatite are at ∼1459 cm⁻1, 1425 cm⁻1 and 869 cm⁻1. The absorptions by CO32– bonding in the FTIR spectra of the bone debris are stronger than those of the fish teeth, which indicate that CO32– bonding is more prominent in the bone debris. This is attributed to greater carbon concentrations in the form of CO32– in the bone debris than in the fish teeth.
Infrared absorption spectra of fish teeth and fish bone debris.

TEM observations and TEM-EDX analyses of apatite in fish teeth and bone debris
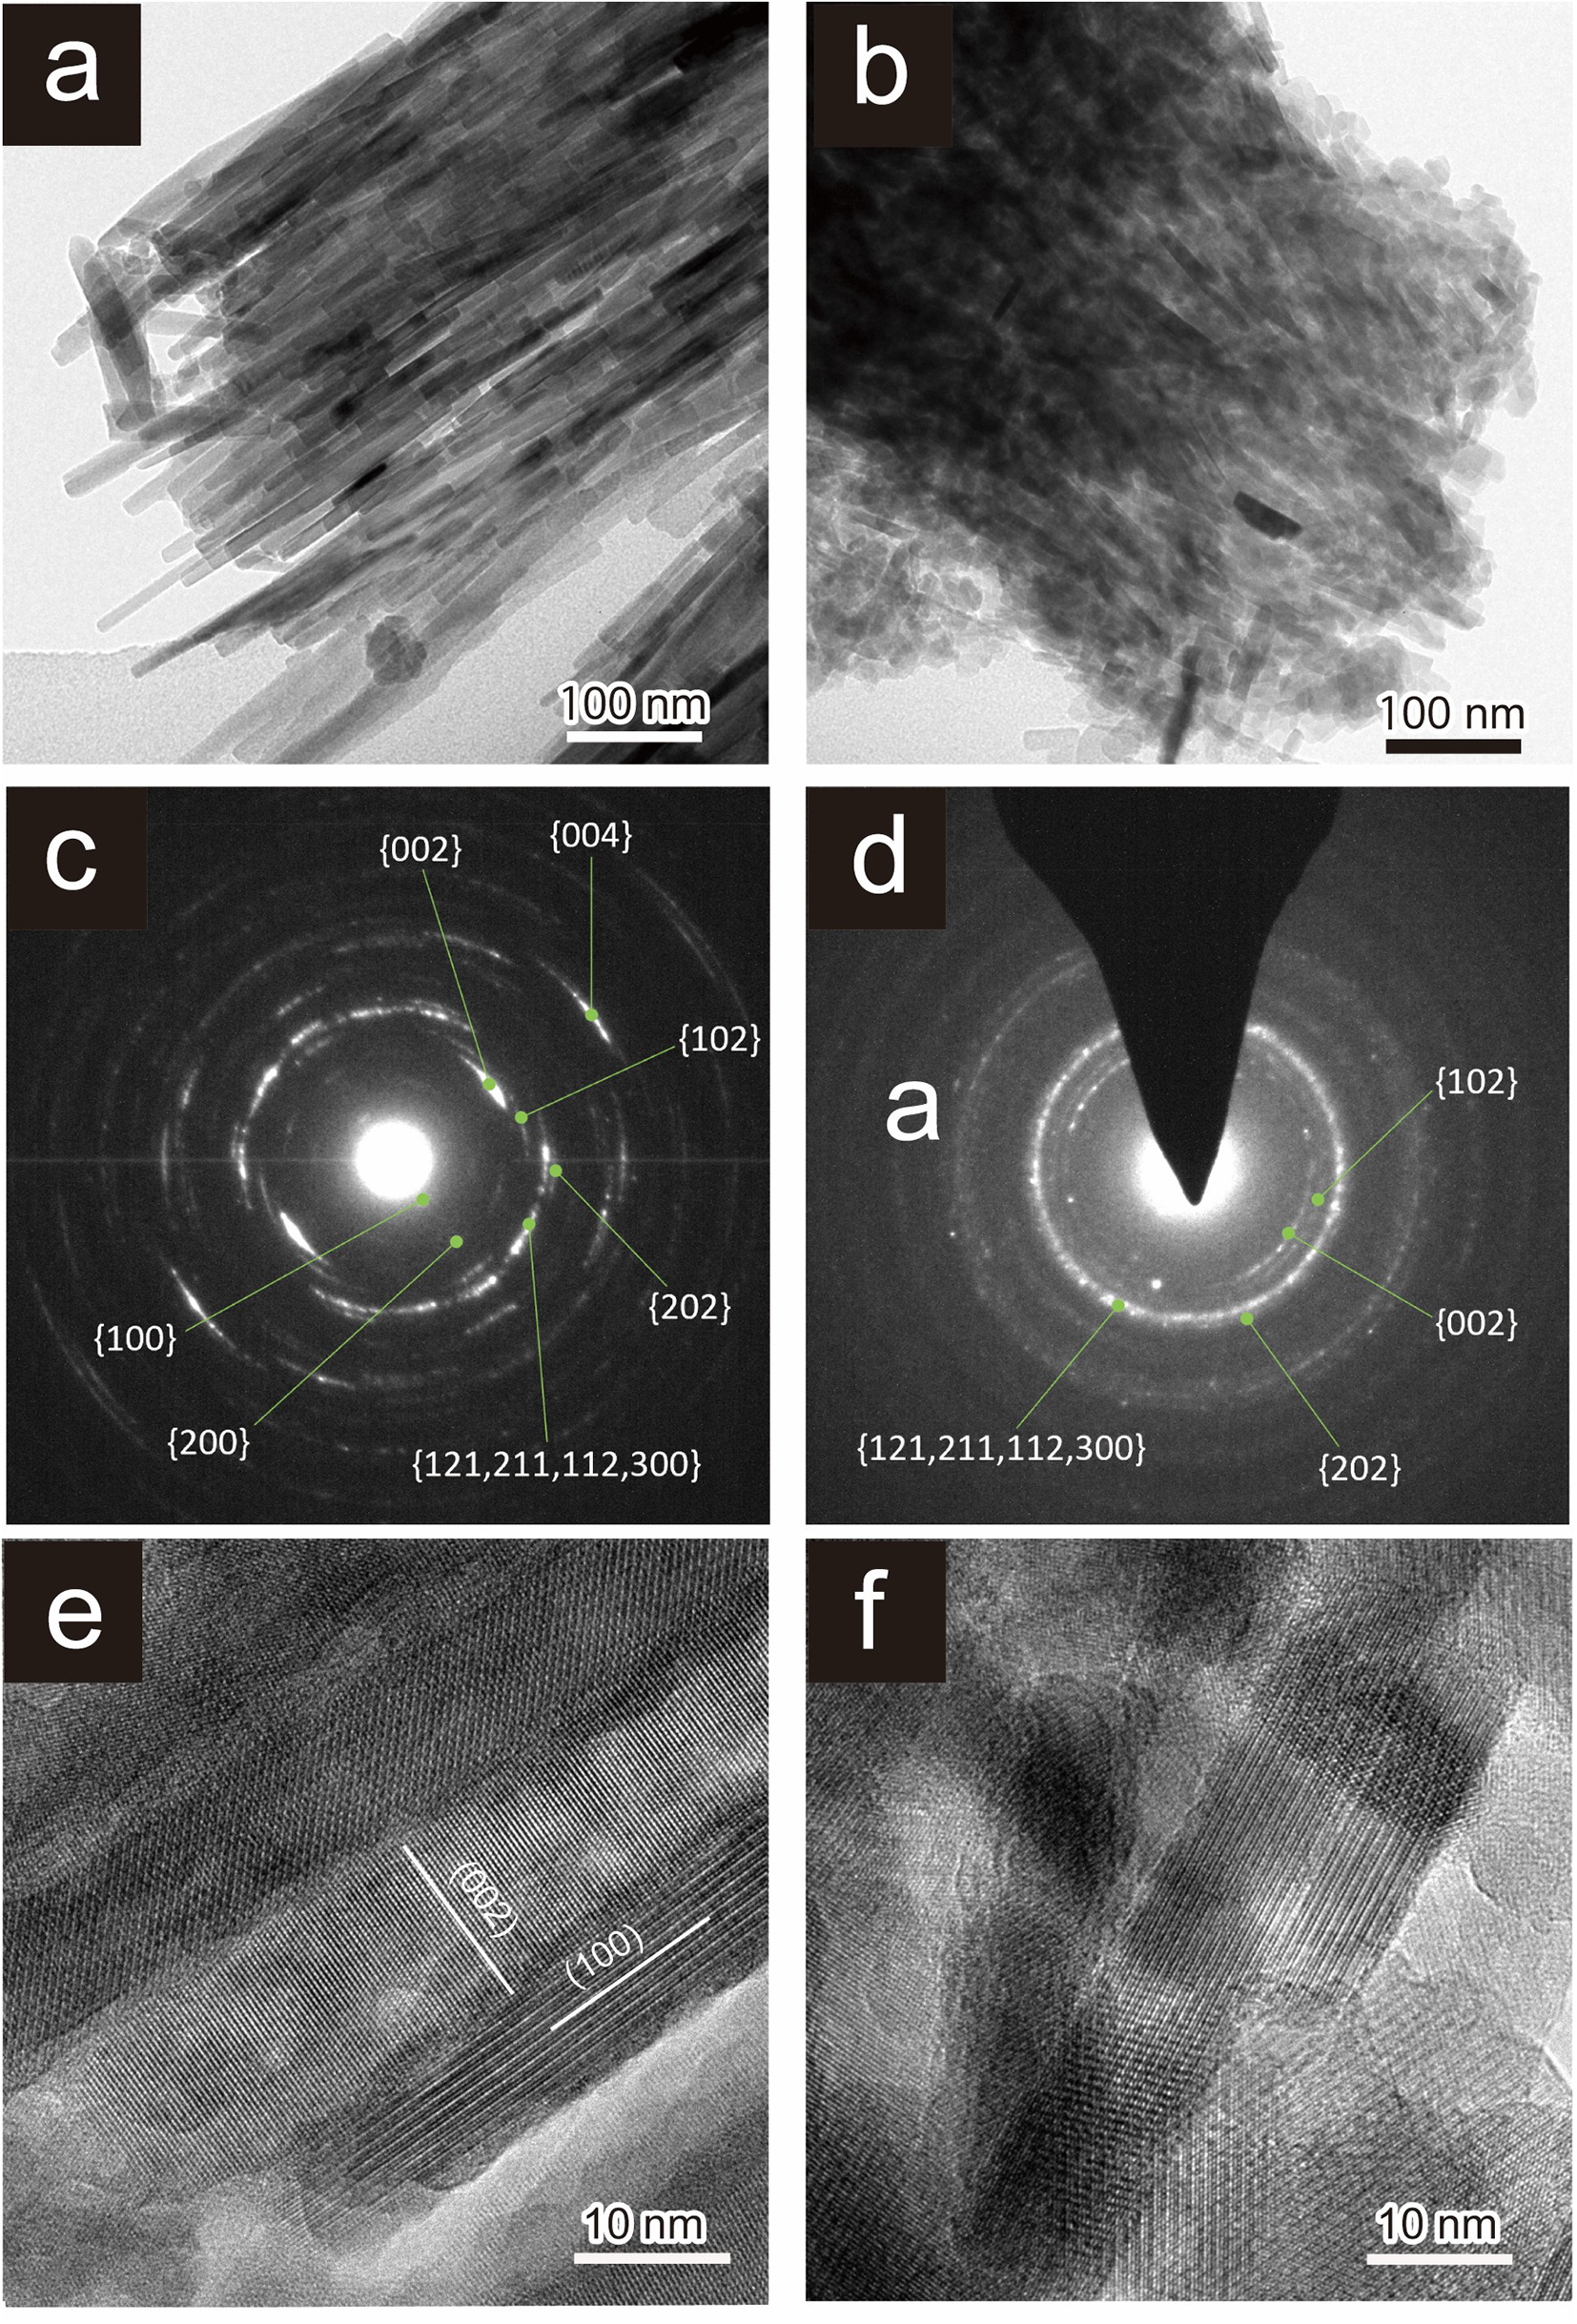
The TEM observations show that the fish teeth are composed mainly of aggregates of long rod-like crystals (several hundred nanometres long and ∼10 nm wide) (Fig. 9a) with a strong {002} orientation of apatite (Fig. 9b), which indicates enamel. An HR-TEM image shows that they are composed of grains with their long axes oriented in the [002] direction (Fig. 9c). In contrast, the bone debris is composed of aggregates of rod-like crystals ∼10 nm wide and 50 nm long (Fig. 9d). The SAED images show that these aggregates have a weak {002} orientation of apatite (Fig. 9e) and the HRTEM images show the atomic arrangement of apatite (Fig. 9f).
Bright-field TEM image (a, b), selected area electron-diffraction patterns (SAED) (c, d), and HRTEM (e, f) images from (a, c, e) crushed fish teeth and (b, d, f) crushed bone debris. The SAEDs were obtained from a range of ∼0.7 nm. General forms {002}, {004}, {102}, {202}, {100}, {200} and {121,211,112,300} are those of apatite (c,d). (002) and (100) are crystal planes of apatite (e).

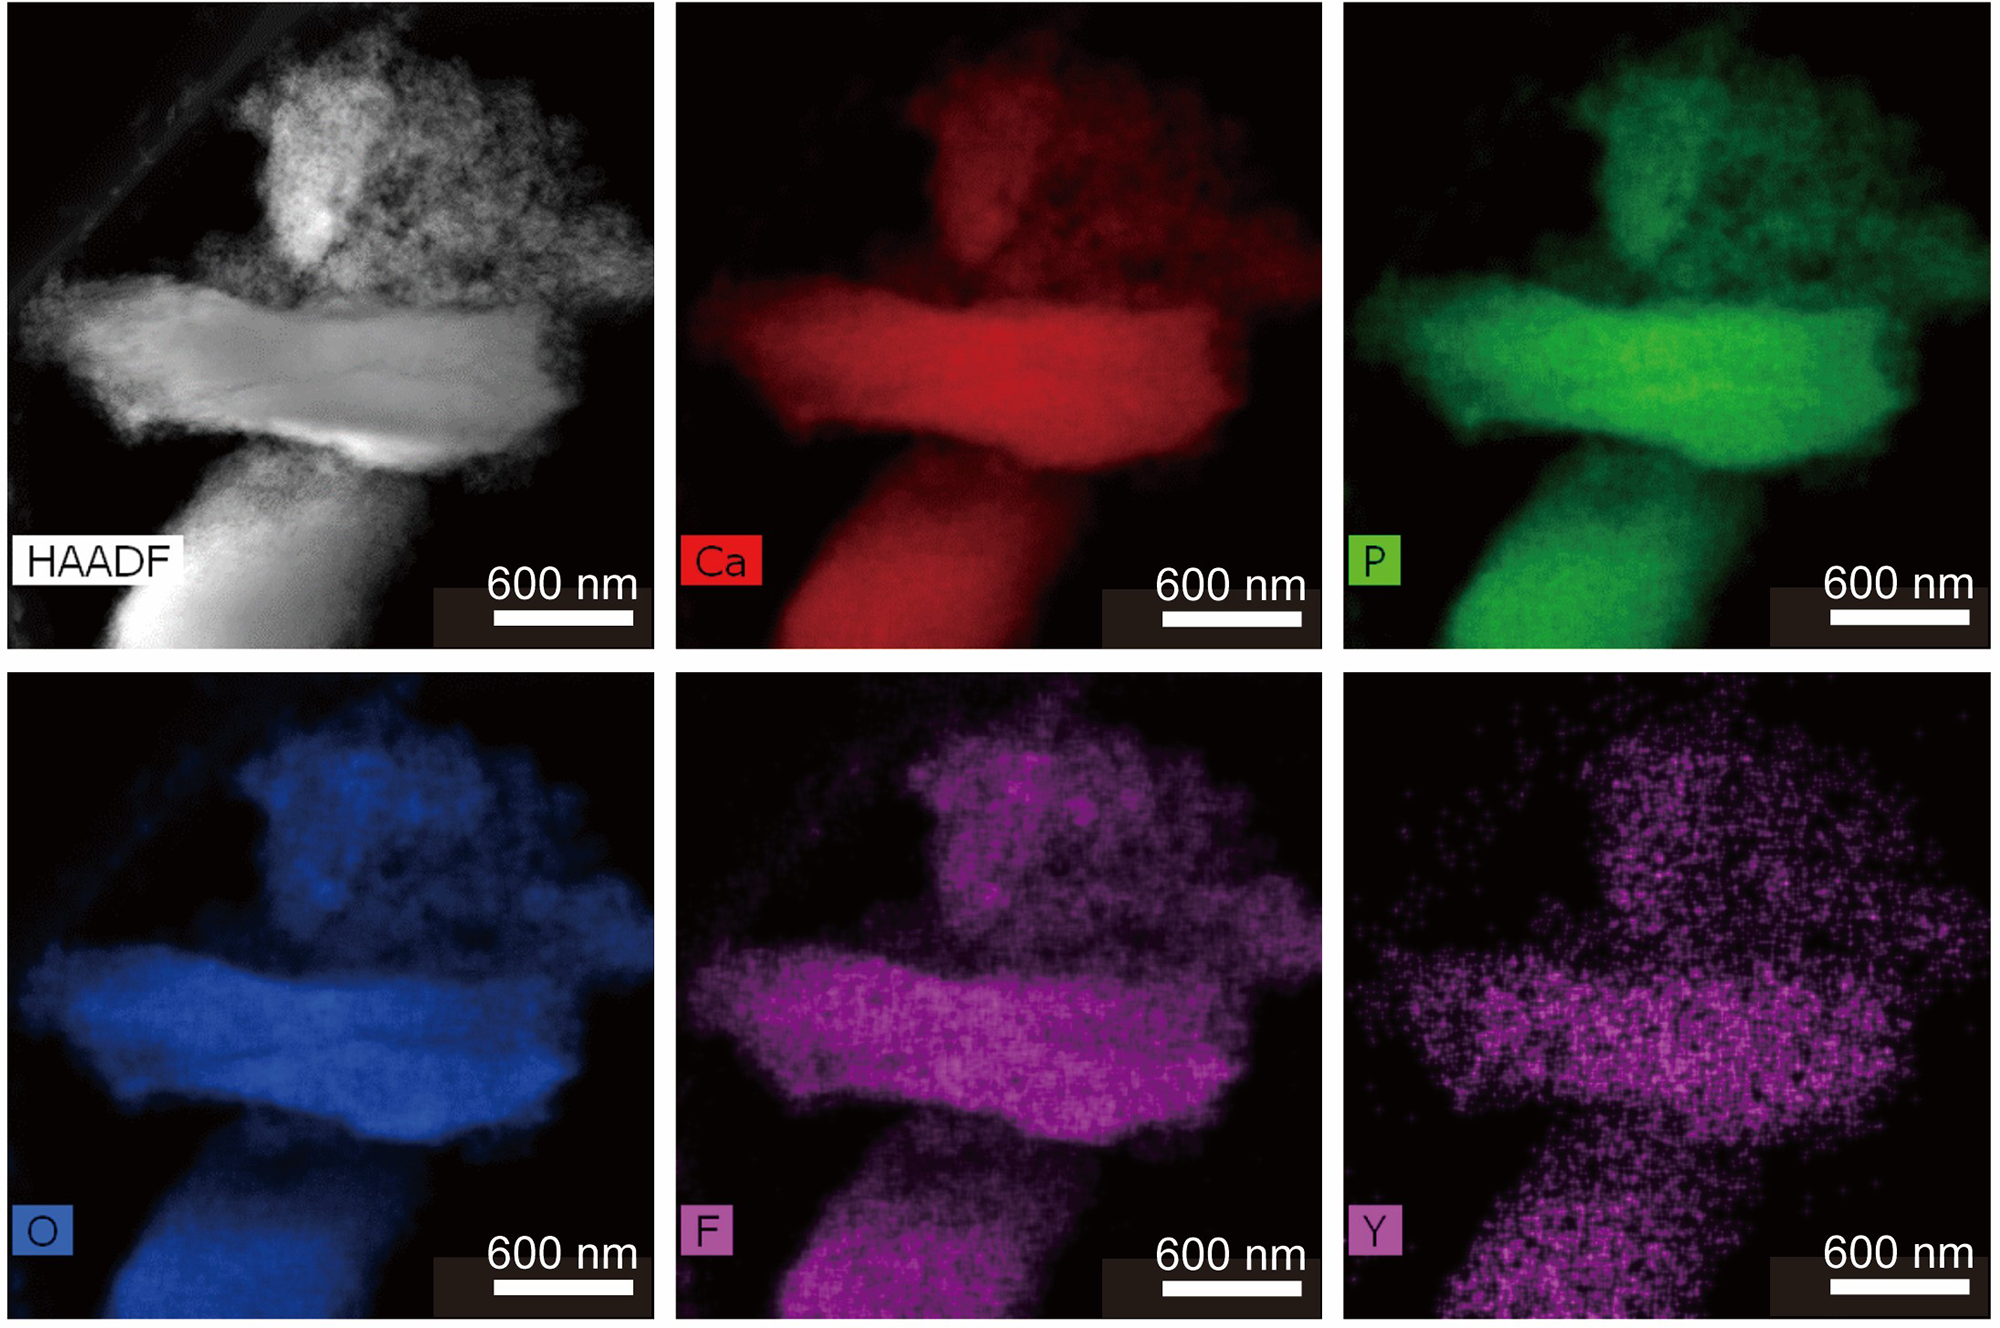
The TEM-EDX elemental mapping of yttrium distribution (Fig. 10) shows that small amounts of Y are distributed evenly throughout the bone debris. The corresponding HAADF image lacks contrasting bright material indicative of average atomic numbers heavier than apatite composition. Moreover, these images indicate that the apatite in the bone debris does not contain REE-bearing inclusions such as xenotime (Fig. 10).
HAADF-STEM image and TEM-EDX element-distribution maps (Ca, P, O, F and Y) of crushed bone debris.

XANES spectral analysis
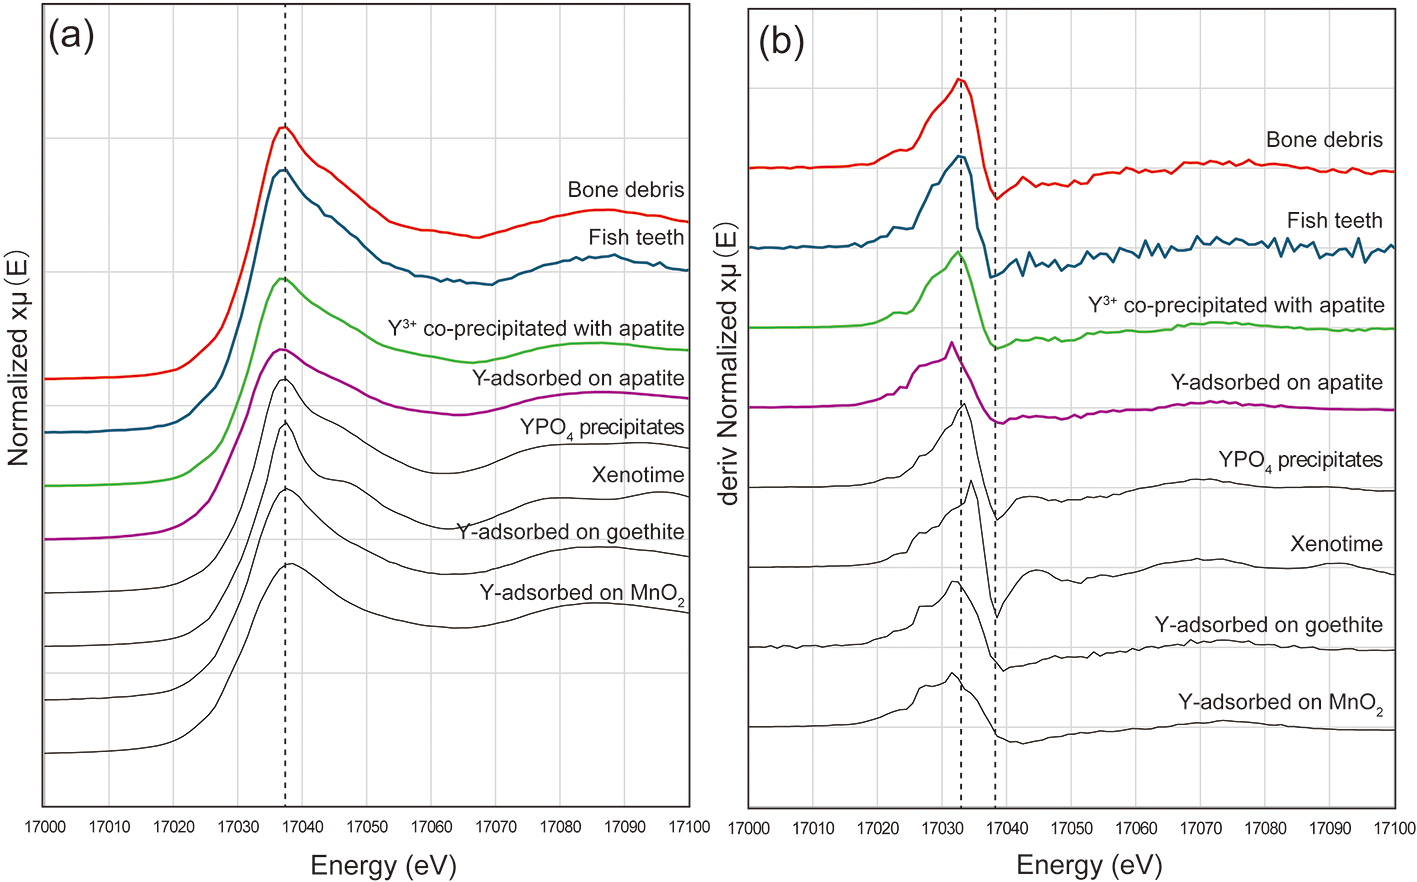
The Y K-edge XANES spectra of the REE-rich bone debris and REE-poor fish teeth (Fig. 11) show that the XANES spectra and their 1st derivative are nearly identical. The XANES spectra and their 1st derivative are also similar to those of Y3+ co-precipitated with hydroxylapatite prepared at room temperature in this study (Fig. 11b). These results also suggest that: (1) the Y3+ ions in the bone debris and fish teeth are incorporated into cation sites within the apatite structure; and (2) the chemical environment of Y3+ incorporated in phosphate formed in water under ambient conditions.
(a) Y K-edge XANES spectra and (b) 1st derivative of XANES spectra for Y in REE-rich bone debris and REE-poor fish teeth with other reference materials of Y3+ co-precipitated with apatite, Y3+-adsorbed on apatite, YPO4 precipitates (YPO4 prec.), xenotime, Y3+-adsorbed goethite, and Y3+-adsorbed MnO2.

Discussion
As stated in the Introduction, the known host mineral of REE other than Ce in REE-rich deep-sea sediments is apatite (Kashiwabara et al., Reference Kashiwabara, Toda, Fujinaga, Honma, Takahashi and Kato2014; Kon et al., Reference Kon, Hoshino, Sanematsu, Morita, Tsunematsu, Okamoto, Yano, Tanaka and Takagi2014). The results of the extraction experiments on the fish debris from the Minami-Torishima REE-rich mud, presented here, also indicate that the REE are contained in fish debris.
REE enrichment of apatite in such fish debris has been interpreted to occur in three mechanisms: (1) adsorption of REE within the surface of apatite (as outer- or inner-sphere complexes (Kashiwabara et al., Reference Kashiwabara, Toda, Fujinaga, Honma, Takahashi and Kato2014, Reference Kashiwabara, Toda, Nakamura, Yasukawa, Fujinaga, Kudo, Nozaki, Takahashi, Suzuki and Kato2018); (2) adsorption of REE on organic material within teeth and bones (e.g. Rychkov et al., Reference Rychkov, Kirillov, Kirillov, Bunkov, Botalov, Semenishchev, Smyshlyaev, Malyshev, Taukin and Akcil2022); and (3) substitution of REE for Ca in apatite (Elliott et al., Reference Elliott, Holcomb and Young1985; Ronsbo, Reference Ronsbo1989; Pan and Fleet, Reference Pan and M.E2002; Hughes and Rakovan, Reference Hughes and Rakovan2015). Each of these mechanisms is discussed in detail below.
Adsorption of REE as outer- or inner-sphere complexes
The Y contents are greater in areas of high-C content, which consists of fine apatite crystals in bone debris, than in the fish teeth, which are characterised by low-C contents and larger crystals. We found the Y content of the C-rich area consisting of fine apatite crystals in the bone debris to be greater than that of the fish teeth consisting of larger C-poor crystals than bones. This result suggests that, because bone fragments are aggregates of small apatite crystals, the overall surface area of apatite is large, thereby increasing the area available for adsorption of REE. However, our extraction experiments with (NH4)2SO4 reagent failed to extract the REE from the mud. This result implies that adsorption of REE as outer-sphere complexes on the external surface of apatite crystals is improbable and is not effective for the extraction of REE from the mud.
In their study of deep-sea REE-rich muds from the East Pacific Ocean, Kashiwabara et al. (Reference Kashiwabara, Toda, Fujinaga, Honma, Takahashi and Kato2014, Reference Kashiwabara, Toda, Nakamura, Yasukawa, Fujinaga, Kudo, Nozaki, Takahashi, Suzuki and Kato2018) reported that the La K-edge XANES and Y K-edge XANES and EXAFS spectra they obtained indicate that the form of Y is closer to REE adsorbed on apatite (inner-sphere complex) than to YPO₄ (in the structure). Our study indicates the existence of Y in the cation sites in apatite. Therefore, Y, which is present as an inner-sphere complex or an outer-sphere complex on the external surface of apatite crystals, is minor in these fish debris.
Adsorption of REE on organic material within apatite
The correlation between C and Y contents observed in the bone debris using LIBS (Fig. 7) might indicate the adsorption of REE on organic materials within the bone debris. Because organic material can fix trace amounts of metals by forming metal complexes (e.g. Rychkov et al., Reference Rychkov, Kirillov, Kirillov, Bunkov, Botalov, Semenishchev, Smyshlyaev, Malyshev, Taukin and Akcil2022) and bone is generally composed of ∼35% organic matter (mainly in the form of fibrous proteins such as collagen) and 65% inorganic matter, adsorption of REE on organic matter in apatite is a possible REE-enrichment mechanism. However, organic matter such as collagen in bone debris decomposes over time. Moreover, no significant concentration of Y was observed in the high-C contents area within the bone, which might be organic matter itself or its remnants (Fig. 6). Thus, it is not likely that the REE in the Minami-Torishima bone debris are adsorbed in the form of metal complexes on organic material in apatite. The involvement of organic matter in Y adsorption on fish bones is an issue for further study.
Substitution of REE for Ca within the apatite crystal structure
The Y K-edge XANES analyses suggest that the Y3⁺ ions in the bone debris and fish teeth are incorporated into cation sites of the apatite structure (Fig. 10). The co-extraction of P and REE by HCl suggests that REE was incorporated within the apatite crystal structure and released via its dissolution. Moreover, most of the Y in the apatite structure is present at the IXM1 and VIIM2 sites which are occupied by Ca (Pasero et al., Reference Pasero, Kampf, Ferraris, Pekov, Rakovan and White2010). Yttrium will slightly prefer the IXM1 site as it is a HREE (e.g. Pan and Fleet Reference Pan and M.E2002). The absence of minerals containing heavy elements, such as xenotime, is consistent with this conclusion, as shown by the HAADF images in Fig. 9. The substitution of REE for Ca in natural apatite has been attributed to the following chemical reactions: REE3+ + Na+ ↔ 2Ca2+ or REE3+ + SiO44– ↔ Ca2+ + PO43− (Ronsbo, Reference Ronsbo1989; Pan and Fleet, Reference Pan and M.E2002; Hughes and Rakovan, Reference Hughes and Rakovan2015). These substitutions have also been reported for apatite in the REE-rich mud from the central North Pacific Ocean (Liao et al., Reference Liao, Sun, Li, Sa, Lu, Lin, Xu, Zhan, Pan and Xu2019), but our analyses of apatite from the Minami-Torishima area showed no positive correlations between REE and Si or Na. Considering the Y content in the apatite of REE-rich mud (average 0.46 wt.%), the amounts of Si and Na, which have a substitution relationship with Y, are below the detection limit. Therefore, the lack of correlation between Si, Na and Y in this study does not necessarily exclude the validity of this substitution mechanism. However, the fact that the distribution of Na and Si differs from that of Y suggests that the involvement of Na and Si in the enrichment of Y is minimal. Carbonate is known to substitute for OH and/or PO4 in human dental enamel. Elliott et al. (Reference Elliott, Holcomb and Young1985) reported that carbonate groups within biogenic apatite have substituted for PO4 (reaction PO4 ↔ CO3). Moreover, the substitution relationship Ca2+ + P5+ = REE3+ + C4+ has been reported in britholite from the apatite supergroup (Anenburg et al., Reference Anenburg, Panikorovskii, Jennings, Shendrik, Antonov and Gavrilenko2024). This substitution reaction can explain the positive correlation between REE and C which we found in our analyses of apatite from fish debris (Figs 6, 7).
The results and interpretations of the published studies cited above are consistent with the low concentrations of Ca and P in areas with high concentrations of Y and C (Figs 6, 7), which is also consistent with the pronounced presence of CO32– in Y-rich apatite. Therefore, we consider that enrichment of REE in the biogenic apatite in the REE-rich mud of the Minami-Torishima area reflects the substitution reactions Ca2+ + P5+ = REE3+ + C4+.
Sekine et al. (Reference Sekine, Takuya, Yamada, Matsumura, Nemoto, Takeguchi, Sugita, Shimoyama, Kozai and Morooka2021) reported that the addition of carbonate groups (CO32−) to biogenic apatite facilitates the concentration of elements with large ionic radii, such as Sr (effective ionic radius of 1.31 Å for Sr2+ in the 9-coordinate site). We speculate that the amount of carbonate-group material in the apatite from the REE-rich mud of the Minami-Torishima area may have been increased by an unknown mechanism, thus allowing more REE (effective ionic radius of 1.075 Å for Y3+ in the 9-coordinate site) to be incorporated into the apatite structure. Because the REE contents are higher in areas that are rich in organic tissue, it is possible that the causative mechanism is alteration of the collagen present in the biogenic apatite by diagenetic effects (e.g. decay or burial), resulting in decomposition of the polymeric structure and reaction with apatite, thus increasing the amount of carbonate group material.
Conclusions
Fish debris present in unconsolidated mud from the Minami-Torishima area is rich in REE. Such debris is classified as tooth or bone debris based on shape. Bone debris is more porous than that from teeth. Furthermore, teeth are composed of long rod-like crystals with a [002] oriented shape characteristic of enamel, whereas bone debris is composed of aggregates of rod-like apatite crystals with a random orientation. Bone is richer in Y and C than teeth. Fine YPO₄ crystals or other impurities are not observed in bone debris, and no notable enrichment of Y is detected in the C-only regions, which are presumed to be organic. In contrast, the presence of prominent CO₃2⁻ was confirmed in Y-rich apatite. Carbonate groups can substitute for phosphate or hydroxide in the apatite structure, potentially enhancing the incorporation of REE by creating more favourable sites for their incorporation. Moreover, Y replaces Ca in apatite in regions with a high C content in the fish debris. These findings suggest that carbon incorporation plays a crucial role in the REE enrichment process within apatite such as fish debris in deep-sea unconsolidated mud.
Supplementary material
The supplementary material for this article can be found at https://doi.org/10.1180/mgm.2025.10106.
Acknowledgements
The authors thank the four reviewers (Prof. Matt Kohn, Dr. Michael Anenburg, Dr. John Fink and one anonymous) and the Associate Editor (Owen Missen) for their valuable comments and suggestions which have greatly improved the quality of this manuscript. They are also grateful to Masahide Akasaka, Emeritus Professor at Shimane University, for his valuable advice. They also thank Dr Makoto Nagasawa from AIST who provided valuable advice on XANES analysis. This study is part of a collaborative research project by the Japanese National Institute of Advanced Industrial Science and Technology and the Japan Organization for Metals and Energy Security (JOGMEC) on REE-rich deep-sea mud, based on the project of JOGMEC supported by the Japanese Ministry of Economy, Trade and Industry. This study was also supported by the Japan Society for the Promotion of Science KAKENHI Grant Number 21K20353.
Competing interests
The authors declare none.