Background
Monitoring child poverty in England, as in most countries, tends to be based on national sample survey evidence. The sample surveys used are not large enough to provide estimates at the small area level. The smallest geographical estimates of child poverty produced using the Family Resources Survey, for example, are for standard government office regions (regional populations between 1.8 and 8.9 million) in England and Wales, Scotland and Northern Ireland, and then are only reliable if three years of survey data are aggregated. Local authorities seeking to estimate child poverty rates have to turn to other sources. The UK census has never collected income data, and as an alternative, area-based income-deprivation measures have been developed for use in England, such as the Income Deprivation Affecting Children Index (IDACI). The IDACI is a count of children in families receiving means-tested benefits and excludes some families on low incomes who are not eligible for or not claiming benefits (further details on the IDACI below).
One question about the reliability of area-based measures such as the IDACI is whether it equally indicates child poverty across areas of varying socio-economic and demographic characteristics. If there is spatial variation in the take-up of means-tested benefits for children (as there is for pensioner benefits, see Richardson and Bradshaw, Reference Richardson and Bradshaw2008), then it may not be reliable as an indicator across areas.
There is some evidence from self-reported data that young families in the lowest income group claim fewer benefits than those in higher income bands (Ketende et al., Reference Ketende, Joshi, Michael, Hansen, Jones, Joshi and Budge2010), but the reasons for this pattern are unclear. This may be a particularly salient issue in areas with high proportions of minority ethnic populations, as these families are more likely to have lower incomes (Nandi and Platt, Reference Nandi and Platt2010). There has been little analysis of ethnic differences in benefit take-up by eligible persons in England except for the disability living allowance, which appears to have lower than expected take-up in some minority ethnic groups (Allmark et al., Reference Allmark, Salway, Crisp and Barley2010). Benefits make up a larger proportion of income for minority ethnic families than White British (Nandi and Platt, Reference Nandi and Platt2010; Finn and Goodship, Reference Finn and Goodship2014), but there has been little research into claim rates for minority ethnic families.
This question of reliability is relevant to the use of area-based measures such as the IDACI to determine need. If, for example, minority ethnic families are less likely to claim benefits, areas containing larger numbers of minority ethnic families will be ranked as less deprived than they would be if all families claimed at the same level of need.
In this study, we have sought to expand on the limited literature in this area and explore deprivation indicated by self-reported measures against the IDACI in areas of different ethnic diversity.
Research aim
The main aim of this study is to examine variation in the correlation between area deprivation indicated by the IDACI and self-reported deprivation measures in neighbourhoods with different ethnic composition. To do so, we compare the rank of Lower Layer Super Output Areas (LSOA) averages of self-reported measures of financial and material well-being from the Born in Bradford (BiB) cohort study to the rank of IDACI scores by different levels of minority ethnic diversity in Bradford. We also compare the reported level of benefit claimants between areas. The IDACI and BiB are described in further detail below.
The Income Deprivation Affecting Children Index (IDACI)
The Income Deprivation Affecting Children Index (IDACI) (Department for Communities and Local Government, 2010) has antecedents within the Indices of Deprivation for England produced in 2000, 2004, 2007 and 2010 (Noble et al., Reference Noble, Wright, Smith and Dibben2006; Department for Communities and Local Government, 2011). The IDACI is an area-based measure showing the percentage of children under sixteen living in households reliant on various means-tested benefits. The indicators are:
-
• children aged nought to fifteen in households claiming Income Support, Income-based Jobseeker's Allowance or Pension Credit (Guarantee);
-
• children aged nought to fifteen in households claiming Working Tax Credit in receipt of Child Tax Credit whose equivalised income (excluding housing benefits) is below 60 per cent of the median before housing costs;
-
• children aged nought to fifteen in households claiming Child Tax Credit (who are not eligible for Income Support, Income-based Jobseeker's Allowance, Pension Credit or Working Tax Credit) whose equivalised income (excluding housing benefits) is below 60 per cent of the median before housing costs.
Broadly, Income Support is a benefit paid to working-age claimants with no or low income, or those working part time. Jobseeker's Allowance is paid to those eighteen or over who are seeking work and Child Tax Credit is an income-tested benefit paid for each dependent child. The IDACI is an improvement on previously published Department for Work and Pensions (DWP) area-based benefit data because it also includes HM Revenue and Customs (HMRC) data on children in poor working households: households receiving Child Tax Credit with incomes less than 60 per cent of the median.
The IDACI is therefore a comprehensive, non-overlapping count of children living in households in receipt of both in-work and out-of-work means-tested benefits. The numerator is a simple sum of children aged nought to fifteen living in low-income households in the area, while the denominator is the total children aged nought to fifteen in the area. Thus, the indicator is the proportion of nought to fifteen-year-old children in the area who are living in low-income households receiving means-tested benefits.
The index is produced at the level of Lower Layer Super Output Areas (LSOAs).Footnote 1 These are geographical areas first derived in 2004 using 2001 Census outputs. They are spatially contiguous areas with a mean population of 1,500 and a minimum of 1,000 which are designed to be relatively socially homogenous and constrained to 2003 ward boundaries. They have advantages over wards of being smaller, relatively stable over time and of a more consistent population size. They have the advantage over enumeration districts of having boundaries determined by the character of the population, including size, mutual proximity and social homogeneity,Footnote 2 rather than roads or other physical features. There were 32,482 LSOAs derived in 2004 in England. Summary measures are also produced at local authority district level and county council level. More recently, they have also been used to estimate child poverty at constituency level.Footnote 3
The IDACI is quite widely employed. It was used to represent material well-being in an index of child well-being at the small area level (Bradshaw et al., Reference Bradshaw, Noble, Bloor, Rhodes, Sinclair and Wilkinson2009). The 2010 Child Poverty Act imposes an obligation on local authorities to undertake an annual Child Poverty Needs Assessment, and many local authorities rely on the IDACI to produce their needs assessment.
Born in Bradford (BIB)
The Born in Bradford (BiB) cohort study provides an opportunity to examine the relationship between area-based ranking of deprivation by the IDACI and self-reported deprivation in ethnically diverse areas. Bradford is a northern industrial city suffering long-term economic decline. It is in the lowest decile of local authorities in the Index of Deprivation, with more than 50 per cent of LSOAs in the three bottom deciles (Department for Communities and Local Government, 2010). It also has a large ethnic population, mainly of south Asian extraction. BiB is unusual in collecting survey data on a large local population of families with children. BiB collected self-reported benefit claims, relative financial situation and the number of material items afforded in the recruitment questionnaire at twenty-six to twenty-eight weeks gestation of cohort members. There is a relatively high proportion of enrolees (75 per cent of all pregnant women due to give birth at the Bradford Royal Infirmary between 2007 and 2010), and as BiB is broadly representative of the city's pregnant population we expected the population to represent families of pregnant women in a typical Bradford LSOA.
Methods
BiB data
BiB is a longitudinal multi-ethnic community birth cohort study aiming to examine the impact of environmental, psychological and genetic factors on maternal and child health and well-being (Wright et al., Reference Wright, Small, Raynor, Tuffnell, Bhopal, Cameron, Fairley, Lawlor, Parslow, Petherick, Pickett, Waiblinger and West2013). The data used in this study come from the recruitment questionnaire administered to women who consented to enrol in BiB at twenty-six to twenty-eight weeks gestation.
-
Ethnic group. Ethnicity data were used to populate the LSOA-based ethnic diversity classifications in Bradford. The ethnic group and cultural background questions in the recruitment questionnaire for BiB were based on those used in the UK's 2001 census and comprised one question asking which ethnic group the mothers considered themselves belonging to (White, Mixed ethnic group, Black or Black British, Asian or Asian British, Chinese or other), followed by a further question, based on their response, about cultural background (for example, Asian or Asian British could further select either Pakistani, Bangladeshi, Indian Caribbean or African-Indian).
-
Ethnic diversity. We calculated area-based diversity in order to characterise areas of low, mixed and high minority ethnic inhabitants. These three area types were our main comparator for analysis. Using each woman's self-reported ethnic group and cultural identity, we constructed a variable (‘area type’) that classified each LSOA as comprising three levels of diversity: ≥80 per cent White British (‘White British’ area type), ≥20 per cent to <80 per cent White British (‘Mixed’ area type), and <20 per cent White British (‘Minority ethnic’ area type). Our main interest was in comparing the White British areas to the Minority ethnic areas, but we retained the Mixed areas as an intermediary comparator. Women were not classified according to their own self-reported ethnicity, but by the majority ethnicity of all BiB mothers living in their LSOA. The classifications accorded well with data from the 2011 census, indicating that BiB mothers were broadly representative of the whole population in these small areas. In the Minority ethnic area types, 80 per cent of women were of Pakistani origin, 6 per cent were White British, 4 per cent were Indian, 4 per cent were Bangladeshi, 2 per cent were Black and the remaining 4 per cent were of other ethnic origin or mixed or multiple ethnicity.
-
Parity. The IDACI includes a Child Tax Credit component and was calculated for children; thus the index denominators are children in each LSOA. We reasoned that income would be lower in families with born children due to loss of earning power, benefit claimants would be higher due to this reduced income and the number of children would affect entitlement. To improve congruity with family factor measures by the IDACI, we used parity from the BiB cohort to restrict our analysis to the 60 per cent of women who already had born children at their time of enrolment. Around 40 per cent of BiB mothers with recruitment questionnaires had no previous pregnancy. The figure varied with ethnicity; white women were more likely and South Asian women less likely to be nulliparous. We used parity as indicated in the hospital's maternal record. If this was missing (~6 per cent), we used the mother's self-reported parity; and if this was missing, we took as multiparous the second or third BiB pregnancy. Data from any one of these sources were not available for 2.5 per cent of women, and these cases were dropped. In cases of multiple births, we dropped duplicated responses and selected one pregnancy at random if the mother had enrolled in BiB multiple times over the course of several pregnancies. We used the number of previous children for descriptive, but not analytic purposes.
-
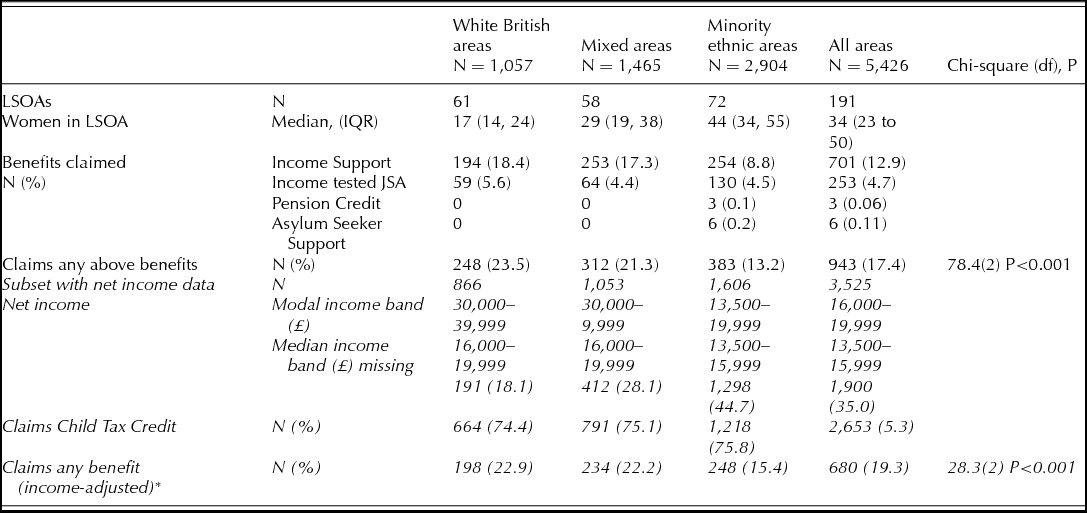
Self-reported benefits and income data. We also aimed to explore variation in benefits claimed in areas of varying diversity. Mothers were asked to indicate which benefits she and her husband or partner received. We calculated the proportion of women claiming each benefit using the same categorisation as those used to derive the IDACI: Income Support, Income-based Jobseeker's Allowance (JSA), Pension Credit and Asylum Seeker Support. Child Tax Credit claimants were also used to derive the IDACI, but this requires the use of household income data, which were only collected in two out of the three phases of BiB enrolment. Where they were collected, around a third of women did not know their post-tax (net) household income or did not answer, and Pakistani women were disproportionately represented in the missing data group (Table 2). Where they were reported, we used equivalised net income according to the modified OECD formula (First Adult = 0.67, Spouse = 0.33, Children aged under fourteen years = 0.20, Children aged fourteen years and over = 0.33). As the questions were related to parity, we were limited to the mother's natural children (and not adopted or step-children), and could not account for children who might not be living with their mother. Because the BiB questions related only to net income for the mother and her partner, no incomes were estimated for other adults living in the house. The 60 per cent Before Housing Costs (BHC) median values for each fiscal year (April‒March), tied to year of BiB enrolment, were taken from the DWP reports on ‘Households Below Average Income’.Footnote 4 Median weekly income for a couple of adults in 2007/08 was £236, in 2008/09 £244, 2009/10 £248 and in 2010/11 was £251. A few cases (~20) where the age of children was not known were dropped. The proportion of claimants and non-claimants in each LSOA were calculated and aggregated to LSOAs within an area type of ethnic category.
The following two measures were used for comparison with the ranking of the area-based IDACI:
-
Score on the Material Wellbeing Scale (MWS). The twelve-item Family Resources Survey Adult Deprivation Questions is a measure of material deprivation assessed by responses to a list of items considered essential by the majority, and a brief assessment of debt (McKay and Collard, Reference McKay and Collard2003). We used this to calculate a MWS for each mother. The score was derived from a simple count of the number of questions to which the mother indicated they could not afford the item (I/we would like this but can't afford it at this moment). Responses of ‘I/we do not want/need this at this moment’ ranged from <0.1 per cent (keeping the house warm enough) to 43 per cent (a hobby or leisure activity). All responses in this category together with responses of ‘Don't know’ (<1 per cent to all questions except 8 per cent for household contents insurance) were classified with responses indicating the items could be afforded. If mothers did not provide a response to all the material deprivation questions, her response was set to missing.
Questions on the Material Well-being Scale (MWS):
Do you and your husband/partner have:
-
• Holiday from home for at least one week once a year?
-
• Two pairs of all-weather shoes?
-
• Family and friends for a drink or meal at least once a month?
-
• Enough money to keep home in decent state of decoration?
-
• Household contents insurance?
-
• Money to make regular savings of £10 a month?
-
• Money to replace any worn out furniture?
-
• Money to replace or repair major electrical goods?
-
• A small amount of money to spend on yourself each week?
-
• A hobby or leisure activity?
-
• Are you up to date with all these bills? (flashcard list of bills)
-
• In winter, are you able to keep your home warm enough?
-
-
Subjective financial well-being. This captures the adequacy of income to adequately sustain lifestyle and reflects strain (Arber et al., Reference Arber, Fenn and Meadows2014). We used the responses to a question about how the mother (and her partner if applicable) were managing financially. The first question asked women to endorse one answer on the following scale ‘Living comfortably’, ‘Doing alright’, ‘Just about getting by’, ‘Quite difficult’, ‘Very difficult’ or ‘Do not wish to answer’. Responses in the last category were set to missing.
IDACI data
IDACI 2010 rank scores for LSOA (Department for Communities and Local Government, 2010) were used.Footnote 5
Linkage and IDACI rank
We matched 2001 LSOA to postcodes at each mother's enrolment in BiB, and linked the area-based IDACI indicators and scores to each BiB family within that LSOA. We retained only LSOAs where at least ten BiB mothers lived. IDACI rank for England was categorised into rank decile for the retained Bradford LOSAs, with 1 being most deprived and 10 being least deprived.
Analysis
We generated summaries of family characteristics from the BiB recruitment survey and routine data for each area type (White British, Mixed and Minority ethnic). We calculated differences in area type and self-reported benefit claim rates, financial well-being and material well-being using chi-square tests. Stata release 12 (StataCorp LLP) was used for all analyses.
-
Correspondence of IDACI rank and self-reported financial status ‒ setting the threshold for self-reported measures. For each LSOA, we calculated the proportion of women in that LSOA classified as ‘at risk’ using the responses to the self-reported measures (MWS and the question about financial well-being). We calculated these proportions for all thresholds of each variable; for example ≥1, 2, 3 etc. items lacked on the MWS, and by combining different response categories on the financial well-being question. Using the Chi2 test for trend, we calculated whether the proportions classified as materially or financially deprived varied across the LSOAs organised by IDACI rank score in deciles for each measure at each threshold. A significant test indicates a decrease in the proportion reporting financial/material difficulties with decreasingly deprived IDACI ranks. Based on this statistic, the thresholds with the strongest associations with IDACI ranking were then used to estimate the correspondence between the two methods of ranking.
-
Assessing the correspondence between the two measures by ethnic density. We generated two indices for each LSOA: (1) IDACI rank and (2) the rank by the average proportion of those reporting financial/material difficulty at the thresholds described above. For this analysis, we ranked LSOAs within ethnic diversity grouping in order to examine correlation without the influence of overall ranking effects, necessary because the ranked position of LSOAs within Bradford varied by ethnic diversity. Accordingly, we used rank and not rank decile because of the smaller numbers of LSOAs within each ethnic group. We calculated the correlation between the two ranking methods at different thresholds using Kendall's tau-b statistic and its p-value (α = 0.05).
-
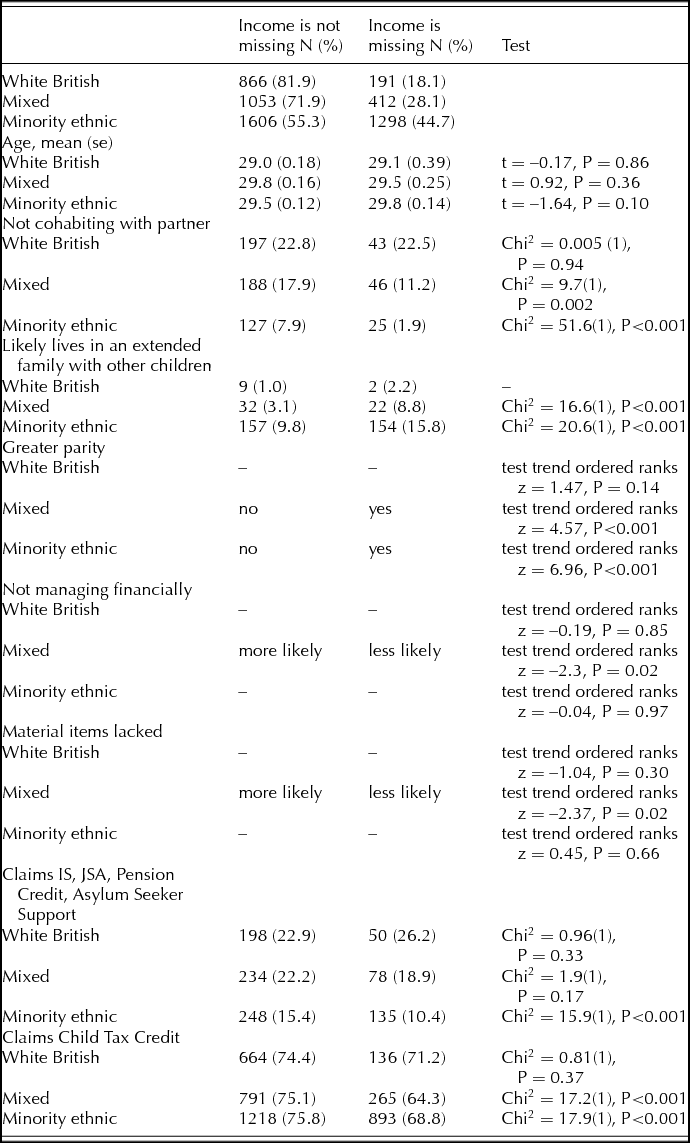
Missing data. We excluded 1,760 cases (14.1 per cent of enrolled women) where data were missing on the key variable. In 80 per cent of these cases, the women had enrolled into BiB but did not fill in the baseline questionnaire (Figure 1). To examine the effect of missing income data, we explored the demographic, material, financial and claimant status of women by whether they did, or did not, report income.
Figure 1.Study flowchart


Sensitivity analysis
The demographic, income and benefits data collected in BiB relate to the nuclear family unit, not to the household. Because the IDACI counts the proportion of children in households in an area, any area-based difference between families in households could affect our calculations. This could happen for example, if (1) minority ethnic BiB respondents were more likely to live in multi-family households, and (2) benefit-eligible women living in multi-family households were less likely to claim because they are supported by other family members, and/or (3) they became non-eligible after the benefit is means-tested using the total household income, and/or (4) they do not know what benefits were claimed by other household members. Detailed data on household structure and relationships were not captured in BiB, but the number of people living in the household in broad age bands (<2, 2–15, 16–17, 18–64, 65+) were collected in order to calculate overcrowding. In two of the three recruitment periods, women were asked about the age of their children, which we combined with the overcrowding data and marital/cohabitation status to approximate which women lived in multi-family households with other children aged fifteen or under. Blended (step) families and accuracy of self-report could not be accounted for using this approach. As sensitivity on the main analysis, we re-ranked results by the IDACI and the MWS, only including women we classified as living in non-extended households (there were too few extended households with other children with which to conduct an area-based analysis).
Results
Descriptives
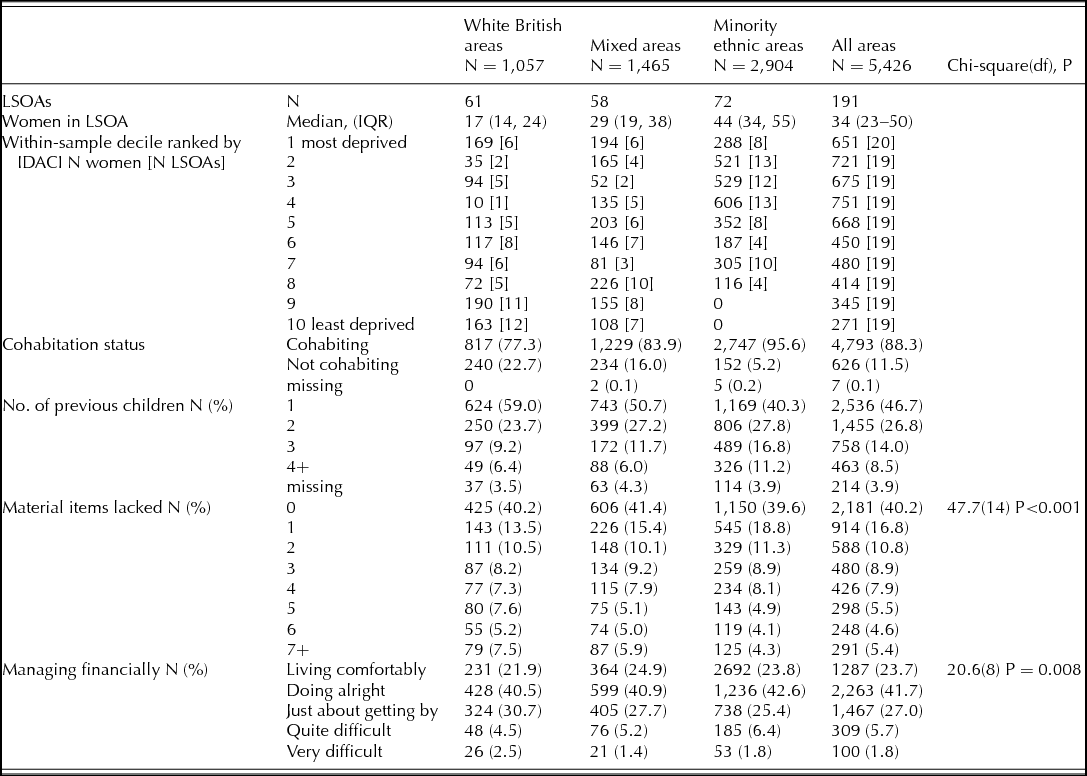
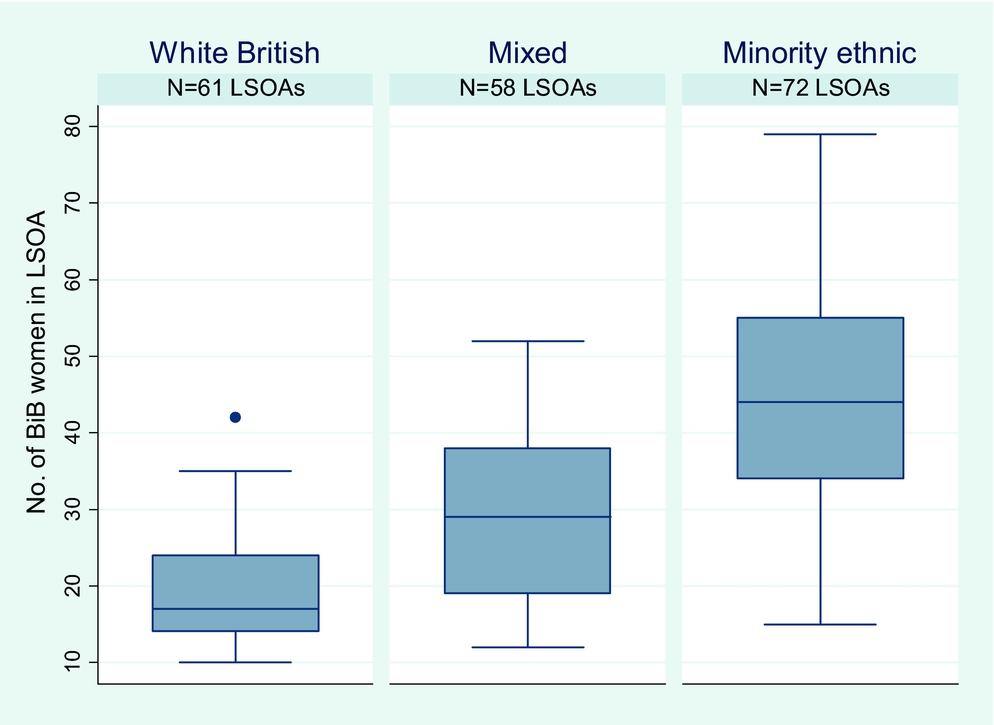
Our analytic sample comprised 5,426 multiparous pregnant women living in 191 LSOAs across Bradford, 46.4 per cent of the 12,453 BiB participants (Figure 1). There were more LSOAs classified as Minority ethnic areas (N = 72) than White British areas (N = 61) or Mixed areas (N = 58), and the number of women in the study living in Minority ethnic area types was higher (median 45 women per LSOA) than women living in White British (median 17 women) and Mixed area types (median 29 women) (Table 1 and Figure 2).
Sample descriptives

Note: df degrees of freedom.
Number of women in LSOAs by ethnic diversity

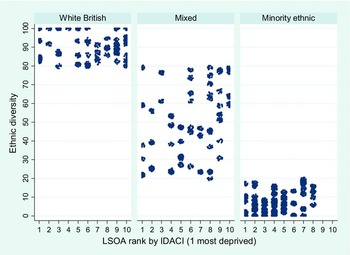
When the LSOAs were ranked by the IDACI, there were a larger proportion of Minority ethnic areas in deciles 2 and 3 and more White British area types in deciles 9 and 10 (no Minority ethnic area types were in these deciles) (Table 1 and Figure 3). For decile 3 and decile 4 (White British areas), there was only one LSOA containing a small number of women.
Distribution of LSOA rank by IDACI by ethnic diversity

Data are jittered to illustrate the position of LSOAs with fewer women in them (less dense markings). Diversity of area type is operationalised as ≥80 per cent White British in an LSOA = ‘White British’, ≥20 per cent to <80 per cent White British = ‘Mixed’, <20 per cent White British = ‘Minority ethnic’.
Demographically, women in Minority ethnic LSOAs had larger families than the other groupings of ethnic diversity. There was some variation between areas on the self-reported measures of material and financial well-being, but absolute differences between areas in each category measured were small (Table 1).
Women in Minority ethnic areas claimed less Income Support (8.8 per cent versus 18.1 per cent White British and 17.3 per cent Mixed), but roughly equal proportions of women in each area claimed Income-based Jobseekers Allowance (~5 per cent) (Table 2). Overall, women living in White British areas were nearly twice as likely as women living in Minority ethnic areas to claim any benefit (23.5 per cent versus 13.2 per cent). This ratio did not substantially alter after we included the income-adjusted Child Tax Credit claimants to the IDACI comparative measure using data from the subset of women on whom we had income data. This was despite the women living in Minority ethnic areas reporting lower income than that of the other two groups, but claiming similar rates of Child Tax Credit. Women in Minority ethnic areas were less likely to report their family's income. Those who did not report their income were more likely to live in an extended family (as defined by our approximate categorisation), live with a partner, have more of their own children and less likely to report claiming a benefit. However, these women did not report greater or less material deprivation or financial strain (Appendix 1).
Self-reported benefits claimed

Notes: *Claims Income Support, income tested Job Seekers Allowance, Pension Credit, Asylum Seeker Support or Child Tax Credit (if under the 60 per cent median income threshold) equivalent to IDACI measure but only calculated for the subset of women who reported their income; df degrees of freedom.
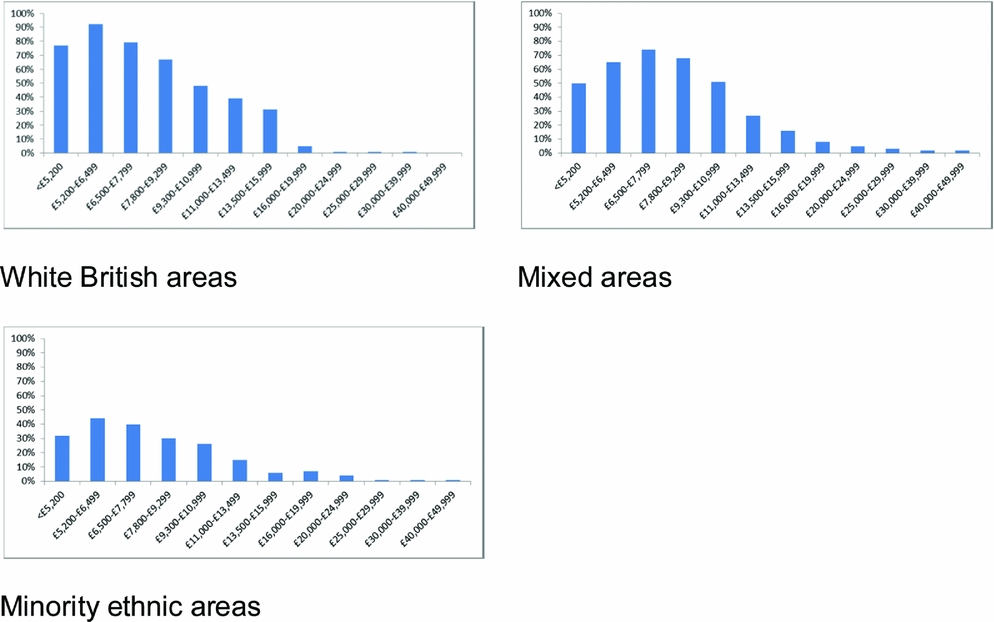
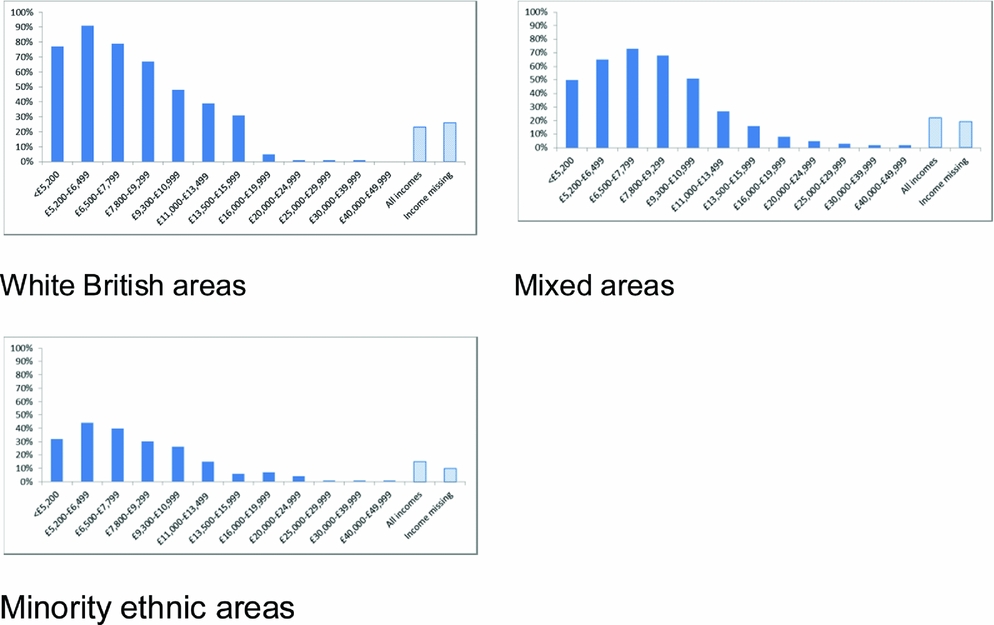
The proportion claiming benefits in each net income band varied across area types (Figure 4). For example, for women reporting net incomes of £9,300–£10,999, 26 per cent of women living in Minority ethnic areas reported claiming benefits compared with 48 per cent of women living in White British areas. We found a similar average percentage of those claiming benefits excluding Child Tax Credit by those with and without income data, indicating our results were unlikely to be biased by missing data (Appendix 2).
Percentage claiming benefits in each income distribution band

Correspondence between IDACI rank and self-reported measures
The purpose of these analyses was to select thresholds for the self-reported measures against which to test correlation between areas of different ethnic density.
-
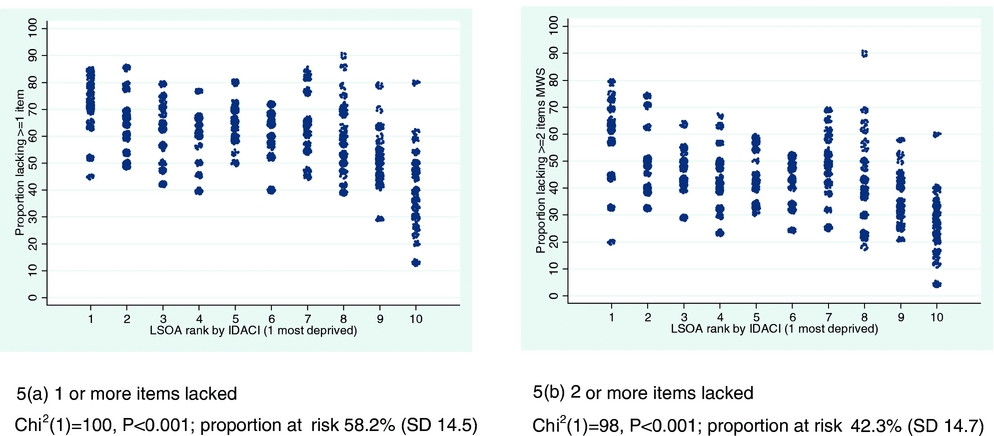
Material well-being scale. Tests for trend indicated that all thresholds of up to eight or more items lacked correspondence with rank by the IDACI. The strongest associations were for 1 or more (best) and 2 or more (Figure 5). Within each decile, there was a large range of estimates for the proportion at risk on the self-reported measure for each LSOA. For example, in decile 1 of Figure 5(a), 45 per cent of women in one LSOA lacked 1 or more items, compared to 85 per cent of women in another.
-
Self-reported financial status. Statistically significant but weaker associations were seen between this question and rank by the IDACI than for the MWS. The strongest association was seen at the categorisation of Living comfortably vs everyone else; however, as this classified 76 per cent of women at risk (data in Appendices), we tested only the MWS 1 item or more lacked in following analyses.
-
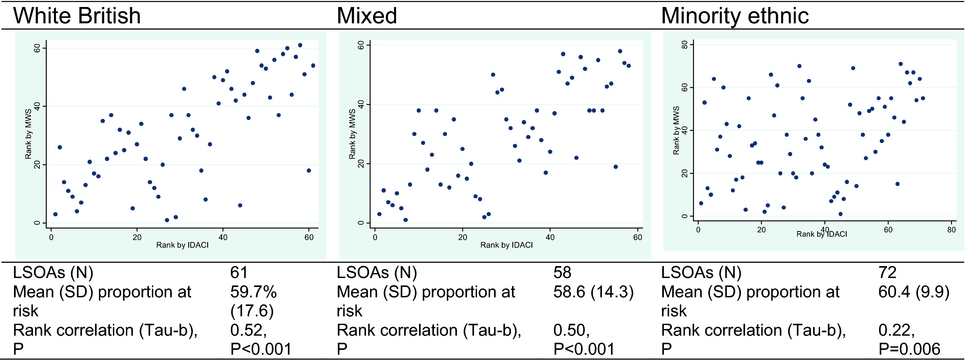
Correlation between ranking by the IDACI and ranking by the MWS. We ranked the LSOAs on both the IDACI score and the proportion of women with ≥1 item lacked on the MWS scale within each diversity group, resulting in two sets of ranks for each of the three types of areas. The correlation between the two ranking systems was statistically significantly greater than zero for all groups of areas, but weaker for the Minority ethnic data (CC = 0.22) compared to the White British (CC = 0.52) and Mixed data (CC = 0.50) (Figure 6). Correlation for Minority ethnic groups of areas was influenced by several LSOAs ranked as low deprivation by the IDACI but with high proportions of women lacking at least one item on the MWS.
-
Sensitivity analysis excluding women living in extended households. We classified 7.8 per cent of women as living in households that were potentially extended with children; 1.2 per cent of women in White British area types, 4.2 per cent in Mixed and 12.1 per cent in Minority ethnic area types. After recompiling the diversity area types excluding extended households, the number of LSOAs classified as Minority ethnic decreased from seventy-two to sixty-eight. Findings were essentially unchanged by excluding extended families in the Minority ethnic areas (CC = 0.20, P = 0.016, compared with CC = 0.22, P = 0.006 for all women in these areas), indicating that women living in potentially extended families did not exert a large influence on the results. Findings for the other two area types were also unchanged.
Items lacked on MWS against LSOAs ranked by IDACI Note: All women in all areas (N = 191 LSOAs); Chi2 test for trend of odds over ranked deciles; scatter plots are jittered

Correlation between ranking by MWS ≥1 item lacked and ranking by IDACI

Discussion
Summary of key findings
We aimed to assess the ranking of local area deprivation by area-based administrative data (the IDACI) against individual self-reported information in a multi-ethnic community. We found that mothers living in areas characterised by less than 20 per cent White British population were less likely to report claiming a benefit than women living in areas of high White British or mixed populations, despite reporting lower incomes. The correlation between self-reported material difficulties in LSOAs and worsening IDACI rank of those LSOAs was also much lower in areas characterised by large minority ethnic populations than areas of large White British populations, and mixed populations.
Interpretation of findings
Benefit claim rates
Estimates of benefit non-take-up in 2009–10 were 11–23 per cent for Income Support, 37–40 per cent for JSA and 17–21 per cent for Child Tax Credit (Finn and Goodship, Reference Finn and Goodship2014). Our analysis provides some preliminary evidence that women living in areas of minority ethnic populations may be less likely to claim benefits compared to women living in other areas. There are several interpretations of this finding.
The first is that women living in areas of higher minority ethnic population claim the benefits that they are entitled to, but are entitled to proportionally fewer benefits because of higher incomes and less need. If this is true, then the IDACI is valid across areas of different ethnic diversity. On the one hand, our findings do not support this assumption as self-reported income is much lower in the areas of higher minority ethnic population, benefit claiming was lower across all income bands and their families tend to be larger, indicating more financial strain. On the other hand, the BiB income question was asked about net income for the mother and her partner, and not household income, and this could give a misleading representation of the financial situation for women who live in extended families, whose incomes might be boosted by economic activity from family members. Women living in such families might find it harder to estimate their net income, or might systematically under-report it. It is possible that the women who did not know or report their net income, who were disproportionally Pakistani, have skewed our findings, although we did not find any evidence of this. Others have illustrated that benefit-supplemented incomes are more likely to be under-reported (Micklewright and Schnepf, Reference Micklewright and Schnepf2009). The impact of other predictors of income under-reporting, such as self-employment incomes and low-incomes, on our findings are harder to unpick. For example, women living in Minority ethnic areas reported that the baby's father was more likely to be self-employed than those living in White British areas, but they were less likely to be managers or be in technical or craft employment (data not shown); factors related both to income under-reporting and low incomes. Interestingly, the proportion of women claiming Child Tax Credit across all three area types were similar. Further detailed work is necessary to understand the reporting of individual and family incomes and benefit take-up in minority ethnic families. Restricted eligibility to claim benefits apply to non-citizens and non-residents and newly immigrated workers (Platt, Reference Platt2007) which may explain our study's findings of lower claim rates for apparent need in Minority ethnic areas. If so, this may indicate a limitation of the IDACI to accurately rank deprivation across areas of varying diversity.
A second interpretation rests on the assumption that the benefit claim rates and self-reported incomes are not distorted; and that is that women living in areas of high minority ethnic density do not claim the benefits to which they are entitled. If this is true, then the IDACI may not rank these areas with dense minority ethnic populations accurately relative to other areas. Because the direction of the error will be to rank these areas as less deprived, this has the potential to under-represent areas of potential need. Our findings support this interpretation, because although LSOAs of high minority ethnic density tended to be ranked as more deprived by the IDACI, this was not true of the most deprived decile where 40 per cent of LSOAs in our sample were of high minority ethnic density compared to 60–68 per cent of the second, third and fourth most deprived.
A third possibility is that our results are compromised because some mothers were unaware that their husband or partner claimed benefits. If minority ethnic women were less likely to know that benefits were being claimed in their families, this may account for the lower self-reported claim rate in Minority ethnic areas. Over 40 per cent of women in Minority ethnic areas could not report their families’ income, and it is reasonable to posit that they also did not know about benefits claimed. Women in minority ethnic areas who did report their incomes, however, still had lower self-reported benefit claim rates than women living in White British or Mixed area types (15 per cent vs. 23 per cent). While there were lower claim rates for women living in extended households, our sensitivity analysis indicated that any potential effect of differences in claim behaviours, income knowledge and material wealth of women living in extended households on our results were not large and thus unlikely to have substantially affected our findings. We were not, however, able to accurately ascertain the demographic structure to definitively categorise extended households and could only approximate household structure for 93 per cent of the women included in the main analysis.
While an analysis of the Family Resources Survey (2003‒08) found that benefits were more likely to comprise a larger portion of minority ethnic women's total income (Nandi and Platt, Reference Nandi and Platt2010), this may not be related to claim rates because total incomes are much lower in minority ethnic groups (Kenway and Palmer, Reference Kenway and Palmer2007). There is a lack of national data showing claim rates compared with eligibility and need across a range of benefits (Allmark et al., Reference Allmark, Salway, Crisp and Barley2010), but barriers to benefit take-up by potential minority ethnic claimants have been identified (Law et al., Reference Law, Hylton and Karmani1994; Ipsos MORI, 2011), indicating the potential for disparity.
Association between the IDACI and self-reported material well-being
In our analysis, the MWS corresponded with ethnic diversity ranking by the IDACI, but the association was less strong for the minority ethnic areas. Again, alternative explanations for this finding are founded on a number of assumptions. Firstly, we assume that the MWS is a good indicator of material deprivation related to low incomes. One measure of the relationship between the MWS and poverty is whether the items on the MWS are considered ‘necessary’. One such validation exercise undertaken in the 2009 ONS Omnibus Survey showed that while 95 per cent of parents thought it essential to keep the accommodation warm enough in winter, only 31 per cent thought it essential to have friends around once a month (McKay, Reference Mckay2011). Overall, only six out the twelve questions were considered as essential by an accepted threshold of >50 per cent of raters (McKay, Reference Mckay2011). We did not weight items according to perceived necessity as this method has been shown to be of little advantage (Treanor, Reference Treanor2014). We assume that the relationship between the items, necessity and poverty are the same for women of different ethnic groups, but have little evidence to substantiate this assumption. Both the MWS and the IDACI have limitations as poverty and deprivation indicators. Using material deprivation as an unbiased measure of poverty requires meeting strict assumptions about the baseline of acceptable living standards and sensitivity to low income at the bottom of the scale (Berthoud and Bryan, Reference Berthoud and Bryan2010). Administrative data counting benefit claim rates assume that people on benefits are in poverty, and undercounts the effect of in-work poverty (Hirsch and Valadez, Reference Hirsch and Valadez2014). Nonetheless, if both are taken to indicate deprivation, then our area-based analysis suggests variation by ethnic density.
We found less association between the question on relative financial security and the IDACI compared to similar analyses using the MWS. Again the association between this question and absolute levels of poverty and necessity are debateable, as a relatively wealthy mother living in a less deprived area might have expenditures that cause her to rate her financial situation the same as a low income mother living in a deprived area. Differences in responses by ethnicity due to reference norms are also a possibility. For example, recent immigrants migrating from a country with fewer resources might be more likely to rate their current situation more favourably than those who have lived in England for longer, at the same level of absolute poverty.
Strengths
This analysis is an important contribution to debates around the reliability of administrative data on benefits in estimating area-based poverty, particularly child poverty. Assumptions about varying rates of take-up are often made but rarely tested. The ability to use detailed individually reported survey responses alongside findings from administrative data, both at small area level, is a strength of this analysis. In addition, the nature of Bradford means that we were able to explore areas of different ethnic diversity and different income and poverty levels.
Limitations
There were limitations to our analysis. Although our results indicate that women in Minority ethnic areas appear to claim fewer benefits for reported income than other women, we are unable to definitively state this is based on need. A significant proportion of Pakistani women did not know or report information relating to finances, which decreased our ability to use directly reported net income data. We were unable to triangulate or verify income data with partners, which would have strengthened our analysis. We are more confident of reliability of responses on items lacked and subjective financial well-being. BiB is a sample of pregnant women in Bradford and as such represents only a subset of families living in LSOAs, and this sample may not be representative. However, we checked our categories of ethnic diversity against total populations in the census for each LSOA and found broadly similar results. In some cases, families in LSOAs were represented by only a few women and although we did not analyse LSOAs containing fewer than ten BiB mothers, variation due to averaging small numbers may have affected our results. We analysed self-reported data over a three-year period that include and predate the IDACI compilation, and variation in claim rates and eligibility may have distorted our findings.
This project is a case study in one area and Bradford is distinctive in terms of its degree of deprivation and migration history. It may be that relationships between some of the variables assessed are different in Bradford than in other areas of England (as well as varying between different populations and area types within Bradford). We recommend further work to support possible improvements to the IDACI across England by validating and testing whether the results found in Bradford hold in other parts of the country.
Conclusions
In our case study, women living in areas of high minority ethnic population density appear less likely to report claiming benefits than women living in areas of high White British or mixed populations. This implies that in the IDACI, the level of deprivation in areas of high ethnic density may be systematically under-estimated. These are, however, preliminary findings from a limited analysis of a specific and in some ways unusual area, but, due to the wide use of indices like the Index of Multiple Deprivation and the IDACI, we feel further research is required. We support further investigation into the performance of area-based deprivation measures in ethnically dense and ethnically diverse areas, including the accuracy of self-reported data in some minority ethnic groups.
Acknowledgements
This article presents independent research funded by the National Institute for Health Research Collaboration for Leadership in Applied Health Research and Care Yorkshire and Humber (NIHR CLAHRC YH). The views and opinions expressed are those of the authors, and not necessarily those of the NIHR or the Department of Health. Born in Bradford (BiB) has been possible only because of the enthusiasm and commitment of the children and parents who participated. The authors are grateful to all the participants, health professionals and researchers who made BiB happen.
Comparison between women reporting, and not reporting, the families’ income

Percentage claiming benefits in each income distribution band (excluding Child Tax Credit)