On August 1, 2012, we prepared a forecast of the 2012 presidential vote for PS. Our model contains two variables: (1) the cumulated weighted growth in leading economic indicators (LEI) through quarter 13 of the current presidential term and (2) the incumbent party candidate's share in the most recent trial-heat polls, which were for the month of July. What mostly distinguishes our model from others is the reliance on leading indicators from the quarter ending in March of the election year. The early reading of LEI works well as a predictor because it summarizes growth in the economy leading up to the election year and also provides advance indication of changes in the economy during the election year. The exact equation and the exact forecast change as the poll readings change during the election year.
Our forecast, published in PS (Erikson and Wlezien Reference Erikson and Wlezien2012a), based on trial-heat polls in July, was that Barack Obama would win 52.6% of the two-party popular vote. This turned out to be quite close to the Election Day outcome, which is 51.8% as of this writing (November 28, 2012). Contributing to the forecast of Obama's (close) reelection was that the LEI numbers were slightly above the average of the previous 15 presidential cycles.Footnote 1 These numbers pointed to economic expansion during the election year, which did materialize, at least to some extent; what may be most important is that public perceptions trended positive leading up to Election Day (see Erikson and Wlezien Reference Erikson and Wlezien2012a).
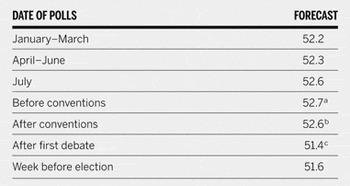
The forecasts made at different points in the election year were largely unchanged from this “official” forecast based on July polls. Details are shown in table 1. Most notably, the model including our measure of LEI and polls from January–March predicted a 52.2% vote share for Obama. The value of this model with quarter 13 LEI and quarter 13 trial-heat polls is that it allows prediction of the November vote early in the election timeline, long before trial-heat polls by themselves provide a useful prediction (Erikson and Wlezien Reference Erikson and Wlezien2012b).
Forecasts of the Obama Vote Share at Different Points in 2012

Note: Based on models with trial-heat polls measured at various points in the campaign timeline. The equations are all based on data from 15 elections between 1952 and 2008. Poll data for 2012 are from Real Clear Politics.
a In the equation, poll data are from 11 weeks before the election, consistent with one week before the Republican 2012 convention.
b In the equation, poll data are from 8 weeks days before the election, consistent with one week after the Democratic 2012 convention.
c In the equation, all poll data is from 4 weeks before the election, consistent with one week after the first 2012 presidential debate.
We can also check how our forecast prevails if we substitute trial-heat polls later than July. Table 1 includes subsequent forecasts that we made, based on equations using recent trial-heat polls conducted at those points later in the campaign timeline. There we see that models of the vote from dates before and after the conventions yielded virtually no changes in the forecast (52.6% or 52.7% Obama). The first debate shifted the forecast of the Obama vote downward, but only slightly. Using a model including polls after that debate, we predicted a 51.4% share for Obama. This is a little less than the president received on Election Day.
ACKNOWLEDGMENTS
We thank Stuart Soroka for helpful comments.