


Voter mobilization is an essential component of the electoral strategy of parties in every part of the world. When the ballot is secret, parties seek to ensure that voters that are likely to support the party turn out to vote (e.g., Cox and Kousser Reference Cox and Kousser1981; Nichter Reference Nichter2008). Common mobilization strategies—including door-to-door or telephone campaigns, transporting voters to the polling station, and turnout buying—rely on the superior knowledge of local mobilizers about the political preferences of individual voters, which enables them to identify supporters that would not have otherwise turned out. Mobilizers may not require payment when their interests are aligned with their party’s.Footnote 1 However, parties must often hire brokers without aligned incentives.
In this article, we focus on voter mobilization through hired brokers. While the exchange of goods for voters turning out is widely reported in developing contexts (e.g., Nichter Reference Nichter2008; Nichter and Palmer-Rubin Reference Nichter, Palmer-Rubin, Dominguez, Greene, Lawson and Moreno2014), such turnout buying is not uncommon in the developed world.Footnote 2 Despite the apparent extent of this phenomenon—which has the potential to substantially alter electoral outcomes (Keefer Reference Keefer2007), and is illegal in many countries—little is understood about the conditions that explain its prevalence.
As far as turnout buying can be gauged, it varies substantially across localities and political parties. Theoretical work has only recently begun to explore when parties pursue different electoral strategies (Gans-Morse, Mazzuca, and Nichter Reference Gans-Morse, Mazzuca and Nichter2013), and has yet to incorporate the principal-agent relationship between parties and brokers. In this article, we extend existing theory and exploit a natural experiment in Mexico to address a major question in the voter mobilization literature: when do political parties hire brokers to mobilize potential voters?
While previous research has primarily focused on the monitoring problem between parties and voters under a secret ballot (e.g., Cox and Kousser Reference Cox and Kousser1981; Nichter Reference Nichter2008; Stokes Reference Stokes2005), limited attention has been paid to the relationship between parties and political brokers. This relative neglect is surprising given that brokers typically implement voter mobilization strategies on election day because they are better informed about the preferences of individual voters than political parties (e.g., Finan and Schechter Reference Finan and Schechter2012; Stokes et al. Reference Stokes, Dunning, Nazareno and Brusco2013). Stokes et al. (Reference Stokes, Dunning, Nazareno and Brusco2013) treat this interaction between parties and brokers principally as a selection problem for political parties seeking to employ the best-connected brokers. However, because brokers are often hired contractors rather than actors with incentives closely tied to political parties, this misses a critical moral hazard concern: political parties hire brokers to mobilize likely supporters that would not otherwise turn out, but brokers face strong incentives to shirk given that parties cannot easily monitor their actions.
Guided by this party-broker monitoring problem and our qualitative understanding of party-broker relations in Mexico, we formalize a simple model predicting the conditions under which parties hire brokers to mobilize voters. In our model, voters vary in their cost of voting—determined by the distance to their polling station—and their ideological affinity, which determines their preference over parties. To capture differential knowledge of voter types, we assume parties do not observe the preferences of individual voters, whereas local brokers know which party each voter would vote for if they turned out. Parties thus hire political brokers to mobilize their pool of “potential voters”—favorable voters that face prohibitive costs of turning out. Brokers can exert costly effort to provide voters with incentives to turn out. However, the probability that a party is able to infer broker effort after the election varies across electoral precincts. Given that brokers will shirk if they believe their lack of effort they can go undetected and still receive payment, parties can buy more turnout in locations where their monitoring capacity is greater.
Furthermore, the magnitude of the positive effect of monitoring capacity on turnout buying differs across political parties and depends on the distance of voters to the polling station. First, parties that are relatively popular among rural voters—who face higher costs of traveling to vote—have the most to gain from the greater broker effort that increased monitoring capacity permits. Conversely, there are fewer potential voters for predominantly urban parties to mobilize. Second, where the cost to brokers of mobilizing voters increases sharply with distance, hiring brokers becomes prohibitively costly—even for predominantly rural parties—once voters live sufficiently far from the polling station. Among parties that do well in rural areas, our model thus predicts an “inverted-U” relationship between the average distance of voters to the polling station and turnout buying. Among urban parties, the increasing cost of hiring brokers quickly overpowers the declining pool of potential voters as the distance to the polling station increases.
We take these theoretical insights to the data in Mexico. Despite emerging from seven decades of one-party rule by the Institutional Revolutionary Party (PRI) in the 1990s, Mexican elections are still characterized by clientelism and electoral mobilization. We focus on turnout buying—which occurs outside deeply embedded clientelistic structures (see, e.g., Cornelius Reference Cornelius, Dominguez and Lawson2004; Diaz-Cayeros, Estévez, and Magaloni Reference Diaz-Cayeros, Estévez and Magaloniforthcoming; Fox Reference Fox1994; Magaloni Reference Magaloni2006)—just before and especially on election day. Mexico’s main political parties continue to engage in extensive turnout buying, offering gifts in exchange for turning out and illegally hiring buses and taxis to drive voters to polling stations.Footnote 3 Brokers hired by political parties play the essential intermediary role in this process, mobilizing voters on election day in exchange for cash and bonuses (or sanctions) based on local electoral performance (Ugalde and Rivera Loret de Mola Reference Ugalde, de Mola, Ugalde and de Mola2013).
To test the model’s predictions for party vote shares, we leverage two sources of variation. First, differences in monitoring capacity arise from an electoral rule requiring that a new polling station is created for every 750 registered voters in an electoral precinct. Qualitative evidence indicates that political parties use polling station-level electoral outcomes to reward their brokers. Each additional polling station allows the party to better distinguish the effort of their broker from voter-level shocks affecting turnout. Information from more electoral returns thus increase the signal-to-noise ratio surrounding the effect of broker effort on electoral outcomes, allowing the party to better detect when their broker has shirked. Since new polling stations are constructed adjacent to existing polling stations, the cost of traveling to the polling station remains constant. Second, we exploit variation in political preferences and the cost of voting by calculating the average distance that voters must travel to their precinct’s polling booth. Like many other developing countries, including India, South Africa, and Thailand, Mexico’s urban-rural political divide means that more rural precincts where the average voter lives further from the polling station are less likely to turn out and more likely to support a particular party—the PRI, in the case of Mexico.
We use a regression discontinuity design to compare polling stations in essentially identical electoral precincts just above and just below the threshold for creating a new polling station. Our results provide evidence of turnout buying consistent with our theoretical model: each additional polling station increases electoral turnout by around one percentage point, significantly increasing the vote share of the right-wing National Action Party (PAN) and especially the PRI. The vote share of the Party of the Democratic Revolution (PRD), which has recently campaigned against vote-buying practices and likely inherited the weakest political machines from the PRI, is unaffected.
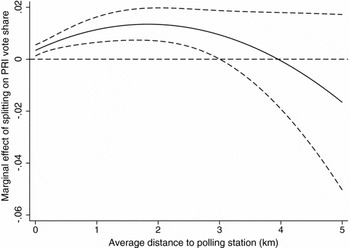
Following our theoretical model, we also examine how the effect of an additional polling station varies with distance. Consistent with our theory, the increase in the PRI vote at the discontinuity is nonlinear in distance. At the effect’s peak—where, on average, voters live around 1.5 km from the polling station—the PRI gains the vote of more than one percent of registered voters. This interaction is if anything instead negative for the PAN, who stand to gain less from mobilizing rural voters. These heterogeneous effects also dismiss alternative explanations. First, reduced waiting time at the polling booth cannot explain why there is no increase in PRD votes or why the effect on the PRI votes is nonlinear with distance from the polling station. Second, if parties were buying votes rather than turnout, we would expect to instead observe that an additional polling station would differentially benefit the PRI in urban areas and benefit the PAN and PRD in rural areas.
Although our estimates only account for around a 2.5 percent increase in votes for the PRI and PAN, our empirical strategy only focuses on a single dimension of monitoring that can be cleanly identified. Furthermore, given that the differences in monitoring capacity are relatively small, our estimates are quite substantial. Ultimately, our results demonstrate the importance of monitoring in explaining differences in turnout buying across parties and geographic locations, but may only point at the tip of the iceberg of turnout-buying practices.
Our theoretical argument contributes to a nascent literature focusing on the intermediary role of political brokers.Footnote 4 This literature departs from extant work assuming that parties do not require brokers or that broker interests are always aligned with their parties. Whereas Stokes et al. (Reference Stokes, Dunning, Nazareno and Brusco2013) treat hiring brokers as an adverse selection problem and Camp (Reference Camp2012) focuses on the collective action problem for brokers, our model emphasizes the moral hazard problem arising from the party’s inability to always monitor broker effort. While Larreguy (Reference Larreguy2013) focuses on the signal extraction problem for brokers mediating clientelistic relationships, our model shows how heterogeneity in voter preferences and the costs of voting causes parties to face differential incentives when mobilizing voters outside clientelistic structures. Third, our model extends Gans-Morse, Mazzuca, and Nichter (Reference Gans-Morse, Mazzuca and Nichter2013) by introducing an agency problem that unlinks party strategies from voting outcomes. While their model suggests that the party-voter monitoring problem increases turnout buying, we show that the party-broker monitoring problem instead decreases turnout buying.
Empirically, our results extend the existing literature in several ways. First, unlike previous studies examining the effects of institutions on vote buying (Cox and Kousser Reference Cox and Kousser1981; León Reference León2013), we instead explain variation in turnout buying and exploit a powerful research design to identify causal effects consistent with our monitoring explanation. Second, we identify the conditions under which parties interact effectively with brokers in a way that observational accounts cannot (e.g., Levitsky Reference Levitsky2014; Stokes et al. Reference Stokes, Dunning, Nazareno and Brusco2013; Szwarcberg Reference Szwarcberg2012a; Wang and Kurzman Reference Wang, Kurzman and Schaffer2007). Finally, our study provides further evidence for the occurrence of turnout buying (see, e.g., Nichter and Palmer-Rubin Reference Nichter, Palmer-Rubin, Dominguez, Greene, Lawson and Moreno2014), and suggests—like recent studies of vote buying (Cantú Reference Cantú2014a; Finan and Schechter Reference Finan and Schechter2012; Gingerich Reference Gingerich2014; Gonzalez-Ocantos et al. Reference Gonzalez-Ocantos, De Jonge, Meléndez, Osorio and Nickerson2012; Vicente Reference Vicente2014)—that it can be effective at gaining votes. Fourth, our findings reinforce claims from contexts as diverse as Chicago, Colombia, and India that political parties use disaggregated electoral information to monitor the performance of their brokers (e.g., Rakove Reference Rakove1976, Rueda Reference Rueda2013).Footnote 5
The article is structured as follows. We first provide a qualitative overview of elections and the role of brokers in Mexico. The following section presents our theoretical model. We then describe our data and explain our identification strategy, before presenting our results. We conclude with a discussion of our findings.
QUALITATIVE EVIDENCE OF ELECTORAL MANIPULATION IN MEXICO
Mexico has experienced a long history of electoral malpractice. During its 71-year stranglehold on power extending back to 1929, the PRI was widely acknowledged to have engaged in clientelistic transfers, vote buying, and electoral fraud (e.g., Cornelius Reference Cornelius, Dominguez and Lawson2004; Magaloni Reference Magaloni2006). After allegations of widespread vote rigging in the 1988 elections, and the rise of stronger challengers to the PRI’s dominance, election monitoring—principally through the creation of the independent Federal Electoral Institute (IFE)—has become more effective at preventing the most flagrant electoral violations (Cornelius Reference Cornelius, Dominguez and Lawson2004).
However, according to an abundance of qualitative evidence contained in newspaper articles, surveys, and election reports, Mexico’s main political parties—particularly the PAN and the PRI—continue to pressure voters using more subtle tactics. This has occurred in spite of the PRI’s ultimately victorious 2012 Presidential candidate, Enrique Peña Nieto, promising to break from the electoral manipulation often associated with the PRI. Unlike the PAN, which ceased to vocally campaign against electoral manipulation after winning the presidency in 2000, such opposition remains an important feature of the PRD’s election campaigns, despite the belief that the PRD inherited the PRI’s machines in states where it split from it (e.g., Guerrero and Michoacán). In this article, we focus on when parties engage in turnout buying.
Vote and Turnout Buying
National legislative elections in Mexico are held every three years, with all of the House of Deputies and half of the Senate facing election to nonrenewable three- and six-year terms respectively. Of Mexico’s 500 Deputies, 300 are elected by plurality rule from single-member districts, while the remainder are elected via proportional representation. Furthermore, Presidential elections—which are the most hard fought—occur concurrent to every other legislative election.
On election day, mobilization efforts are organized locally. Reports of voters receiving gifts, including money, food, clothing, and gift cards, from political parties are extensive. Although gifts that are not conditional on voting for a particular party are legal under Mexican law, vote buying—where gifts are exchanged for voting a particular way—is illegal and is still regarded as a regular phenomenon. In 2012, a list experiment conducted before Mexico’s 2012 election found that 22% of voters received a gift from a political party (Nichter and Palmer-Rubin Reference Nichter, Palmer-Rubin, Dominguez, Greene, Lawson and Moreno2014). One of the most egregious examples from 2012 was the widely reported allegation that the PRI distributed millions of gift cards for the supermarket Soriana. Voters were told that these cards would become active upon the PRI winning the 2012 election, and this significantly increased the PRI’s vote share in PRD strongholds (Cantú Reference Cantú2014a). Based on their election monitoring, Alianza Cívica estimated that a vote costs 100–800 pesos (8–60 U.S. dollars).Footnote 6
However, not all gifts and incentives are provided in exchange for voters switching their vote intention. Given the difficulty of parties and brokers monitoring voter behavior once inside the polling booth, voters may renege on their promises with impunity (Stokes Reference Stokes2005).Footnote 7 When voters cannot be effectively monitored, Nichter (Reference Nichter2008) finds in Argentina that parties skirt the commitment problem by instead mobilizing voters that they expect to support the party but would not otherwise turn out to vote. Consistent with such turnout buying, Nichter and Palmer-Rubin (Reference Nichter, Palmer-Rubin, Dominguez, Greene, Lawson and Moreno2014) found that gifts were most frequently targeted at weak PRI supporters.
One of the most widespread turnout buying practices, acarreo, involves transporting voters to polling stations. Acarreo is illegal under Article 403 of the Mexican Federal Penal Code. Nevertheless, newspaper accounts from across the country reported extensive use of acarreo in 2012 by hired coaches and especially groups of taxi drivers.Footnote 8 Alianza Cívica reports that the proportion of voters brought to polling stations increased in both 2009 and 2012 to reach 14%.Footnote 9 Transportation of this sort appears to have been particularly prevalent in areas where the polling station is not easily accessible to voters. Although the PAN and PRD have also been accused of engaging in acarreo, it has predominantly been associated with the PRI. In fact, one report suggests that the PRI attempted to disguise its taxis with PRD stickers.Footnote 10 Another popular practice, known as operación tamal, entails gathering a large group of voters together for breakfast before transporting them to the polling station in exchange for additional gifts.Footnote 11
The Role of Brokers
Given the scale and extensive information requirements of such turnout buying operations, parties often hire nonparty local operatives to implement these strategies on the ground. These political brokers are typically designated to electoral precincts, and possess detailed knowledge of the vote intentions of the local population that state and municipal officials lack.Footnote 12
Political brokers—who provide transportation, round up groups of potential voters, monitor voting at polling stations, and distribute gifts—are available to the highest bidder (Ugalde and Rivera Loret de Mola Reference Ugalde, de Mola, Ugalde and de Mola2013).Footnote 13 In general, brokers are paid throughout the campaign and receive a bonus—in terms of either cash or political favors—for strong electoral performance (Ugalde and Rivera Loret de Mola Reference Ugalde, de Mola, Ugalde and de Mola2013). Taxi drivers can be paid up to 2,000 pesos (150 U.S. dollars) for a day’s work repeatedly ferrying voters to polling stations in their electoral precinct.
Since the monitoring problem between parties and brokers is less severe than that between parties and voters, monitoring brokers is more feasible than monitoring voters. However, given the small scale of broker activities and their inability to verify whether brokers are truly targeting favorable voters that would not have voted otherwise, it is both costly and difficult for parties to directly monitor performance.
The challenge for parties is to differentiate the effects of broker activity from other factors determining local vote outcomes. In some areas, parties request lists of voters whom the broker intends to bring to the polling station. These lists can be cross checked using the “bingo system,” whereby party representatives at the polling station on election day with access to the list of citizens that voted compare the two lists (Mercado Reference Mercado, Ugalde and de Mola2013). Figure 1 depicts an example of such a list embossed with the PRI logo, where the broker would fill in the address, electoral precinct, and voter ID of voters they promise to bring to the polls.
List of Promised Voters for the PRI to be Completed by a Political Broker in a Given Electoral Precinct

However, in most locations parties rely upon electoral outcomes to measure broker performance. Based on interviews with Mexican politicians, Ugalde and Rivera Loret de Mola (Reference Ugalde, de Mola, Ugalde and de Mola2013) explain that parties evaluate the effectiveness of their voter mobilization apparatus at the precinct or polling station level, rather than at the voter level. Realizing that parties cannot easily identify departures from agreed efforts to mobilize voters, brokers have an incentive to shirk. Consequently, where brokers fail to meet electoral expectations, a strong indication of shirking, payments, or rewards can be withheld.
THEORY OF TURNOUT BUYING
This section first formalizes a simple model of the relationship between parties, brokers, and voters. We then show how the model’s predictions apply in the Mexican context, and generate testable hypotheses for our empirical analysis.
Formal Model
Our model examines turnout buying by political parties using brokers at the electoral precinct level. The key feature of the model is the moral hazard problem faced by political parties: parties hire political brokers with the local knowledge required to mobilize favorable local voters, but cannot always effectively monitor the effort exerted by political brokers in this task. Where parties are better able to monitor brokers, they can generate more electoral support by engaging in more extensive turnout buying. The second main feature of the model is that voters’ political preferences and costs of turning out, as well as the cost of compensating brokers, vary with their distance from the polling station. Depending on the location of their supporters, parties face differential incentives to use brokers to mobilize voters facing high costs of turning out.
Setup
Consider a country containing N electoral precincts. At each electoral precinct there exists a continuum of voters, whose mass we normalize to unity. Electoral precincts differ in the distance d > 0 that voters must travel to their polling station. For simplicity, all voters at a given polling station travel the same distance.Footnote 14 Importantly, electoral precincts also differ in the probability p ∈ (0, 1) that political parties can perfectly infer the behavior of their broker. Although parties never fully observe broker behavior in practice, this simplifying assumption captures our main point that in some precincts parties are more capable of reliably inferring broker actions from electoral returns.Footnote 15 Without loss of generality, we consider an electoral precinct defined by distance d and probability p of observing broker effort.
Parties
. We consider two political parties i = A, B competing for votes in each electoral precinct. Parties maximize their vote share Π
i
in the precinct.Footnote
16
However, although parties are aware of their underlying support in any given precinct, they cannot themselves identify which supporters to mobilize. Party i thus chooses an effort-wage contract
 $(\hat{e}_i,\hat{w}_i)$
to induce a single broker to exert effort ei
∈ [0, 1] to mobilize voters that favor party i. If the party observes the broker’s effort and the broker complied with the agreed effort level, such that
 $e_i\ge \hat{e}_i$
, then she receives wage
 $\hat{w}_i$
; if the broker is found to not have complied with the agreed effort level, then she receives no payment.Footnote
17
If the party cannot observe ei
, the broker receives wage
 $\hat{w}_i$
.
Brokers . Political brokers enjoy an informational advantage over political parties: brokers can identify the individual voters in their electoral precinct that would vote for party i if they turned out.Footnote 18 To keep the model tractable, we assume that brokers cannot discriminate between voters by their likelihood of turning out to vote, and thus exert effort ei equally across voters that would vote for party i.Footnote 19 This simplification is also empirically plausible because brokers are not always completely aware of individual costs of voting, or cannot exclude specific voters when mobilizing large groups, while voters that always turn out may defect if they do not receive gifts from their preferred party (Diaz-Cayeros, Estévez, and Magaloni Reference Diaz-Cayeros, Estévez and Magaloniforthcoming; Nichter and Peress Reference Nichter and Peress2014). Furthermore, to focus on the moral hazard dimension of the problem, we assume that all brokers are equally effective at mobilizing voters.Footnote 20
However, exerting effort ei
—which could constitute calling in favors, hiring coaches and drivers, or providing material incentives to voters—entails a cost
 $C(d,e_i) = \frac{1}{2}\gamma _i d e_i^2$
to the broker, where γ
i
> 0 is the cost parameter for mobilizing supporters of party i. Consequently, exerting no effort is costless to brokers, while the cost of exerting additional effort is convex and increasing in d. If brokers are not hired by political parties, we assume they receive zero utility. Conditional upon engaging in a contract with party i, a strategy for a broker is to choose their effort level ei
.
Voters
. Voters in each electoral precinct differ in the ideological shock σ toward party B that they receive.Footnote
21
This ideological shock is an expressive benefit (e.g., Brennan and Hamlin Reference Brennan and Hamlin1998; Gans-Morse, Mazzuca, and Nichter Reference Gans-Morse, Mazzuca and Nichter2013), such that it is only received by voters when they turn out and vote for their preferred candidate.Footnote
22
The shock is distributed over support
 $\left[-\frac{1}{2\psi \,\, },\frac{1}{2\psi \,\, }\right]$
, where a large ψ > 0 implies that variation in the expressive value of voting is low, according to the following density function (drawn independently of d at each polling station):
 $$\begin{eqnarray}
g(\sigma ; d) = \psi\,\, [1-b(d)\sigma].
\end{eqnarray}$$
This distribution function formalizes our insight that the ideological shock depends upon the distance to the polling station through b(d) ∈ [− ψ, ψ], where b is a monotonic function.
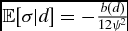
Integrating over the distribution of ideological shocks, the expected ideological shock toward party B, in an electoral precinct of type d, is
 $\mathbb {E}[\sigma |d] = -\frac{b\left( d\right) }{12\psi \,\, ^{2}}$
. The term b(d) represents the bias in favor of party A. Party A benefits on average in electoral precincts where b(d) > 0, because this reduces the likelihood that voters receive a pro-B ideological shock. In competitive precincts, where b(d) = 0, the vote is split equally in expectation. To capture rural-urban divisions, we assume b′(d) > 0 such that party A gains relatively more support vis-à-vis party B as the distance to the polling station increases.Footnote
23
Voters also face a cost of turning out to vote. We define this cost as
 $c(d,e_i) = \alpha d(1-e_i) \in [0,\frac{1}{\psi \,\, }]$
, where α > 0 is a cost parameter. The cost of voting thus increases in the distance d to the polling station, but this can be counteracted by broker mobilization effort ei
. A strategy for a voter receiving ideological shock σ is the decision to vote for party A, party B, or not turn out: v(d, eA, eB
; σ) ∈ {A, B, ∅}. Since brokers only target voters with an ideological shock toward their party, a voter only ever receives incentives to turn out from the broker of one party.
Timing . Finally, the game proceeds as follows:
-
1. Parties i = A, B offer brokers a contract
 $(\hat{e}_i,\hat{w}_i)$
to induce voters to turn out.
-
2. The ideological shock σ is realized for all voters, but is only observed by voters and brokers.
-
3. A broker employed by party i exerts effort ei to mobilize its voters.
-
4. Voting occurs according to v(d, eA, eB ; σ), and eA and eB are respectively observed by parties A and B each with probability p.
-
5. The election outcome and broker payment occur, and payoffs are realized.

We now proceed to identify the contracts that define the subgame perfect Nash equilibrium (SPNE) of this game.
Equilibrium
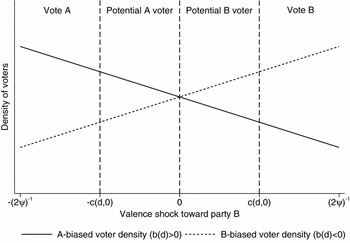
The central component of the contracting problem is the number of voters that political parties can expect brokers to mobilize to turn out. Absent broker inducements to turn out (ei = 0), voters always vote for party B if σ ⩾ c(d, 0), and always vote for party A if − σ ⩾ c(d, 0). However, if c(d, 0) > |σ|, a voter will not turn out without inducements. Figure 2 depicts this graphically for a given distance d, showing that only voters receiving a large expressive benefit of voting for their preferred party turn out. The solid density function depicts a case where A benefits on average, while the dotted density function depicts a case where B benefits on average.
Vote Choices at a Given Polling Station

Since individual vote choices cannot be bought, political parties care about mobilizing their potential voters—voters who would vote for the party if they reached the polling booth, but do not vote because the cost of turning out is too high.Footnote 24 In Figure 2 these are the voters for whom the absolute value of the ideological shock is less than c(d, 0). Party i hires a broker to exert effort ei to mobilize their potential voters. Integrating over the distribution of voter ideologies, the share of the electorate voting for each party at any given level of broker effort is
 $$\begin{eqnarray}
\Pi ^A(d,e_A) &\equiv & \frac{1}{2} + \frac{b(d)}{8\psi \,\, }\nonumber\\
&& -\, \psi\,\, c\left( d, e_A\right) \left[1 +\frac{1}{2}b\left( d\right) c\left( d,e_A\right)\right],
\end{eqnarray}$$
 $$\begin{eqnarray}
\Pi ^B(d,e_B) &\equiv & \frac{1}{2} - \frac{b(d)}{8\psi \,\, }\nonumber\\
&& -\, \psi\,\, c\left( d, e_B\right) \left[1 -\frac{1}{2}b\left( d\right) c\left( d,e_B\right)\right].
\end{eqnarray}$$
The second term reflects the average bias toward party A in an electoral precinct where the distance to the polling station is d. The final term in each expression captures the central features of the model. First, an increase in the cost of voting, c(d, ei ), reduces the number of votes each party receives, but increases the number of potential voters that could be mobilized. Second, A has relatively more potential voters (as well as guaranteed voters) if the bias is in their favor (b(d) > 0). Third, and most importantly, holding e fixed, A’s number of potential voters increases with distance from the polling station because b′(d) > 0. The effect of distance on B’s number of potential voters is only positive when the bias toward A is small and b′(d) is not too large. Consequently, party A generally has a stronger incentive to engage in turnout buying, and especially in rural areas, because it can mobilize more favorable voters.
Both parties maximize Π
i
(d, ei
), and have incentives to engage in turnout buying since the final term in Eqs. (2) and (3) is decreasing in ei
. However, parties must offer brokers a contract
 $(\hat{e}_i,\hat{w}_i)$
to induce a given level of turnout buying effort.Footnote
25
To achieve their desired level of broker effort, two constraints must be satisfied: brokers must choose to undertake the contract in the first place (individual rationality (IR) constraint), and then be induced to exert the desired level of effort (incentive compatibility (IC) constraint). In particular, the IC constraint induces the broker to exert effort
 $e_i=\hat{e}_i$
at cost C(d, ei
),Footnote
26
rather than choose ei
= 0 and receive
 $\hat{w}_i$
if their shirking is not caught (with probability 1 − p) and receive zero when their shirking is caught (with probability p). Party i thus solves the following program:
 $$\begin{eqnarray}
\nonumber \max _{\hat{e}_i,\hat{w}_i} && \Pi ^i(d,\hat{e}_i) - \hat{w}_i \text{ subject to } \\
&& (IC): \hat{w}_i - \frac{1}{2}\gamma _i d \hat{e}_i^2 \ge (1-p)\hat{w}_i, \\
\nonumber && (IR): \hat{w}_i - \frac{1}{2}\gamma _i d \hat{e}_i^2 \ge 0.
\end{eqnarray}$$
Solving this problem leads immediately to our equilibrium result:
Proposition 1 When γ
A
+ pψ α2
db(d) > 0 and γ
B
− pψ α2
db(d) > 0, there exists a unique SPNE
 $[(\hat{e}_A^*, \hat{w}_A^*), (\hat{e}_B^*, \hat{w}_B^*), e_A^*, e_B^*, v^*(d, e_A^*,e_B^*; \sigma )]$
defined by
 $$\begin{eqnarray*}
&&e_A^{\ast} = \hat{e}_A^{\ast}\\
&& \quad = \left\{
\begin{array}{@{}l@{\quad }l@{}}
0 & \text{if } 1 + \alpha d b(d) \le 0 \\
\frac{p\psi\,\, \alpha [1 + \alpha d b(d)]}{\gamma _A + p\psi\,\, \alpha ^2 d b(d)} & \text{if } 1 + \alpha d b(d) > 0 \text{ and } \gamma _A > p\psi\,\, \alpha \\
1 & \text{otherwise } \end{array}\right. \\
&&e_B^{\ast} =\hat{e}_B^{\ast}\\
&&\quad = \left\{
\begin{array}{@{}l@{\quad }l@{}}
0 & \text{if } 1 - \alpha d b(d) \le 0 \\
\frac{p\psi\,\, \alpha [1 - \alpha d b(d)]}{\gamma _B - p\psi\,\, \alpha ^2 d b(d)} & \text{if } 1 - \alpha d b(d) > 0 \,{\rm and }\, \gamma _B > p\psi\,\, \alpha \\
1 & {\rm otherwise } \end{array}\right. \\
&&\hat{w}_{i}^{\ast} = \frac{\gamma _i d e_i^{*2}}{2p}, \\
&&v^{\ast}(d, e_{A}^{\ast}, e_{B}^{\ast}; \sigma ) = \left\{
\begin{array}{@{}l@{\quad }l@{}}
L & \text{if } \sigma \le -c(d, e_{A}^{\ast}) \\
\emptyset & \text{if } \sigma \in {(}-c(d, e_A^{\ast}),c(d, e_B^{\ast}){)} \\
R & \text{if } \sigma \ge c(d, e_B^{\ast}) \end{array}\right..
\end{eqnarray*}$$
Equilibrium turnout is T(d, e* A , eB *) ≡ ∑ i ∈ {A, B}Π i (d, e* i ).
All proofs are in the Online Appendix.
In equilibrium, parties offer brokers a contract to just induce optimal effort. The optimal amount of effort reflects two competing forces: the effectiveness of brokers at procuring additional votes, which depends crucially on the number of potential voters, and the cost of effort—adjusted for the probability of being monitored—for which the broker must be compensated. The conditions for the existence of an equilibrium, given at the beginning of Proposition 1, guarantee that the maximization problems of both parties are well defined. An interior solution for each party exists under two intuitive conditions provided in the proposition. First, the bias b(d) toward the other party is never large enough that there are insufficient potential supporters of a party for it to be able to justify the cost of hiring a broker to mobilize voters. Second, γ i must be sufficiently large to prevent a party from always mobilizing all voters.
Comparative Statics
The following proposition identifies the central testable predictions of the model:
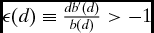
Proposition 2 In the unique SPNE identified in Proposition 1, the following comparative statics hold at any interior solution:
-
1. T, eA , and eB are increasing in p.
-
2. Let
$\epsilon (d) \equiv \frac{db^{\prime }(d)}{b(d)}>-1$
and γ
i
> 2pψ α. Then-
(a) There exists a
$\overline{d}_A>0$
such that the effect of p on e*
A
is increasing in d for
$d\in (0,\overline{d}_A]$
and strictly decreasing in d for
$d>\overline{d}_A$
. -
(b) The effect of p on e* B is decreasing in d.
-


Part 1 has a simple interpretation: increased monitoring capacity increases turnout buying by both parties. Intuitively, this is because parties can better monitor their brokers and can therefore more effectively threaten brokers with receiving a low wage. Consequently, parties can obtain more turnout buying for a relatively low wage.Footnote 27
The most novel predictions of the model concern the effect of distance to the polling station on the impact of increased monitoring on turnout buying. While Part 1 of Proposition 2 shows that greater monitoring capacity always increases turnout buying, Part 2(a) shows that this effect is increasing in distance for party A until the distance becomes sufficiently large.Footnote 28 In other words, monitoring’s impact on party A’s turnout buying is greatest at intermediate distances. As the distance to the polling station increases, there are more favorable voters for party A to buy, both because more rural voters favor party A and because their turnout is lower. However, the cost of hiring a broker to mobilize distant voters becomes prohibitively large for voters living sufficiently far from the polling station, despite their high support for party A. This nonlinear prediction holds under two conditions. First, ε(d) > −1 implies that the elasticity of bias with respect to d is never too negative. In other words, this assumption implies that the urban-rural divide is greater than any bias toward B. Second, γ i > 2pψ α implies that the cost to brokers of exerting effort relative to the cost to voters of turning out is sufficiently large. If hiring brokers was both cheap and highly effective, then both parties would often mobilize virtually all voters.
The final part of Proposition 2 shows that the effect of monitoring capacity on turnout buying changes with distance very differently for party B. In particular, the increase in turnout buying due to greater monitoring capacity is lower when voters live further from the polling station. Intuitively, this is because party B—which does well primarily among urban voters—has fewer potential voters to mobilize in precincts where the distance from the polling station is large, in addition to having to pay brokers higher wages in such precincts.
Observable Implications for Mexico
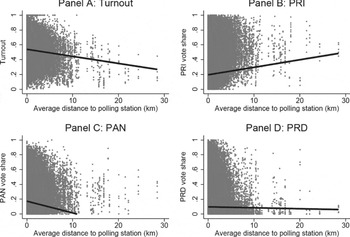
The theoretical model has clear predictions for our Mexican case, to which the model applies well. Most regions of Mexico are dominated by two large parties: between 2000 and 2012, only 14% of electoral precincts had a third party with more than 20% of the vote. Furthermore, as consistently shown in U.S. studies (see Brady and McNulty Reference Brady and McNulty2011; Gimpel and Schuknecht Reference Gimpel and Schuknecht2003), Figure 3 demonstrates that polling station turnout declines with the average distance to the polling station. Moreover, as discussed above, there is considerable qualitative evidence pointing to the importance of local brokers in mobilizing voters for a given party at the precinct level.
Polling Station Turnout (as a Proportion of Registered Voters) and Vote Share (as a Proportion of Turnout), by Average Distance of Voters to the Polling Station

A central prediction of the model is that turnout buying—captured by an increase in the total number of votes for a party—is more prevalent where parties are more effective at monitoring their brokers. This is because monitoring reduces the incentive for brokers to shirk. Although monitoring could work in a variety of ways, this article focuses on how the number of polling stations within an electoral precinct affects turnout. In particular, we argue that a larger number of polling stations improves monitoring capacity by producing multiple signals of broker performance.
Intuitively, parties struggle to differentiate voter-level shocks from the turnout buying effort of their brokers when examining precinct-level electoral returns. For example, if all voters vote at a single polling station and the party experiences electoral performance below its expectations, it is difficult to disentangle whether this was due to a negative voter-level shock or because the broker shirked. An additional polling station, and thus an extra signal of electoral performance, allows parties to better differentiate random voter-level shocks that affect their vote share from broker effort. Observing more signals of precinct-level performance always conveys more information unless the shocks are perfectly correlated.Footnote 29 For example, if voters are randomly allocated across polling stations parties will expect broker efforts to equally affect voting across all polling stations in a given electoral precinct. After observing poor electoral performance in a precinct but a large difference between polling stations, the party infers that an abnormal voter-level shock was the main determinant of lower electoral performance, and thus cannot blame the broker for the electoral outcomes. In sum, additional information always improves monitoring capacity, regardless of the number of brokers operating in an electoral precinct.Footnote 30
Given that we cannot observe broker effort empirically, we focus on the implications for electoral outcomes. We therefore hypothesize that
H1. Turnout and the share of votes for each political party (both as a proportion of registered voters) increases in the number of polling stations (monitoring capacity) in an electoral precinct.
Mexican politics is also defined by a rural-urban divide. The PRD and especially the PAN are best supported in more urban areas, among educated voters, and where clientelistic ties are weaker. Conversely, the PRI continues to win a large proportion of more rural voters. Figure 3 illustrates these relationships, and clearly indicates that b′(d) > 0 generally holds (where the PRI can be regarded as party A and the PAN or PRD as party B). In some southern areas where the PAN and PRD are locally dominant, the rural-urban division is less salient. Accordingly, b′(d) ≈ 0 and any interaction between distance and turnout buying should be weaker. In this case, we expect the effect of monitoring to decline with distance or not depend on distance. Combining these insights with the second part of Proposition 2, we only expect the effect of monitoring on turnout buying to depend nonlinearly on distance for the PRI:
H2. The effect of an improvement in monitoring capacity on the PRI vote share (as a proportion of registered voters) will first increase in distance from the polling station before decreasing. The effect of an improvement in monitoring capacity on the PAN and PRD vote share will instead decrease or exhibit no relationship with distance.
EMPIRICAL DESIGN
This section first describes the data used to test the hypotheses derived above. We then explain how we exploit a discontinuity in the number of polling stations in an electoral precinct to estimate the effects of monitoring on turnout buying. Given that we cannot directly observe turnout buying, we also examine heterogeneous effects by distance to the polling station to ensure that our findings are consistent with the monitoring effects predicted by the model in ways that cannot be explained by alternative theories.
Data
Mexico’s 300 electoral districts are divided into around 67,000 electoral precincts. These, as will be explained in more detail below, are in turn composed of polling stations. The average precinct contains 1.97 polling stations. The IFE has collected detailed polling station level data since 2000, including the coordinates of polling stations for recent election years. We use these data to analyze polling station electoral returns for the 2000, 2003, 2006, 2009, and 2012 national legislative elections (excluding the Federal District). Combined, this produces a maximum sample of 561,256 polling stations.Footnote 31 Detailed variable definitions and summary statistics are provided in the Online Appendix.
Dependent Variables
We use two main measures of voting behavior. We first measure polling station Turnout as a proportion of the total number of voters registered at a given polling station. Turnout includes all votes for political parties or coalitions, including null votes and nonregistered votes. To measure the beneficiaries of increased turnout, we measure PAN/PRD/PRI vote share as the number of votes for the party as a proportion of the total number of registered voters. By not conditioning on turnout, this outcome is independent of the mobilization efforts of other political parties.
Independent Variables
To capture the ability of political parties to monitor their brokers, we measure the Number of polling stations in a given electoral precinct. Polling stations may contain up to 750 registered voters, while the number of registered voters in a precinct will play a central role in determining the number of voters per polling station (see below). With the formation of the IFE in 1990, precincts were redrawn to contain 750 voters. Demographic changes have since caused this number to change in some precincts.
To test the heterogeneous effects in H2, we computed the average Distance (in kilometers) of voters to their polling station. The average distance entailed calculating the electorate-weighted distance to the polling station among the set of registered voters in each electoral precinct using locality-level population data provided by the IFE.Footnote 32 Since all the polling stations in a given precinct in our sample are located in the same place, and we cannot distinguish the geographic distribution of voters registered at different polling stations within an electoral precinct, the weighted distance varies by precinct rather than polling station. Polling stations are almost invariably located in the largest locality in the precinct, and our measure is thus strongly correlated with population density and geographic area.Footnote 33 The average distance to the polling station is 0.2 kilometers.
Identification Strategy
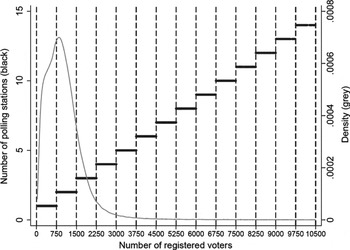
In order to identify the effects of changes in monitoring incentives on turnout buying, we leverage exogenous variation in the number of polling stations in an electoral precinct—and thus the capacity of political parties to monitor their brokers—that arises from Mexico’s electoral rules. Specifically, once the registered electorate in the precinct exceeds 750 (or any such multiple) due to demographic changes, an additional polling station is added and voters are reallocated equally between all polling stations. Figure 4 shows this procedure in our data.
Number of Polling Stations per Electoral Precinct

Each new polling station must be located in the same building or an adjacent building, and voters are divided alphabetically (by surname) between polling stations. The addition of a new polling station therefore does not affect the distance that voters must travel to vote. Given that surname does not predict voter behavior in Mexico (Cantú Reference Cantú2014b), the assignment of voters to polling stations is exogenous with respect to our voting outcomes.
We employ a regression discontinuity (RD) design to compare polling station returns in electoral precincts that just exceeded the threshold required to split into more polling stations to polling stations in precincts that fell just below the threshold. The “running variable” determining whether a precinct is treated with a new polling station is the number of registered voters in the electoral precinct. Given that new polling stations are created at each multiple of 750 voters, there exist many discontinuities (at 750, 1,500, 2,250, etc., voters). We pool all discontinuities by defining our running variable—Registered voters deviation—as the deviation from the nearest multiple of 750 registered voters in a given precinct, which ranges from − 375 to 375.Footnote 34 Our treatment indicator for an additional polling station in electoral precinct j at time t is defined by
 $$\begin{eqnarray}
\mathit {Split}_{jt} \equiv 1(\mathit {Registered \ voters \ deviation}_{jt}>0).
\end{eqnarray}$$
The RD framework identifies the local average treatment effect of an additional polling station under relatively weak assumptions. In particular, identification of causal effects at the discontinuity requires that potential outcomes are continuous across the discontinuity such that approaching the discontinuity precincts that were not split are effectively identical to those that were split (see Imbens and Lemieux Reference Imbens and Lemieux2008). We now verify the validity of this assumption.
Validity of the RD Design
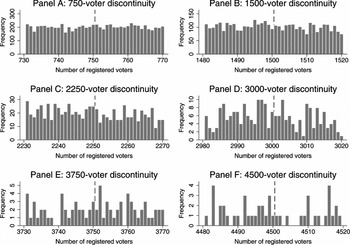
A key concern with any RD design is the possibility of sorting around the discontinuity. In our case, this could occur if electorate sizes or precinct boundaries are subject to political manipulation. Figure 5 shows that there is no evidence of systematic bunching around the first six discontinuities. This is particularly clear around the first two discontinuities where the vast majority of our data are located. Furthermore, a McCrary (Reference McCrary2008) density test similarly fails to reject the null hypothesis of equal density either side of each discontinuity.Footnote 35
Histograms of the Number of Electoral Precincts Either Side of the Discontinuity

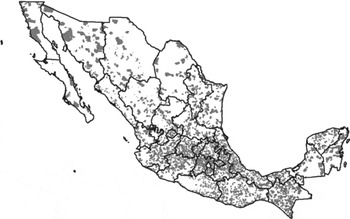
In the absence of bunching around the discontinuity, it is hard to imagine that electoral precincts with just above 750 registered voters systematically differ from those with just below 751. Nevertheless, we show that precinct splits are equally distributed across the country and that other variables are continuous at the discontinuity. Specifically, we consider precincts within 20 voters of being split to precincts that exceeded a multiple of 750 by less than 20 voters. This yields a sample of 26,697 polling stations from 13,452 precincts that were close to being split at a given election. As depicted in Figure 6, the 10,970 different electoral precincts that are included in our analysis at least once are equally distributed across the country.Footnote 36
Electoral Precincts Included in the Discontinuity Sample

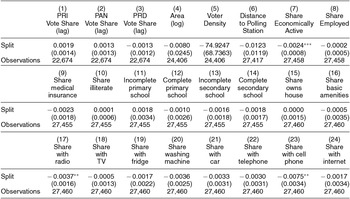
Table 1 presents 24 observable political, economic, and demographic characteristics of these polling stations, and shows that treated and control units are well balanced across these variables.Footnote 37 The few differences are extremely small relative to their sample means. Nevertheless, we include all variables as controls as a robustness check in the Online Appendix. Throughout we include district-year fixed effects to ensure that our results cannot be driven by any race, district, or state-specific variation such as local campaigning or state governorship.
Balance Checks—Splitting Polling Stations and Political, Economic and Demographic Characteristics of Electoral Precincts

Notes: Each coefficient estimates the effect of splitting a polling station on a pretreatment outcome, and is estimated separately from an OLS regression including district-year fixed effects. This is the form of our main specifications. Block-bootstrapped standard errors are clustered by state (1,000 resamples). Such specifications are identical to our main empirical analysis. *denotes p < 0.1, **denotes p < 0.05, ***denotes p < 0.01.
Estimation
We first estimate the effect of an additional polling station in an electoral precinct on polling station-level turnout and party vote share. Our RD design uses a narrow bandwidth, including only precincts within a bandwidth of 20 voters either side of the discontinuity. We estimate the following simple equation using OLS:
 $$\begin{eqnarray}
Y_{ijdst} = \beta \mathit {Split}_{jt} + \mu _{dt} + \xi _{ijdst},
\end{eqnarray}$$
where Yijdst is a voting outcome at polling station i in precinct j in district d in state s, and μ dt are district-year fixed effects. Throughout we conservatively cluster standard errors by state, computed using a block bootstrap based on 1,000 resamples. We show below that our results are insensitive to the choice of bandwidth and robust to including trends via a local linear regression.
To test the distance-specific predictions of the theory, we also estimate the following quadratic interaction specifications:
 $$\begin{eqnarray}
&&Y_{ijdst} = \beta \mathit {Split}_{jt} + \sum _{k=1}^2 \tau _{0k} \mathit {Distance}^k_j \nonumber\\
&&\quad+\, \sum _{k=1}^2 \tau _{1k} \bigg (\mathit {Split}_{jt} \times \mathit {Distance}^k_j \bigg ) + \mu _{dt} + \xi _{ijdst},
\end{eqnarray}$$
where
 $\mathit {Distance}^k_{j}$
measures the average distance of voters to the polling station(s) in precinct j. We use a quadratic interaction for simplicity, but obtain similar results using less parametric specifications. To demonstrate that distance is not simply proxying for another variable, we also control for interactions with our balancing variables as a robustness check.
RESULTS
Our results provide support for the theoretical model, and thus for the presence of greater turnout buying in areas where parties can better monitor the performance of their brokers. We first show a jump in turnout and PRI and PAN vote shares at the discontinuity determining the creation of a new polling station. Distinguishing our monitoring mechanism from potentially confounding explanations, we then show that the effect of an additional polling station increases and then decreases with distance—but only for the PRI. Finally, we show that our results are highly robust across a wide range of alternative specifications.
Average Effects of an Additional Polling Station
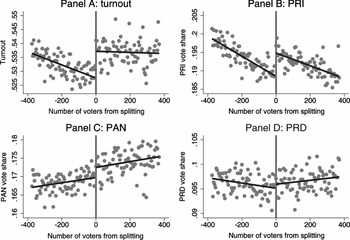
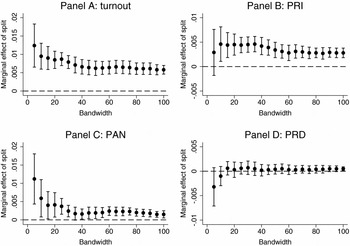
Before estimating equation (6), we first depict our variation graphically. Panel A of Figure 7 shows a jump in turnout of nearly one percentage point once a polling station is split. Panels B–D examine party vote share, and suggest that the PRI—traditionally Mexico’s most clientelistic and fraudulent political party—and the PAN—which held the presidency between 2000 and 2012—are the principal beneficiaries of adding a new polling station. Conversely, there is little evidence that the PRD, which has regularly denounced vote buying and likely inherited the weakest political machines from the PRI, experienced a change in their vote share. We now test these relationships more formally.
The effect of splitting polling stations on turnout and party vote share

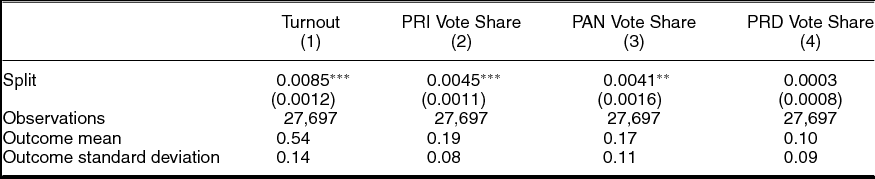
The regression results in Table 2 support the relationships highlighted in Figure 7. Column (1) shows that, on average, splitting a precinct increases polling station turnout by 0.85 percentage points. Given that average turnout is just over 50%, this represents nearly a two percent increase in the proportion turning out to vote. This finding is consistent with our argument (in H1) that parties are better able to monitor their brokers in electoral precincts with more polling stations.
Effect of Split Polling Station on Voting Behavior by Polling Station

Notes: All specifications include district-year fixed effects, and are estimated using OLS. All results are for a 20 voter bandwidth. Block-bootstrapped standard errors are clustered by state (1,000 resamples). *denotes p < 0.1, **denotes p < 0.05, ***denotes p < 0.01.
Columns (2)–(4) examine changes in vote share by party. The results reiterate that the PRI and PAN are the main beneficiaries, respectively increasing the number of votes they receive in the average precinct by 0.45 and 0.41 percentage points. This represents a 2.5 percent increase in both party’s vote share. The results imply that turnout buying is most frequently engaged in by the PRI, although the PAN is engaged in almost as much turnout buying. Given that the PAN and PRI were the largest parties between 2000 and 2012, on average, they stood to gain most votes from buying turnout; this is consistent with the predictions of our model.
Our findings for the PRI are supported by our accounts above and the existing literature. While apparently inconsistent with the literature on clientelism that highlights that clientelistic exchanges are concentrated among poor voters (Diaz-Cayeros, Estévez, and Magaloni Reference Diaz-Cayeros, Estévez, Magaloni, Kitschelt and Wilkinson2007, Weitz-Shapiro Reference Weitz-Shapiro2012), the results for the PAN—traditionally associated with middle-class voters—are probably driven by poor voters in urban and suburban areas. Furthermore, some accounts indicate that some PRI mayors pay taxi drivers for sticking the PAN logo in their cars and driving voters to the polls.
However, there is no evidence of PRD turnout buying. The coefficient in column (4), which is precisely estimated, indicates that an additional polling station does not increase the vote share of the PRD. The Online Appendix also confirms that even in states with a PRD governor, where turnout buying is likely to be most prevalent, there is no evidence that an additional polling station increases PRD turnout.Footnote 38 While consistent with the PRD’s campaigning, this finding might be counterintuitive since the PRD is known for endorsing former PRI candidates that bring their political machines with them (Garrido de Sierra Reference Garrido de Sierra2013a, Reference Garrido de Sierra2013b, Langston Reference Langston2012). A possible explanation is that those candidates switching to the PRD were those with the weakest machines. Garrido de Sierra (Reference Garrido de Sierra2013a) points out that defectors were often disgruntled PRI members who decided to leave the party after not being nominated as candidates, suggesting that they faced worse electoral prospects. Nevertheless, it is important to emphasize that the PRD could be buying turnout in a different way from the one which our empirical design captures.
Furthermore, our estimates imply that the methods of the PAN and PRI are fairly effective at identifying potential voters. Using the discontinuity as an instrument for turnout, 2SLS estimates (provided in the Online Appendix) show that the PRI vote share increases by 0.53 percentage points for every percentage point increase in overall turnout while the PAN vote share increases by 0.48 percentage points. Given that turnout buying by the PRI and PAN may be occurring simultaneously in some precincts, these estimates are almost certainly lower bounds on the proportion of mobilized voters that vote for the party mobilizing them. While this finding clearly fits with anecdotal and newspaper accounts of the election, it considerably exceeds survey estimates of the proportion of voters who reported that a gift influenced their vote choice or decision to turn out (e.g., Mercado Reference Mercado, Ugalde and de Mola2013, Nichter and Palmer-Rubin Reference Nichter, Palmer-Rubin, Dominguez, Greene, Lawson and Moreno2014). Our results therefore suggest that survey measures may suffer from considerable social desirability bias. However, because we do not observe the effort of brokers, we cannot truly evaluate the effectiveness of turnout buying by measuring the proportion of targeted voters that actually reach the polling station.
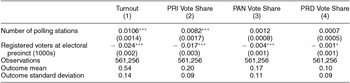
Although our identification strategy does not permit causal claims away from the discontinuity, Table 3 explores the correlation between the number of polling stations in an electoral precinct and voting in the full sample. Indicating that the discontinuity sample is relatively typical of the population, the outcome means and standard deviations are almost identical to those in Table 2.Footnote 39 The results paint a similar picture, with each additional polling station increasing turnout and support for the PRI. These estimates for an additional polling station are fairly similar to the RD estimates, and broadly support the validity of our estimates away from the discontinuity. Consistent with our qualitative account, the results suggest that PRI turnout buying is significantly more prevalent than PAN turnout buying on average across the country.
Correlation between Number of Polling Stations and Voting Behavior in the Full Sample

Notes: All specifications include district-year fixed effects, and are estimated using OLS. Block-bootstrapped standard errors are clustered by state (1,000 resamples). *denotes p < 0.1, **denotes p < 0.05, ***denotes p < 0.01.
However, other explanations could still account for these changes at the discontinuity. Although less likely, especially since there is no change in PRD vote share, increased turnout could reflect an increased incentive to turn out if the expected duration of queuing declines, or if electoral administration improves. Even if monitoring explains the discontinuous change in voting, our results could be capturing vote buying rather than turnout buying. To differentiate our theoretical explanation from such alternative interpretations, we test the heterogeneous effects by distance exclusively predicted by our turnout buying model.
Heterogeneous Effects of Additional Polling Stations by Distance
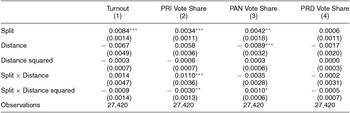
To test our hypothesis that increased monitoring capacity only translates into turnout buying when there exist potential voters that can be bought at relatively low cost, we estimate equation (7). The first, fourth, and fifth rows in Table 4 show the differential effects of an additional polling station by average distance to the polling station: the first coefficient identifies the effect of an additional polling station in urban areas where the distance to the polling station is essentially zero, while the two interaction terms (fourth and fifth coefficients) allow for the effect of splitting a polling station to vary with distance.
Effect of Split Polling Station by Distance

Notes: All specifications include district-year fixed effects, and are estimated with OLS. All results are for a 20 voter bandwidth. Block-bootstrapped standard errors are clustered by state (1,000 resamples). Locality-weighted distance to the polling station was unavailable for 347 electoral precincts. *denotes p < 0.1, **denotes p < 0.05, ***denotes p < 0.01.
We find nonlinear effects of monitoring capacity in line with H2. The interaction estimates in column (2) show that splitting a polling station particularly increases the PRI vote share in locations where voters are not too close but not too far from the polling station. Figure 8 illustrates the result graphically, showing that the effect of an additional polling station is maximized where the average voter lives around 1.75 km from the polling station.Footnote 40 Where the effect of monitoring is largest, the PRI vote share increases by nearly 1.5 percentage points, or nearly 10 percent of their total vote. These results for the PRI are consistent with our theoretical claim that the average effect at the discontinuity is picking up differences in monitoring capacity, rather than any other change associated with new polling stations.
Marginal Effect of Splitting Polling Stations on PRI Vote Share by Distance (with 95% Confidence Interval)

Conversely, column (3) shows that the benefits of splitting polling stations for the PAN operate very differently. Comparing the estimates in the first row, we find that the PAN benefits slightly more from turnout buying than the PRI in the most urban areas where a polling station serves only one locality. Unlike for the PRI, but consistent with H2, this effect does not increase with distance. Rather, the PAN vote share generally declines with distance: although the linear interaction with distance is not quite significantly negative, the linear effect of distance shows there is already a strong decline in vote share on the other side of the discontinuity. These results fit with the differential predictions of our model across parties, suggesting that the lack of potential PAN voters living further from polling stations means that it is not worth hiring brokers to reach these areas.
Column (4) shows no differential effects for the PRD. This is consistent with our finding above that the PRD is not engaging in significant turnout buying of the sort captured by our identification strategy.
These heterogeneous effects are not consistent with the most plausible alternative explanations for the effects of an additional polling station. First, if improved electoral administration or lower waiting time at the polling booth simply reduces the costs of turning out, the Online Appendix shows that this should increase the vote share of all parties. However, we find no positive effect on the PRD vote share. Furthermore, the increased number of votes for the PRI should be monotonically increasing in distance, while the increased number of votes for the PAN and PRD are expected to be monotonically decreasing in distance. Thus, the congestion explanation cannot explain the finding that the marginal effect of a new polling station on the PRI vote share decreases in distance for a sufficiently large distance. Second, a mechanical effect driven by added electoral officials present at the additional polling station—assuming that they would have not turned out otherwise—could similarly explain neither why only the PRI and PAN benefit to begin with nor why the nonlinear effects with distance occur only for the PRI. Third, monitoring could be facilitating vote buying rather than turnout buying. However, vote buying would imply the reverse relationship with distance because there are more opposition votes for the PRI to convert in the less rural areas where more PAN and PRD voters reside. Similarly, we would expect the PAN and PRD vote shares to increase with distance.
Robustness Checks
Although we demonstrated that split polling stations occur effectively randomly, there remain several important robustness checks to undertake. First, we show that our results do not depend on our RD specification choices. Second, we show that the interaction with distance at the discontinuity is not confounded by omitted variables.
To demonstrate that our results are not specification dependent, we employ a variety of sensitivity analyses. First, Figure 9 considers bandwidths in multiples of 5 ranging from 5 to 100. The results show that the average effect at the discontinuity is very similar across bandwidth choices, and always statistically significant for turnout and PRI vote share. The smaller effects for the PAN are slightly less robust, but only further away from the discontinuity. Second, the Online Appendix shows that the results are robust to the inclusion of linear trends in the running variable on either side of the discontinuity. That this local linear approach yields essentially identical results is not surprising given that our bandwidth choice produces a relatively trendless sample around the discontinuity.
Marginal Effect of Splitting Polling Stations by Bandwidth Choice (with 95% Confidence Interval)

The second main concern is that the interaction with distance to the polling station is actually proxying for another variable. A particular worry is that in using distance, we are simply picking up characteristics like poverty that are also correlated with support for the PRI. Although such arguments are unlikely to entail the nonlinear effects we observe, we included all the variables that we demonstrated balance on as quadratic interactions and show (in the Online Appendix) that the quadratic effects of monitoring by distance to the polling station on the PRI vote share are remarkably stable. In no specification did the nonlinear interaction between splitting polling stations and distance become statistically insignificant. Furthermore, to dismiss any concern that district-specific characteristics might act differentially across the discontinuity, we confirm in the Online Appendix that the results are also robust to identifying our effects entirely out of within-district variation in the effect of an additional polling station, by interacting district fixed effects with the discontinuity.
CONCLUSION
While turnout buying is prevalent in nascent and consolidating democracies, little is known about when parties engage in turnout buying. In this article, we argue that the capacity of parties to monitor the mobilization of voters by their brokers—who are indispensable due to their differential knowledge, but also face incentives to shirk—is an essential determinant of the effectiveness of turnout buying in different parts of the country. In electoral precincts in Mexico where parties can better monitor their brokers, we find significantly higher electoral turnout. By virtue of Mexico’s rural-urban political divide, the extent of turnout buying by the PAN and PRI varies with the precinct-specific costs and benefits of hiring brokers. Better monitoring capacity enables turnout buying where a party has many potential supporters who face prohibitive costs of turning out, but less so once the costs of hiring brokers become too large to justify mobilizing an additional voter.
Our findings have important implications for understanding when parties deploy different electoral strategies, and thus contribute more broadly to the politics of targeted distribution (Cox and McCubbins Reference Cox and McCubbins1986; Lindbeck and Weibull Reference Lindbeck and Weibull1987). First, unlike the party-voter interaction that previous research has focused on, or the selection of brokers, we emphasize the role of parties monitoring their brokers. The empirical component of our study—the first, to our knowledge, to isolate the causal effect of monitoring on turnout buying—shows that electoral returns provide parties with valuable information about broker performance. Although electoral returns are an important monitoring device, and have also been exploited in countries as diverse as Colombia, India, and the U.S., they probably only represent one of a plethora of monitoring mechanisms. Monitoring issues are particularly relevant in the current U.S. context, where Enos and Hersh (Reference Enos and Hersh2015) find that the Obama 2012 campaign struggled to overcome the agency problem that their activists, who are typically ideologically extreme and unpaid, fail to convey messages designed by the party to mobilize centrist voters.
Second, we confirm empirically the theoretical insight of Gans-Morse, Mazzuca, and Nichter (Reference Gans-Morse, Mazzuca and Nichter2013) that the distribution of voter preferences and costs of turning out are central in explaining which parties engage in turnout buying in which locations. This finding buttresses the literature demonstrating that political parties target their voter mobilization efforts strategically (e.g., Berry, Burden, and Howell Reference Berry, Burden and Howell2010; Martin Reference Martin2003). In addition to showing that political parties are sensitive to these considerations, we also find that the interaction with structural features determining the ability of parties to implement turnout buying may be just as important. In this respect our findings dovetail with previous research showing that institutions like the secret ballot (Cox and Kousser Reference Cox and Kousser1981; Nichter Reference Nichter2008), compulsory voting (León Reference León2013), and party machines (Rakove Reference Rakove1976; Stokes et al. Reference Stokes, Dunning, Nazareno and Brusco2013) affect election day strategies.
The specific monitoring instrument examined in this article—additional polling stations—also has implications for policy makers designing electoral systems. El Salvador’s “voto residencial” program, for example, has recently increased the number of polling stations available to voters, while Pakistan introduced a similar reform in 2014.Footnote 41 Similarly, India’s recently introduced electronic voting machines allow parties to assess the relative contributions of their workers manning each polling booth. Our findings highlight an important trade-off facing policy makers seeking to expand the number of polling stations. On the one hand, disaggregated electoral data can be used by election observers to more effectively detect electoral fraud, while increasing the number of polling stations may increase political participation by reducing the costs of voting. On the other hand, our results suggest that parties can use more detailed data to buy more turnout because they can better monitor their brokers. What is best is likely to depend on the context, although the relative ease with which these changes could be achieved is worth noting. This contrasts with prominent accounts emphasizing the role of slow-changing structural factors like economic development, political competition, and income inequality in reducing vote buying (e.g., Stokes et al. Reference Stokes, Dunning, Nazareno and Brusco2013; Weitz-Shapiro Reference Weitz-Shapiro2012).
The concerns about turnout buying are premised on the assumption that it is bad for democracy. However, its effect probably varies across contexts. To the extent that turnout buying increases the participation of previously under-represented groups, it could be regarded as socially beneficial. Conversely, the advantage given to some parties—especially previously dominant parties like the PRI, who already possess the networks and resources to buy votes—may counteract the participatory benefits. Our theory and evidence suggest that careful electoral design could mitigate turnout buying—in those contexts where the negative effects of turnout buying for democracy are clear—by recognizing where dominant parties are most likely to exploit turnout buying potential.
SUPPLEMENTARY MATERIAL
To view supplementary material for this article, please visit http://dx.doi.org/10.1017/S0003055415000593







Comments
No Comments have been published for this article.