




No CrossRef data available.
Article contents
Leishmania donovani complex: genotyping with the ribosomal internal transcribed spacer and the mini-exon
Published online by Cambridge University Press: 03 March 2004
Abstract
Intergenic region typing by restriction analysis of the ribosomal internal transcribed spacer (ITS) and mini-exon provide diagnostic markers for some Leishmania. Here, we evaluate restriction analysis of these targets for genotyping and phylogenetic analysis within the Leishmania donovani complex (agents of visceral leishmaniasis). Each method was useful for genotyping of both L. donovani complex strains and Old World Leishmania species. The targets produced less robust groups than gp63 intergenic regions, but support the need for re-evaluation of the taxonomy of the L. donovani complex.
Keywords
Information
- Type
- Research Article
- Information
- Copyright
- 2004 Cambridge University Press
INTRODUCTION
We have previously identified 6 strain groups in the Leishmania donovani complex, based on intergenic regions of gp63, named MIRT1-MIRT6 (mspC intergenic region type). The 6 groups comprised, respectively; mainly strains from Kenya; from India; from Sudan; L. infantum; Saudi Arabia/Ethiopia, and a Chinese strain (Mauricio et al. 2001). Restriction analysis of the ribosomal internal transcribed spacer (ITS) for several American Leishmania species has correlated well with isoenzyme and mini-exon data (Cupolillo et al. 1995) and has been used to genotype the L. donovani complex in Sudan (El Tai et al. 2001). The mini-exon gene has been exploited for both PCR diagnosis (Hassan et al. 1993; Katakura et al. 1998) and identification of Leishmania complexes (Ramos et al. 1996; Harris et al. 1998). In the L. donovani complex the mini-exon non-transcribed spacer, varies from 422 bp to 467 bp (Fernandes et al. 1994), is highly variable and thus a potential target for intra-specific genotyping. ITS and mini-exon restriction analyses were used here to test the existence of the groups described by gp63 intergenic regions.
MATERIALS AND METHODS
DNA was extracted (Kelly, 1993) from L. donovani complex strains (Table 1), selected to represent geographical and zymodeme diversity, and from outgroup strains L. aethiopica MHOM/ET/70/L96, L. major MHOM/SU/73/5-ASKH and L. tropica MHOM/SU/74/K27. The ribosomal internal transcribed spacer (ITS) was amplified with the primers described by Cupolillo et al. (1995) and PCR conditions as used by Stothard et al. (1996). The primers described by Fernandes et al. (1994) were used to amplify the mini-exon repeat unit as in Ramos et al. (1996). Desired PCR products were purified after electrophoresis using the QIAEX II™ kit (Qiagen), cut with AluI, MseI, TaqI, EcoRI and SphI (ITS), MspI (mini-exon), and BstUI, CfoI and HaeIII (both) and separated by polyacrylamide gel electrophoresis as described (Mauricio et al. 2001). Intense fragments <900 bp were scored as 1 if present (fragment restricted) and as 0 if absent (fragment was not restricted). Trees were built from data matrices of individual and pooled data by PHYLIP 3.6 alpha2 (Felsenstein, 1993), using Nei & Li distance for restriction fragment data, as implemented by RESDIST for an average restriction site size of 4 nucleotides, with both neighbour-joining (NEIGHBOR) and maximum parsimony (PARS). Bootstrap analysis was by SEQBOOT.

RESULTS AND DISCUSSION
For the L. donovani complex ITS PCR products were approximately 1 kb, for L. major 1·1 kb, for L. aethiopica 1·05 kb and for L. tropica 1·05 kb and 0·9 kb. Mini-exon PCR products varied in size between 0·4 and 0·5 kb and were not species specific. Double mini-exon bands were obtained for all 5 Indian L. donovani strains as described for strain DD8 (Fernandes et al. 1994). Thus DD8 is a good reference strain for group 2 (Indian) of the L. donovani complex, readily identifiable by mini-exon PCR, but not good for L. donovani as a whole.
Restriction profiles of ITS and mini-exon PCR products distinguished between the L. donovani complex, L. major, L. aethiopica and L. tropica as described (Schonian et al. 2001). Within the L. donovani complex differences in fragment size were more evident with mini-exon than with ITS restriction analysis (Fig. 1). Mini-exon was also more polymorphic than ITS (29 vs. 20 different profiles – Table 1). With the exception of HaeIII the 2 bands of Indian L. donovani had indistinguishable mini-exon restriction profiles. In some cases both ITS and mini-exon generated a total fragment size greater than the amplification products, characteristic of multiple alleles. Although it is generally believed that multicopy genes become identical in each genome, L. tropica ITS and Indian L. donovani mini-exon clearly had at least 2 sequence types.

Fig. 1. Gel photos of restriction profiles of ITS (A: BstUI; B: TaqI) and mini-exon (C: HaeIII; D: MspI) for Leishmania donovani complex and outgroup strains. Genetic groups (from pooled ITS, mini-exon and gp63 intergenic regions) are shown for each profile. ITS genetic groups are shown for ITS profiles. Lanes are either from the same gel or from simultaneous electrophoreses, with reference strains on each gel. Strains are as in Table 1. Absence of bands in the marked region of C is characteristic of group 4. Strain 28 (marked with *) was included here in genetic group 2 because of its characteristic mini-exon profile (see Table 1).
Individual ITS and pooled ITS and mini-exon data produced 2 robust groups of strains (Fig. 2): L. infantum and strains of group MIRT5+6 (here ITS 5+6). In the pooled ITS and mini-exon analysis strains of group MIRT3 also formed a robust group (here ITS 3). Group numbering was kept consistent across the different data sets. Strains included in L. infantum (MON-30, strain 40) by isoenzyme based phylogenies (Rioux et al. 1990) did not cluster with L. infantum, nor was MON-82 (strains 18 and 32, L. archibaldi) distinct: these 2 zymodemes clustered preferentially with L. donovani MON-18 (strains 14, 33, 38, 42). Upon combined analysis of ITS, mini-exon and both gp63 intergenic regions the 6 groups described previously became strongly supported (Fig. 3). Strains with higher than expected total fragment size clustered with the expected group.

Fig. 2. Analysis of genotypes. (A) Neighbour-joining tree of ITS, showing ITS groups. (B) Maximum parsimony tree of ITS and mini-exon pooled data, showing pooled ITS and mini-exon (ITS+ME) groups. Trees are unrooted and bootstrap values >80% are shown for neighbour-joining and parsimony at each tree.

Fig. 3. Neighbour-joining unrooted tree built using pooled ITS, mini-exon and gp63 intergenic region data. Bootstrap values above 75% (1000 replicates) are shown for assigned genetic groups and main nodes. Individual strains are not shown on the tree, but group assignment is shown in Table 1 (under ‘All’).
Group-specific markers, including for L. infantum if defined as group 4, were identified from ITS and mini-exon, particularly using BstUI and TaqI for ITS (Fig. 1A, B) and HaeIII and MspI for mini-exon (Fig. 1C, D). Further details are available upon request.
Neither ITS nor mini-exon produced as many robust groups as gp63 based restriction analyses. ITS has microsatellite regions (El Tai et al. 2001), which are prone to reverse mutations and therefore may confuse the phylogenetic signal; mini-exon is very GC rich and has short single-base repeats. The increased number of robust groups when data were pooled suggests that the lower bootstrap support for individual ITS and mini-exon trees is due to the relatively small number of characters. ITS and mini-exon are thus less reliable for L. donovani typing than our gp63 based restriction analysis but, because they are multicopy, they may be useful when a suspected VL case is negative by amplification of gp63 intergenic regions, and, because they are smaller, when DNA is somewhat degraded.
ITS restriction analysis confirmed that MON-30 strains do not cluster with L. infantum (group 4) and the ITS+mini-exon analysis did not support MON-82 as a separate species (L. archibaldi). Our results also confirmed that L. donovani is not a homogeneous clade. Discrimination of genetic groups within L. donovani provides a basis for improved understanding of the epidemiology of visceral leishmaniasis and to extrapolate correctly biological, clinical or immunological studies done with single strains.
We thank Praxis XXI, Portugal, and the European Commission (Contracts No. ERBTS3*CT920113 and QLK2-CT-2001-01810) for funding and the following for providing strains: Professor P. Abranches (IHMT, Portugal), Professor J. P. Dedet (Laboratoire d'Ecologie Medicale et Pathologie Parasitaire, Montpellier, France) and Professor J. Shaw (Instituto Evandro Chagas, Belem, Brazil), and Dr H. Noyes (Liverpool School of Tropical Medicine, UK). We also thank Professor J. P. Dedet and F. Pratlong for typing some strains.
References
REFERENCES
CUPOLILLO, E.,
GRIMALDI JUNIOR, G.,
MOMEN, H. &
BEVERLEY, S. M.
(1995).
Intergenic region typing (IRT): a rapid molecular approach to the characterization and evolution of Leishmania.
Molecular and Biochemical Parasitology 73, 145–155.CrossRefGoogle Scholar
EL TAI, N. O.,
EL FARI, M.,
MAURICIO, I. L.,
MILES, M. A.,
OSKAM, L.,
EL SAFI, S. H.,
PRESBER, W. H. &
SCHOENIAN, G.
(2001).
Leishmania donovani: intra-specific polymorphisms of Sudanese isolates revealed by PCR-based analyses and DNA sequencing.
Experimental Parasitology 97, 35–44.CrossRefGoogle Scholar
FELSENSTEIN, J.
(1993).
PHYLIP (Phylogeny Inference Package). Seattle, Distributed by the author. Department of Genetics, University of Washington.
FERNANDES, O.,
MURTHY, V. K.,
KURATH, U.,
DEGRAVE, W. M. &
CAMPBELL, D. A.
(1994).
Mini-exon gene variation in human pathogenic Leishmania species.
Molecular and Biochemical Parasitology 66, 261–271.CrossRefGoogle Scholar
HARRIS, E.,
KROPP, G.,
BELLI, A.,
RODRIGUEZ, B. &
AGABIAN, N.
(1998).
Single-step multiplex PCR assay for characterization of New World Leishmania complexes.
Journal of Clinical Microbiology 36, 1989–1995.Google Scholar
HASSAN, M. Q.,
GHOSH, A.,
GHOSH, S. S.,
GUPTA, M.,
BASU, D.,
MALLIK, K. K. &
ADHYA, S.
(1993).
Enzymatic amplification of mini-exon-derived RNA gene spacers of Leishmania donovani: primers and probes for DNA diagnosis.
Parasitology 107, 509–517.CrossRefGoogle Scholar
KATAKURA, K.,
KAWAZU, S.,
NAYA, T.,
NAGAKURA, K.,
ITO, M.,
AIKAWA, M.,
QU, J. Q.,
GUAN, L. R.,
ZUO, X. P.,
CHAI, J. J.,
CHANG, K. P. &
MATSUMOTO, Y.
(1998).
Diagnosis of kala-azar by nested PCR based on amplification of the Leishmania mini-exon gene.
Journal of Clinical Microbiology 36, 2173–2177.Google Scholar
KELLY, J. M.
(1993).
Isolation of RNA and DNA from Leishmania. In
Methods in Molecular Biology (ed. Hyde, J. E.)
21,
123–131. Humana Press, New Jersey.CrossRef
MAURICIO, I. L.,
GAUNT, M. W.,
STOTHARD, J. R. &
MILES, M. A.
(2001).
Genetic typing and phylogenetic analysis of the Leishmania donovani complex by restriction analysis of PCR amplified gp63 intergenic regions.
Parasitology 122, 393–403.Google Scholar
RAMOS, A.,
MASLOV, D. A.,
FERNANDES, O.,
CAMPBELL, D. A. &
SIMPSON, L.
(1996).
Detection and identification of human pathogenic Leishmania and Trypanosoma species by hybridization of PCR-amplified mini-exon repeats.
Experimental Parasitology 82, 242–250.CrossRefGoogle Scholar
RIOUX, J. A.,
LANOTTE, G.,
SERRES, E.,
PRATLONG, F.,
BASTIEN, P. &
PERIERES, J.
(1990).
Taxonomy of Leishmania. Use of isoenzymes. Suggestions for a new classification.
Annales de Parasitologie Humaine et Comparée 65, 111–125.CrossRefGoogle Scholar
SCHONIAN, G.,
EL FARI, M.,
LEWIN, S.,
SCHWEYNOCH, C. &
PRESBER, W.
(2001).
Molecular epidemiology and population genetics in Leishmania.
Medical Microbiology and Immunology 190, 61–63.CrossRefGoogle Scholar
STOTHARD, J. R.,
HUGHES, S. &
ROLLINSON, D.
(1996).
Variation within the internal transcribed spacer (ITS) of ribosomal DNA genes of intermediate snail hosts within the genus Bulinus (Gastropoda: Planorbidae).
Acta Tropica 61, 19–29.CrossRefGoogle Scholar

Table 1. Leishmania donovani complex strains, codes and typing results for mini-exon (ME) and ITS

Fig. 1. Gel photos of restriction profiles of ITS (A: BstUI; B: TaqI) and mini-exon (C: HaeIII; D: MspI) for Leishmania donovani complex and outgroup strains. Genetic groups (from pooled ITS, mini-exon and gp63 intergenic regions) are shown for each profile. ITS genetic groups are shown for ITS profiles. Lanes are either from the same gel or from simultaneous electrophoreses, with reference strains on each gel. Strains are as in Table 1. Absence of bands in the marked region of C is characteristic of group 4. Strain 28 (marked with *) was included here in genetic group 2 because of its characteristic mini-exon profile (see Table 1).

Fig. 2. Analysis of genotypes. (A) Neighbour-joining tree of ITS, showing ITS groups. (B) Maximum parsimony tree of ITS and mini-exon pooled data, showing pooled ITS and mini-exon (ITS+ME) groups. Trees are unrooted and bootstrap values >80% are shown for neighbour-joining and parsimony at each tree.
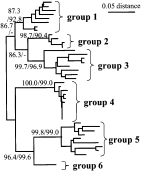
Fig. 3. Neighbour-joining unrooted tree built using pooled ITS, mini-exon and gp63 intergenic region data. Bootstrap values above 75% (1000 replicates) are shown for assigned genetic groups and main nodes. Individual strains are not shown on the tree, but group assignment is shown in Table 1 (under ‘All’).
 You have
Access
- 62
- Cited by