Introduction
The grain aphid Sitobion avenae (F.) is a major pest of cereal crops worldwide (van Emden & Harrington, Reference van Emden and Harrington2007). This aphid causes substantial losses to wheat yield by direct feeding and transmitting viruses (Fiebig et al., Reference Fiebig, Poehling and Borgemeister2003). Application of chemical insecticide is still the main method of control for this aphid; however, chemical control has negative impacts on agroecosystems and can lead to insect resistance to pesticides (van Emden & Harrington, Reference van Emden and Harrington2007, Qiu et al., Reference Qiu, Yao and Han2008). Growing aphid resistant wheat cultivars is a cost-effective way to control aphids below the economic injury level. Wheat breeding, however, mainly aims at high yield, and few commercial wheat cultivars have been bred with resistance to aphids (Hu et al., Reference Hu, Keller, Liu, Hu, Zhao and Liu2012, Smith & Chuang, Reference Smith and Chuang2014). Thus, identifying aphid resistant wheat cultivars and characterizing their resistance mechanisms are of great theoretic and practical significance.
Traditionally, plant resistance mechanisms against insects can be categorized into antibiosis, antixenosis, and tolerance (Kogan & Ortman, Reference Kogan and Ortman1978). Antibiosis is defined as a plant's direct adverse effect on the physiology of an insect pest (Smith, Reference Smith2005). This type of resistance is mainly attributed to plant allelochemicals and leads to higher mortality, smaller body size or weight, longer period of development, and lower fecundity in insects (Smith, Reference Smith2005). Plant antixenosis negatively affects insect's colonization processes, resulting in a reduced initial infestation level. Tolerance is defined as the ability of the plant to recover or withstand insect damage and to produce a higher biomass than a susceptible genotype under similar conditions. The tolerance mechanisms include resource allocation patterns, plant architecture, and other traits that lessen the loss of biomass or yield under herbivore injury (Stowe et al., Reference Stowe, Marquis, Hochwender and Simms2000). Because many plant traits or chemicals have both repellent and toxic properties, the antibiosis and antixenosis are usually overlapping and difficult to separate in practice (Stout, Reference Stout2013). These resistance mechanisms can also be classified into two categories: constitutive resistance and inducible resistance. Constitutive resistance includes preformed physical and chemical barriers that exist consistently, while induced resistance is stimulated only when plants are attacked.
After landing on a plant, aphids penetrate the plant surface using their stylet and search for plant sieve elements. The dominant cues influencing host preference of aphids are probably present in nonvascular cells and aphids decide whether they like the host or not before their stylet contacts the phloem sap (Powell et al., Reference Powell, Tosh and Hardie2006). The electrical penetration graph (EPG) technique can continuously monitor aphid feeding activities and help locate plant resistance factors (Tjallingii, Reference Tjallingii1978).
Feeding from the phloem sap, aphids remove large amounts of photosynthetic products, reduce plant photosynthetic capacity by down-regulating photosynthesis-related gene expression and further reduce the amount of biomass or yield of plants (Thompson & Goggin, Reference Thompson and Goggin2006). For instance, even at low densities, the soybean aphid Aphis glycines Matsumura feeding on soybean caused up to 50% reduction of photosynthetic activities (Macedo et al., Reference Macedo, Bastos, Higley, Ostlie and Madhavan2003). Several studies have examined the cereal photosynthesis changes in response to aphid feeding and have found that the photosynthetic response is different in susceptible and resistant cultivars (Franzen et al., Reference Franzen, Gutsche, Heng-Moss, Higley, Sarath and Burd2007, Gutsche et al., Reference Gutsche, Heng-Moss, Higley, Sarath and Mornhinweg2009). For example, feeding by the Russian wheat aphid Diuraphis noxia (Mordvilko) on a susceptible barley cultivar Otis led to greater photosynthetic rate reduction than on a resistant cultivar Sidney (Gutsche et al., Reference Gutsche, Heng-Moss, Higley, Sarath and Mornhinweg2009). Franzen et al. (Reference Franzen, Gutsche, Heng-Moss, Higley, Sarath and Burd2007) reported that the resistant wheat cultivar Prairie Red infested by D. noxia had a similar photosynthetic rate compared with a control without aphids, whereas the susceptible wheat TAM107 exhibited a lower photosynthetic rate. However, whether photosynthetic rate change is correlated with wheat growth tolerance to aphids is less well studied.
Plant oxidative enzymes, such as polyphenol oxidase (PPO) and peroxidase (POD), can play important roles in plant resistance to herbivores (Thaler et al., Reference Thaler, Stout, Karban and Duffey1996, Boughton et al., Reference Boughton, Hoover and Felton2006, Han et al., Reference Han, Wang, Bi, Yang, Huang, Zhao, Hu and Cai2009). PPOs oxidize common ortho-diphenolic compounds to quinones using molecular oxygen (Constabel & Barbehenn, Reference Constabel, Barbehenn and Schaller2008). PPO-generated quinones are highly reactive and could alkylate dietary protein and amino acids during insect feeding and thus decrease the nutritive value of the food for herbivores (Constabel & Barbehenn, Reference Constabel, Barbehenn and Schaller2008). The common cutworm Spodoptera litura (F.) feeding on PPO overexpressed transgenic tomato had a reduced growth rate and higher larval mortality, suggesting that elevated PPO is important in tomato resistance to S. litura (Mahanil et al., Reference Mahanil, Attajarusit, Stout and Thipyapong2008). PODs are widely distributed enzymes in the plant kingdom, which catalyze the single one-electron oxidation of several substrates using H2O2 (Almagro et al., Reference Almagro, Gomez Ros, Belchi-Navarro, Bru, Ros Barcelo and Pedreno2009). POD is associated with lignin and suberin formation, and reinforcement of the cell walls (Almagro et al., Reference Almagro, Gomez Ros, Belchi-Navarro, Bru, Ros Barcelo and Pedreno2009). Although there is no direct evidence demonstrating that POD contributes to aphid resistance, some studies have found that resistant plants accumulated higher levels of POD than susceptible ones following aphid feeding (Franzen et al., Reference Franzen, Gutsche, Heng-Moss, Higley, Sarath and Burd2007). For example, D. noxia feeding increased POD in resistant wheat cultivars Halt and Prairie Red, but not in the susceptible cultivar TAM 107 (Franzen et al., Reference Franzen, Gutsche, Heng-Moss, Higley, Sarath and Burd2007).
In this study, we examined the antibiosis, antixenosis, and growth tolerance of three wheat cultivars XY22 (‘Xiaoyan22’), AK58 (‘Bainongaikang58’), and XN979 (‘Xinong979’) to S. avenae. These three wheat cultivars are currently most widely grown in northern China and differ in antibiotic resistance to S. avenae (Hu et al., Reference Hu, Keller, Liu, Hu, Zhao and Liu2012). XY22 is a wheat cultivar with antibiotic resistance to S. avenae, while the resistance of the other two cultivars against aphids has not been studied in previous research (Hu et al., Reference Hu, Zhao, Heimbach, Thieme, Li, Zhang, Liu, Li and Hu2004, Reference Hu, Keller, Liu, Hu, Zhao and Liu2012, Wang et al., Reference Wang, Chen, Luo, Zhao, Zhang and Tlali2011). We investigated plant biochemical and physiological differences, and tolerance to S. avenae injury between resistant and susceptible wheat ultivars to determine whether antibiosis is correlated with growth tolerance to S. avenae in these wheat cultivars.
Materials and methods
Plants and insects
Seeds of the wheat cultivars XY22, AK58 and XN979 were obtained from The National Wheat Breeding Centre, College of Agronomy, Northwest A&F University (Yangling, Shaanxi, China). The seeds were held for germination at room temperature (22 ± 1°C) for 2 days on moist paper towel for germination in petri dishes (15 cm in diameter). Seedlings of similar size were grown singly in pots (250 ml, unless otherwise specified) containing soil mix (peat moss:perlite = 5:1) in a walk-in growth chamber (16L:8D; 23°C during the day and 18°C at night; light intensity: 6000 lux). Plants were watered as necessary. The grain aphid S. avenae was collected from a winter wheat field in Yangling, Shaanxi, China, and was reared on a susceptible wheat cultivar (c.v. ‘WuNong148’) in the same growth chamber (16L:8D; 23°C during the day and 18°C at night; light intensity: 6000 lux).
Aphid choice assay
One wheat seedling of each wheat cultivar was grown in an 8-cm diameter pot and thus there were three wheat seedlings of different cultivars in a pot. After 7 days, the wheat seedlings were caged with a transparent plastic cylinder (30 cm in height, 8 cm in diameter) covered with nylon mesh at the top. Then 15 alate S. avenae adults were introduced to each cage, and the number of aphids on each seedling was counted at 12, 36, and 60 h after release. This experiment was performed in the growth chamber with ten fluorescent lamps half a meter above the plants. The light intensity was 6000 lux. This experiment had 12 replications.
Aphid performance assay
To determine the intrinsic rate of increase of S. avenae on different wheat cultivars, two apterous S. avenae adults were introduced to the first leaf of each 7-day-old wheat seedling. The seedlings were individually caged in transparent plastic cylinders as described above. One day later, the adults were removed, leaving one first instar nymph on the first leaf. After another 5 days, the number of nymph on each wheat seedling was checked every 24 h to record the time they reproduced the first nymph. Thereafter, all newborn nymphs were removed daily to avoid overcrowding. The intrinsic rate of increase (r m ) for each aphid was estimated by the following equation: r m = 0.738 × (lnM d )/T, in which T is the time of each aphid from birth to the first reproduction, M d is total number of nymphs produced by each aphid for a period equal to their corresponding T, and 0.738 is a correction factor (Wyatt & White, Reference Wyatt and White1977). A total of 30–32 replications were performed for each wheat cultivar. At the end of r m experiment, each of the adult aphids was collected and weighed on a microbalance (Resolution 0.001 mg; Sartorius MSA 3.6P-000-DM, Gottingen, Germany).
Wheat growth tolerance
To determine the growth tolerance of different wheat cultivars to S. avenae feeding, we measured the weights of uninfested control and aphid-infested seedlings and calculated the proportional biomass reduction. Twenty aphids (third-instar nymphs to adults) were confined on a 6-day-old wheat seedling as described above. Plants without aphids were also caged as the untreated control. We watered the plants once during this experiment and each plant received the same amount of water. Nine days after aphid infestation, the wheat seedlings and the aphids on each seedling were collected. Plant roots were washed in water to remove soil particles and then the wheat seedlings were dried with tissue towels for about 10 min, and weighed on a microbalance (Mettler-Toledo, the Switzerland, resolution 0.1 mg). The seedlings were then dried at 60°C for 48 h, and weighed. We used tolerance index (TI) to assess wheat tolerance to S. avenae (Robinson et al., Reference Robinson, Vivar, Burnett and Calhoun1991). The TI was calculated as: TI = 100 × [(WC–WT)/WC]/WA; where WC is the weight of uninfested control seedlings, WT is the weight of infested (treated) seedlings, and WA is the weight of aphids on each infested seedlings. Both fresh and dry weights of the seedlings were used to calculate the TI. There were 10–11 replications for each wheat cultivar.
Aphid feeding behavior
Feeding behavior of S. avenae on these wheat cultivars was recorded using the Giga-8 direct-current electrical penetration graph (DC-EPG) system (Prado & Tjallingii, Reference Prado and Tjallingii1994). We conducted the EPG experiment according to our previous method (Cao et al., Reference Cao, Wang and Liu 2014a , Reference Cao, Zhang, Zhao, Zhang, Wang, Guo, Zhang and Liu b ). Seven-day-old wheat seedlings were used for EPG recording. Each wheat seedling and each apterous adult aphid was used only once. All the aphids were starved for about 1 h before EPG recording. During this time they were attached with water-based glue to gold wires (3 cm long and 20 μm diameter). Data were recorded using the Stylet+d software, analyzed by the Stylet+ software, and calculated using the Excel workbook for automatic parameter calculation of EPG Data 4.3 (Sarria et al., Reference Sarria, Cid, Garzo and Fereres2009). Twenty nine to 33 successful replications were obtained for different wheat cultivars.
Photosynthesis responses
Twenty aphids (mixed fourth instars and adults) were caged on a 6-day-old wheat seedling as described above. Plants without aphids were also caged as an untreated control. Photosynthetic rates were measured using a portable photosynthesis system with light source and a CO2 injector (LI-6400 XT, LI-Cor, Lincoln, NE, USA). Measurements were taken on the first leaf on days 3 and 6 and on the second leaf on day 9 after aphid introduction at 1400 μmol photons m−2 s−1 light intensity and 400 ppm intercellular CO2 concentration. Six to seven plants (replications) were measured for each of the three wheat cultivars at each time point.
Protein and enzyme assays
For enzyme and protein analysis, leaves used in the photosynthesis measurements were harvested and stored at −30°C. Protein and enzyme activities were determined in soluble proteins extracted from wheat leaves (six replications for each treatment on each sample day) as described in our previous study (Cao et al., Reference Cao, Zhang, Zhao, Zhang, Wang, Guo, Zhang and Liu2014b ). Activities of PPO and POD were expressed as ΔA410 and ΔA470 min−1 mg−1 protein, respectively.
Data analysis
Statistical analyses were conducted using the IBM SPSS Statistics package (version 19.0; SPSS Inc., Chicago, IL, USA). The percentage of aphids on each cultivar at each time point in the choice assay, weights of aphids, r m and TI of each cultivar were analyzed by one-way analysis of variance (ANOVA); means were compared by Fisher's Least Significant Difference (LSD) test at P < 0.05. The fresh and dry TIs among cultivars were analyzed by one-way ANOVA, and means were separated using the LSD test. The EPG data were tested for normality (Hopkins & Weeks, Reference Hopkins and Weeks1990) before analyzing by ANOVA. The EPG data that were not normal distribution were transformed using the LN (x + 1) and were then analyzed by ANOVA; and those data that could not be normalized were analyzed with the nonparametric analysis of variance (Kruskal–Wallis test) (Gabrys et al., Reference Gabrys, Tjallingii and van Beek1997). PPO and POD activities and photosynthetic rates of each infested cultivar on each sample date were compared with the respective controls using Student's t-test.
Results
Host selection
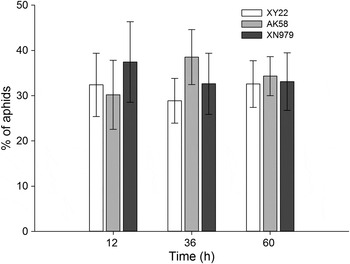
The percentages of aphids found on XY22, AK58 and XN979 did not differ significantly after 12 h (F = 0.223; df = 2, 33; P = 0.801), 30 h (F = 0.667; df = 2, 33; P = 0.520) or 60 h (F = 0.028; df = 2, 33; P = 0.972) (fig. 1).
Mean (±SE) proportion of adult alate Sitobion avenae settling on seedlings of wheat cultivars XN979, AK58, and XY22 (LSD test; P < 0.05; n = 12).

Aphid performance
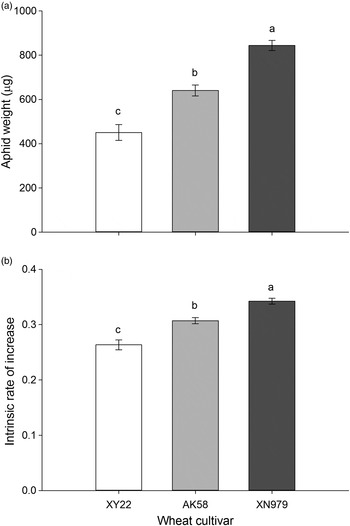
Adult S. avenae weights were significantly affected by wheat cultivars (F = 47.953; df = 2, 48; P < 0.001) (fig. 2a). Weights of adult S. avenae feeding on XY22 were significantly lower, and were 70.4% and 53.9% of those on AK58 and XN979, respectively. The r m of S. avenae feeding on XY22 was also significantly lower than that of those feeding on the other two cultivars (F = 35.179; df = 2, 47; P < 0.001) (fig. 2b).
Sitobion avenae performance on different wheat cultivars. (a) Sitobion avenae weights gain after 7 days feeding on seedlings of wheat cultivars XN979, AK58, and XY22. (b) Intrinsic rate of increase of S. avenae on different wheat cultivars. Value represent mean ± SE. Different letters above bars indicate significant difference (LSD test; P < 0.05).

Wheat tolerance
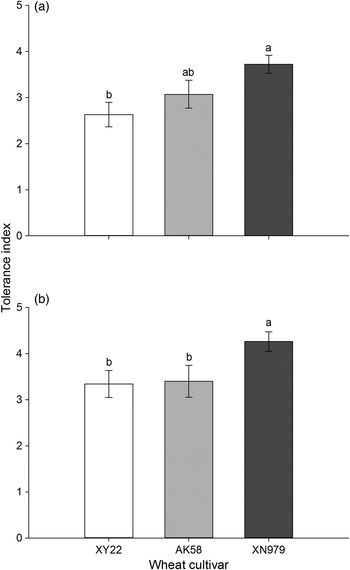
The TI of the fresh wheat seedlings and the TI of the dry wheat seedlings were significantly different between the three cultivars 9 days after infestation (TI of the fresh wheat seedlings: F = 4.687; df = 2, 29; P = 0.017, fig. 3a; TI of the dry wheat seedlings: F = 3.841; df = 2, 29; P = 0.033, fig. 3b). The results showed that XY22 had a significantly higher growth tolerance than XN979.
Tolerance index of fresh (A) and dry (B) wheat seedlings after Sitobion avenae feeding. Tolerance index = 100 × [(weight of control plant–weight of infested plant)/weight of control plant]/weight of aphids. Different letters above bars indicate significant difference (LSD test; P < 0.05).

Aphid feeding behavior
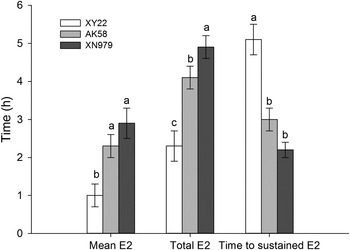
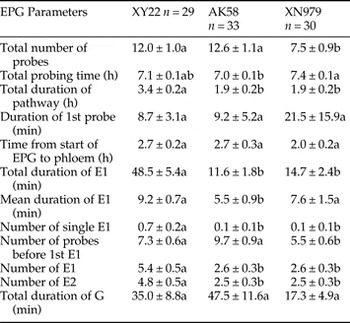
Sitobion avenae had a similar total probing time on XY22 compared with those on AK58 or XN979, while the aphids had more pathway time on XY22 (F = 16.082; df = 2, 89; P < 0.0001) (table 1). Aphids had significantly more single salivation periods when feeding on XY22 compared with those feeding on the other two cultivars (table 1). The aphids took more time before commencing a sustained phloem ingestion period (F = 21.239; df = 2, 89; P < 0.0001), and had a shorter mean (F = 9.548; df = 2, 89; P < 0.0001) and total (F = 18.931; df = 2, 89; P < 0.0001) phloem ingestion duration when feeding on XY22 than on the other two cultivars (fig 4). Aphids feeding on AK58 also had significant shorter phloem ingestion period than those feeding on XN979 (P = 0.047; fig 4).
Sitobion avenae feeding activities on different wheat cultivars. Values are mean ± SE. Different letters above bars indicate significant difference (P < 0.05).

Probing behavior of Sitobion avenae on different wheat cultivars.

Data are expressed as mean ± SE, and different letters within each row indicate significant difference (P < 0.05).
E1, salivation; E2, phloem ingestion; G, xylem ingestion; n, number of replications.
Photosynthetic responses
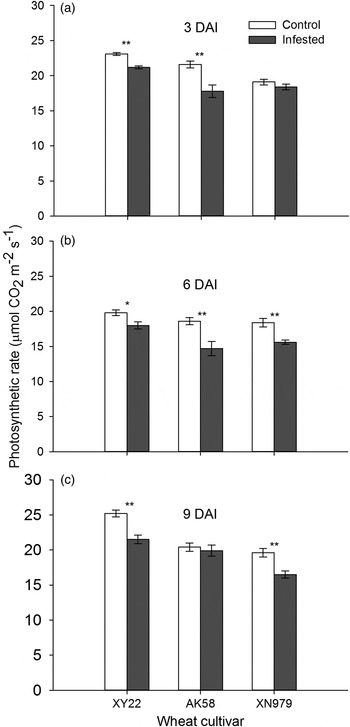
Sitobion avenae feeding resulted in lower photosynthetic capacity of wheat seedlings (fig. 5). Photosynthetic rates in infested XY22 (t = 7.387; df = 12; P < 0.0001) and AK58 (t = 3.63; df = 12; P = 0.003) were significantly lower than in their respective control plants 3 days after aphid introduction, while the photosynthetic activities of XN979 (t = 1.214; df = 12; P = 0.248) was not significantly altered by aphid feeding (fig. 5a). On day 6, all infested plants of the three cultivars exhibited significantly lower photosynthetic rates than their respective controls (XY22: t = 2.94; df = 12; P = 0.012; AK58: t = 3.557; df = 12; P < 0.004; XN979: t = 4.167; df = 10; P = 0.005); but infested XY22 exhibited lower photosynthetic capacity reduction (90.9% of control) than AK58 (79.0% of control) or XN979 (84.8% of control) (fig. 5b). The photosynthetic rates of the second leaves of infested XY22 (t = 4.647; df = 12; P < 0.0001) and XN979 (t = 2.378; df = 10; P = 0.020) remained significantly lower than their respective control plants 9 days after aphid feeding, whereas the photosynthetic capacity of infested AK58 (t = 0.593; df = 11; P = 0.565) was similar to the undamaged control seedlings (fig. 5c).
Mean ± SE photosynthetic activities of wheat leaves at 3, 6, and 9 days after Sitobion avenae feeding. Means of each cultivar within each sample day were compared by Student's t-test (*P < 0.05, **P < 0.01). DAI: days after infestation.

Protein and enzyme assays
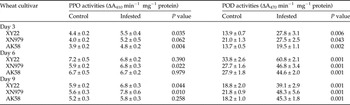
Sitobion avenae feeding increased PPO levels, and PPO activities varied across wheat cultivars and time (table 2). The PPO activities of infested XY22 were significantly higher than the controls on days 3 and 9, but not on day 6 (table 2). The PPO activities in infested AK58 were significantly higher than in the controls only at 3 days after aphid introduction (table 2). Aphid feeding resulted in significantly greater levels of POD activities in the three cultivars on all sample days compared with their respective controls (table 2). Infested XY22 had a higher relative POD increase (2.0-fold of control) than AK58 (1.3-fold of control) and XN979 (1.4-fold of control) 3 days after aphid feeding (table 2).
Mean activities (±SE) of polyphenol oxidase (PPO) and peroxidase (POD) at 3, 6 and 9 days after aphids infestation.

Enzyme activities within each cultivar on each sample day were compared by Student's t-test (P < 0.05).
Discussion
When settling on plants, aphids puncture plant cells with the stylet, ingesting cytosolic contents along the stylet pathway, and decide to feed or leave before contacting the phloem (Powell et al., Reference Powell, Tosh and Hardie2006, Nam et al., Reference Nam, Powell and Hardie2013). The feeding deterrents in phloem may be not important in aphid's host preference, because the concentration of these metabolites in phloem is possibly too low to detect (Douglas, Reference Douglas2006). Although the benzoxazinoid hydroxamic acids in cereals plants are reported to be negatively correlated with plant resistance to aphids, recent work found that the correlation between benzoxazinoid hydroxamic acid content and cereal resistance to aphids is not consistent, suggesting that these metabolites in plant leaves are not the only factors involved in plant resistance to aphids (Niemeyer, Reference Niemeyer2009, Elek et al., Reference Elek, Smart, Martin, Ahmad, Gordon-Weeks, Welham, Nádasy, Pickett and Werner2013). Furthermore, these studies examined these secondary metabolites in plant leaves, which may not reflect the concentration of toxic metabolites in plant phloem sap. In our experiment, S. avenae showed similar acceptance for the three wheat cultivars, indicating that the feeding deterrents in epidermis or mesophyll cells of XY22 did not deter aphid feeding. Aphids performed a similar number of probes on XY22 and AK58, but fewer probes on XN979, indicating that XN979 had fewer feeding deterrents in its epidermis or mesophyll cells than the other two cultivars. Many studies have shown that plants have antibiosis to phloem-feeding insects, while having no antixenosis to insects. For example, although the pea aphid Acyrthosiphon pisum (Harris) had significantly lower phloem ingestion duration on the resistant Medicago truncatula line A17 than on the highly susceptible line A20, this aphid displayed similar host preference between these two lines (Guo et al., Reference Guo, Kamphuis, Gao, Klingler, Lichtenzveig, Edwards and Singh2012). The Bph14 gene conferred rice Oryza sativa L. seedlings resistance to the brown planthopper Nilaparvata lugens Stål by activating phloem sealing and thus reduces the phloem ingestion duration, but had no influence on host acceptance of this insect (Du et al., Reference Du, Zhang, Liu, Hu, Wei, Shi, He, Zhu, Chen and Han2009).
In our experiment, S. avenae had significantly more single salivation period and shorter mean phloem ingestion duration when feeding on XY22 than on the other two cultivars, while they took similar time to reach phloem on all cultivars, suggesting that resistance factors in XY22 are mainly phloem based. The number of probes before contacting plant phloem was comparable when aphids were feeding on XY22 and AK58, but aphids had significantly fewer probes before reaching phloem when feeding on XN979. This implies that XN979 had fewer physical barriers or chemical deterrents in its epidermis or mesophyll cells than the other two wheat cultivars. However, aphids took a similar time to reach plant phloem on all wheat cultivars and S. avenae had similar host acceptance for all the three wheat cultivars, suggesting that physical barriers or chemical deterrents in epidermis or mesophyll cells of XY22 and AK58 played a less important role in wheat resistance to S. avenae. Although the aphids took a similar time to reach phloem, they required a longer time to establish sustained phloem ingestion period and had a shorter mean phloem ingestion duration on XY22, suggesting that aphids had difficulty accepting and continuously ingesting the phloem sap of XY22. This is possibly due to that the phloem sap of XY22 contained feeding deterrents or S. avenae feeding activated phloem sealing mechanism in XY22. Because aphids had a similar mean salivation time on XY22 and XN979, the resistance factor in XY22 is more likely to be due to feeding deterrents in plant phloem.
Aphids mainly feed on plant phloem, which usually contains less nitrogen and an extremely high concentration of sugars (Douglas, Reference Douglas2006). To obtain sufficient nutrition, aphids continuously ingest the phloem sap of plants, remaining for several hours or even days at one feeding site. Therefore, aphid infestation can remove substantial amount of the phloem sap, which serves as a photosynthetic assimilate transporter, and plants can increase their growth tolerance by reducing aphid feeding time (Gifford & Evans, Reference Gifford and Evans1981). Our photosynthesis assay results confirmed the conclusion that aphid infestation generally reduces photosynthesis activity in their hosts (Thompson & Goggin, Reference Thompson and Goggin2006). The relative decline of photosynthetic rates in the resistant wheat cultivar XY22 was less than those in AK58 and XN979 at 6 days after aphid infestation, indicating that the resistant wheat cultivar can tolerate some negative impacts of aphid feeding on photosynthetic integrity (Franzen et al., Reference Franzen, Gutsche, Heng-Moss, Higley, Sarath and Burd2007). This phenomenon was also found in other cereal–aphid interactions; for example, resistant wheat Prairie Red infested by D. noxia suffered less photosynthetic decline compared with susceptible cultivar TAM107 (Franzen et al., Reference Franzen, Gutsche, Heng-Moss, Higley, Sarath and Burd2007). We did not observe significant chlorophyll losses in wheat leaves in response to S. avenae feeding. Our results indicate that XY22 and AK58 had better growth tolerance against S. avenae feeding than the XN979, whereas their photosynthetic rates changes could not fully explain this. The EPG results indicate that S. avenae had shorter phloem ingestion duration on XY22. We also found that S. avenae feeding on XY22 produced significant less honeydew than those feeding on XN979 (HHC and TXL, unpublished data). Thus the wheat cultivar XY22 could possibly achieve growth tolerance to aphids by limiting aphid feeding. The wheat cultivar AK58 also had better growth tolerance than XN979, which may be attributed to this cultivar having no photosynthetic rate reduction at 9 days after aphid feeding and aphid phloem ingestion duration was shorter than XN979.
In this study, the PPO and POD activities varied among cultivars and sample dates, whereas these enzymes changes were not correlated with levels of plant resistance, suggesting that PPO and POD probably play a less important role in wheat resistance to aphids. Increases of these enzymes activities have been reported to be associated with plant resistance to herbivores. Han et al. (Reference Han, Wang, Bi, Yang, Huang, Zhao, Hu and Cai2009) reported that constitutive PPO activities in S. avenae resistant wheat cultivars were higher than susceptible wheat plants. Heng-Moss et al. (Reference Heng-Moss, Sarath, Baxendale, Novak, Bose, Ni and Quisenberry2004) found that the western chinch bug Blissus occiduus Barber feeding led to higher levels of POD activities in resistant buffalograsses Buchloe dactyloides (Nuttall) Engelmann, but not in susceptible plants. However, neither D. noxia nor the bird cherry-oat aphid Rhopalosiphum padi (L.) feeding elicited any changes of PPO activities in wheat and barley examined (Ni et al., Reference Ni, Quisenberry, Heng-Moss, Markwell, Sarath, Klucas and Baxendale2001). In our previous study, application of methyl jasmonate increased PPO and POD levels, and reduced S. avenae preference but had no significant impacts on aphid performance (Cao et al., Reference Cao, Zhang, Zhao, Zhang, Wang, Guo, Zhang and Liu2014b ). Although POD activities in infested plants are significantly higher than those in uninfested plants in all cultivars tested throughout the experiment, there was no obvious pattern between POD activities and wheat resistance.
In summary, our results suggest that the wheat cultivar XY22 has a stronger antibiotic resistance against S. avenae than the other two cultivars and a better growth tolerance than XN979. These findings indicate that phloem-based plant resistance mechanism which limits aphid feeding from plant phloem can possibly explain plant growth tolerance to aphids, while has no influence on aphid's host acceptance. However, whether the phenomenon that antibiotic resistance positively correlates with tolerance in plant–aphid interaction is a common conclusion needs further investigation.
Acknowledgements
We thank Michael Keller (University of Adelaide) and Thomas James Ridsdill-Smith (University of Western Australia) for reviewing the early version of this manuscript. We are grateful for the assistance of all staff and students in the Key Laboratory of Applied Entomology, Northwest A&F University at Yangling, Shaanxi, China. Funding of this research was partially supported by each of the following grants: the National Natural Science Foundation of China (NO. 31272089), National Basic Research Program of China (973 Project No. 2012CB114105) and China Agriculture Research System (CARS-25-B-06).