


The authors regret the presence of two errors in the original submission identified by a replicator (De Kadt Reference De Kadt2025). Our response to the replicator, among other issues, thanks them for identifying these coding issues which we now correct (see Turnbull-Dugarte and López Ortega Reference Turnbull-Dugarte and Ortega2026).
The first error relates to an inconsistency in the production of Figures 3, 6 and 8. These figures were described as representing output from linear probability models based on standard OLS regression. Although the tables cited in these figure are based on OLS, the visualizations themselves were based on logistic regression models. The inconsistency has no bearing on the conclusions. The second error relates to inconsistent application of standard errors. Figure 4 presented estimates using robust standard errors. Figure 3, Figure 6, Figure 7, and Figure 8 rely on classic standard errors. Applying robust standard errors universally renders one point-estimate—specifically, the conditional average treatment effect for anti-immigration respondents in Study 2—statistically indistinguishable from zero.
Below we reproduce the figures presented in the main paper applying robust standard errors universally and based on the OLS models as described. We reproduce Figure 3, Figure 6, Figure 7, and Figure 8. The original Dataverse files have been updated to reflect the correction including accompanying supplementary material files. This includes new iterations of Table A9, Table A10, and Table A11.
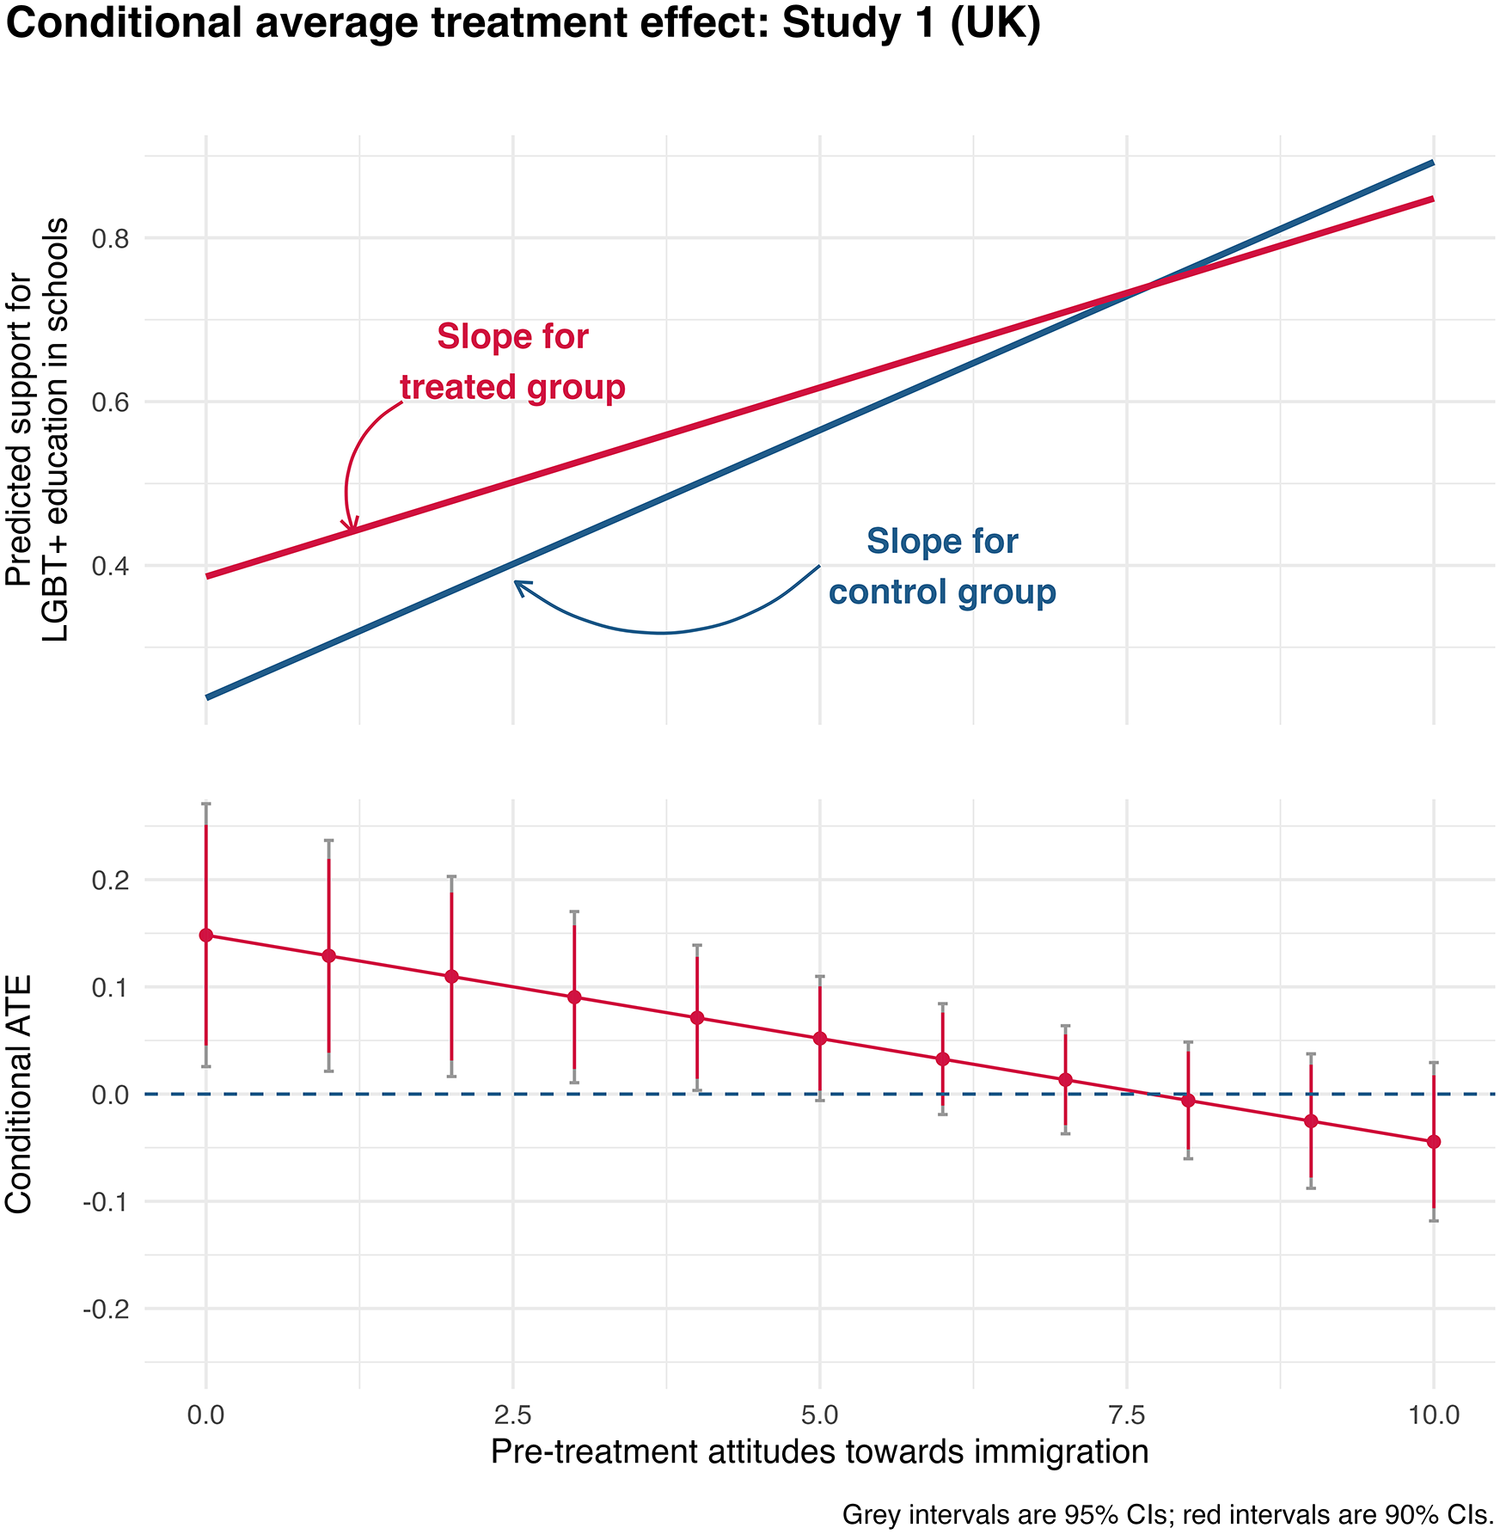
Treatment Effect across Distribution of Immigration Preferences (UK) – Revised Results
Note: Update for Figure 3 in original article. Visualization based on OLS instead of logistic regression. Visualization with corrected (robust) SEs. The correction does not influence conclusions.

Figure 3. Long description
The graph is divided into two vertically stacked panels with a shared x-axis labeled Pre-treatment attitudes towards immigration, ranging from 0.0 to 10.0.
Top Panel: Predicted support for L G B T plus education in schools.
* The y-axis ranges from 0.2 to 0.8.
* A red line labeled Slope for treated group shows a linear increase starting at approximately 0.4 on the y-axis and ending near 0.85.
* A blue line labeled Slope for control group shows a steeper linear increase starting lower at approximately 0.25 and ending higher at approximately 0.9.
* The two lines intersect at an x-axis value of approximately 7.5.
Bottom Panel: Conditional A T E.
* The y-axis ranges from minus 0.2 to 0.2, with a dashed horizontal reference line at 0.0.
* A red line with circular data points shows a downward linear trend.
* At x equals 0.0, the A T E is approximately 0.15.
* The line crosses the zero threshold at approximately x equals 7.5, becoming slightly negative as it reaches x equals 10.0.
* Each data point includes vertical error bars. A note at the bottom right specifies that grey intervals are 95 percent C Is and red intervals are 90 percent C Is.
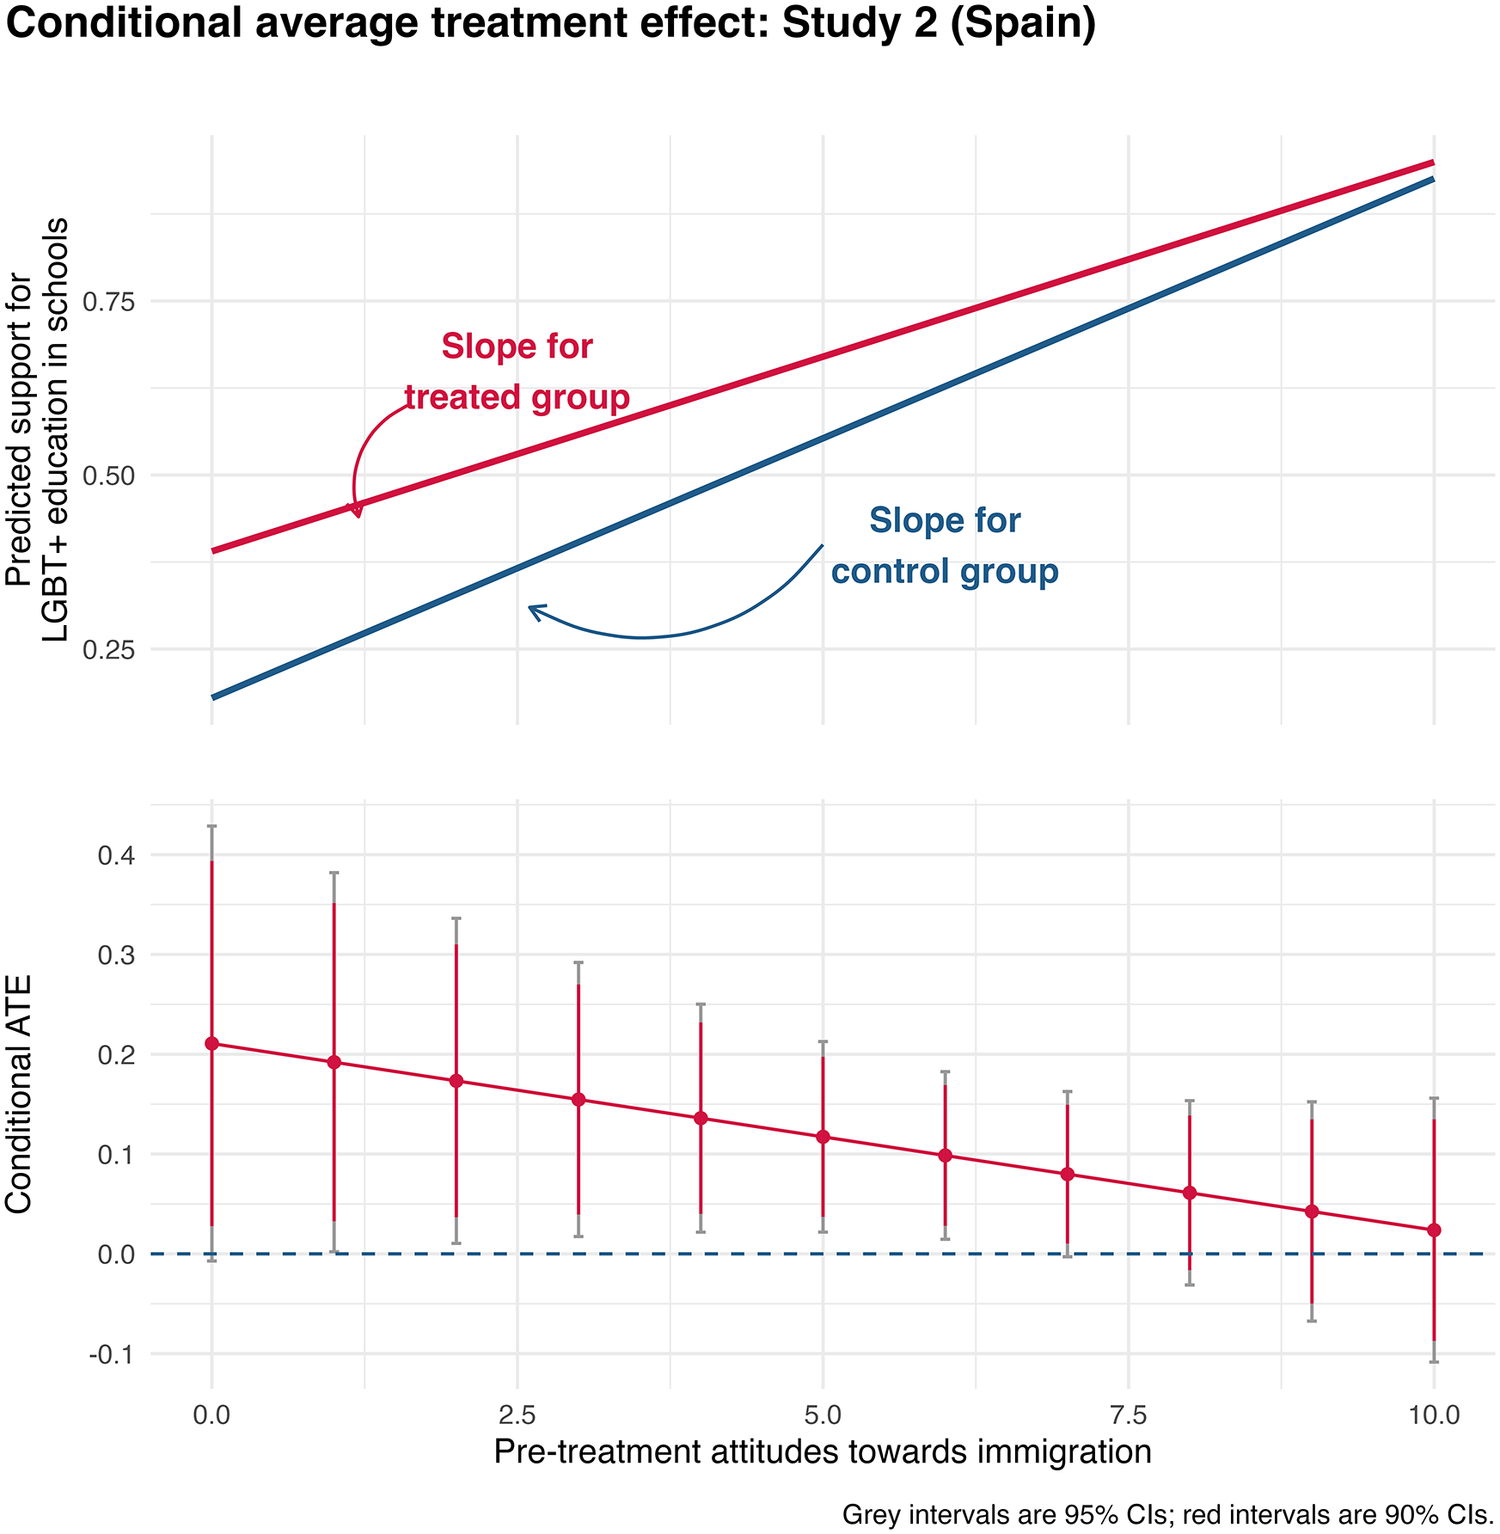
Treatment Effect across Distribution of Immigration Preferences (Spain) – Revised Results
Note: Update for Figure 6 in original article. Visualization based on OLS instead of logistic regression. Visualization with corrected (robust) SEs. The correction does not influence conclusions.

Figure 6. Long description
The graph is divided into two vertically stacked panels with a shared X axis labeled Pre-treatment attitudes towards immigration, ranging from 0.0 to 10.0.
Top Panel: Predicted support for L G B T plus education in schools.
* The Y axis ranges from 0.25 to 0.75.
* Two upward-sloping linear lines are shown.
* The red line, labeled Slope for treated group, starts at approximately 0.4 on the Y axis and rises to nearly 1.0.
* The blue line, labeled Slope for control group, starts lower at approximately 0.2 and rises more steeply, converging toward the red line at the high end of the X axis.
Bottom Panel: Conditional A T E.
* The Y axis ranges from minus 0.1 to 0.4, with a dashed horizontal line at 0.0 representing no effect.
* A red line with a negative linear slope shows the treatment effect decreasing as immigration attitudes move from 0.0 to 10.0.
* Each data point on the line includes vertical error bars. Red intervals represent 90 percent C I s, and grey intervals represent 95 percent C I s.
* At the 0.0 mark on the X axis, the A T E is highest at approximately 0.2. As the X axis increases, the effect size diminishes, with the error bars crossing the zero line at approximately the 9.0 mark on the X axis.
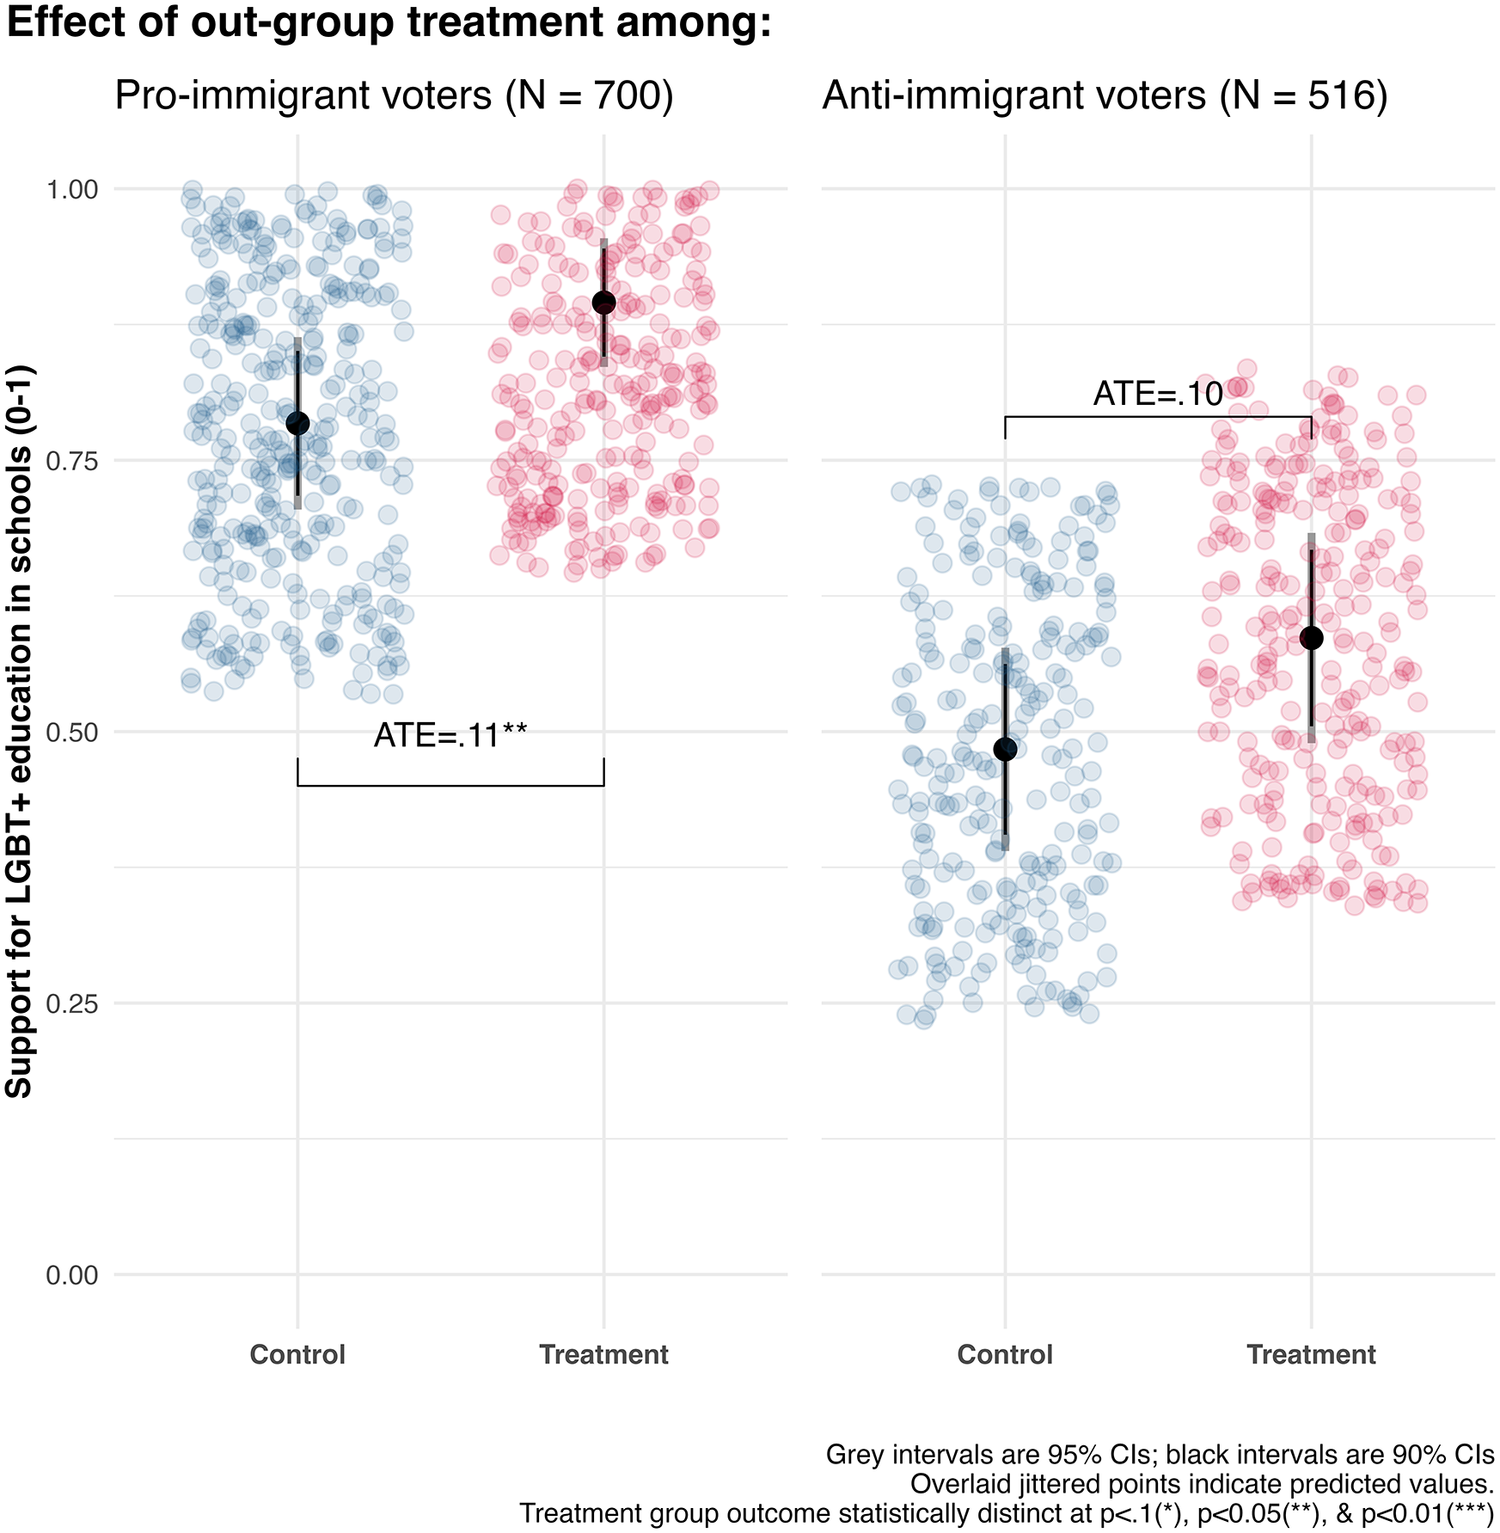
Treatment Effect among Those with Dichotomised Immigration Preferences (Spain) – Revised Results
Note: Update for Figure 7 in original article. Visualization with corrected (robust) SEs. The correction renders point-estimate for anti-immigration subgroup statistically indistinguishable from zero.

Figure 7. Long description
A two-panel dot plot with a shared Y-axis labeled Support for L G B T plus education in schools (0-1).
Left Panel: Pro-immigrant voters (N = 700).
- The X-axis has two categories: Control and Treatment.
- Control group: A cluster of blue jittered points centered around a mean of approximately 0.78.
- Treatment group: A cluster of red jittered points centered around a mean of approximately 0.89.
- A bracket connects the two groups with the label A T E = .11 double asterisk.
- Each group includes a black vertical line for 90 percent C I s and a grey vertical line for 95 percent C I s.
Right Panel: Anti-immigrant voters (N = 516).
- Control group: Blue jittered points centered around a mean of approximately 0.49.
- Treatment group: Red jittered points centered around a mean of approximately 0.59.
- A bracket connects the two groups with the label A T E = .10.
- Statistical markers show the treatment effect for this subgroup is not marked with asterisks, indicating it is statistically indistinguishable from zero.
Legend at the bottom right states: Grey intervals are 95 percent C I s; black intervals are 90 percent C I s. Overlaid jittered points indicate predicted values. Treatment group outcome statistically distinct at p < .1 (asterisk), p < 0.05 (double asterisk), and p < 0.01 (triple asterisk).
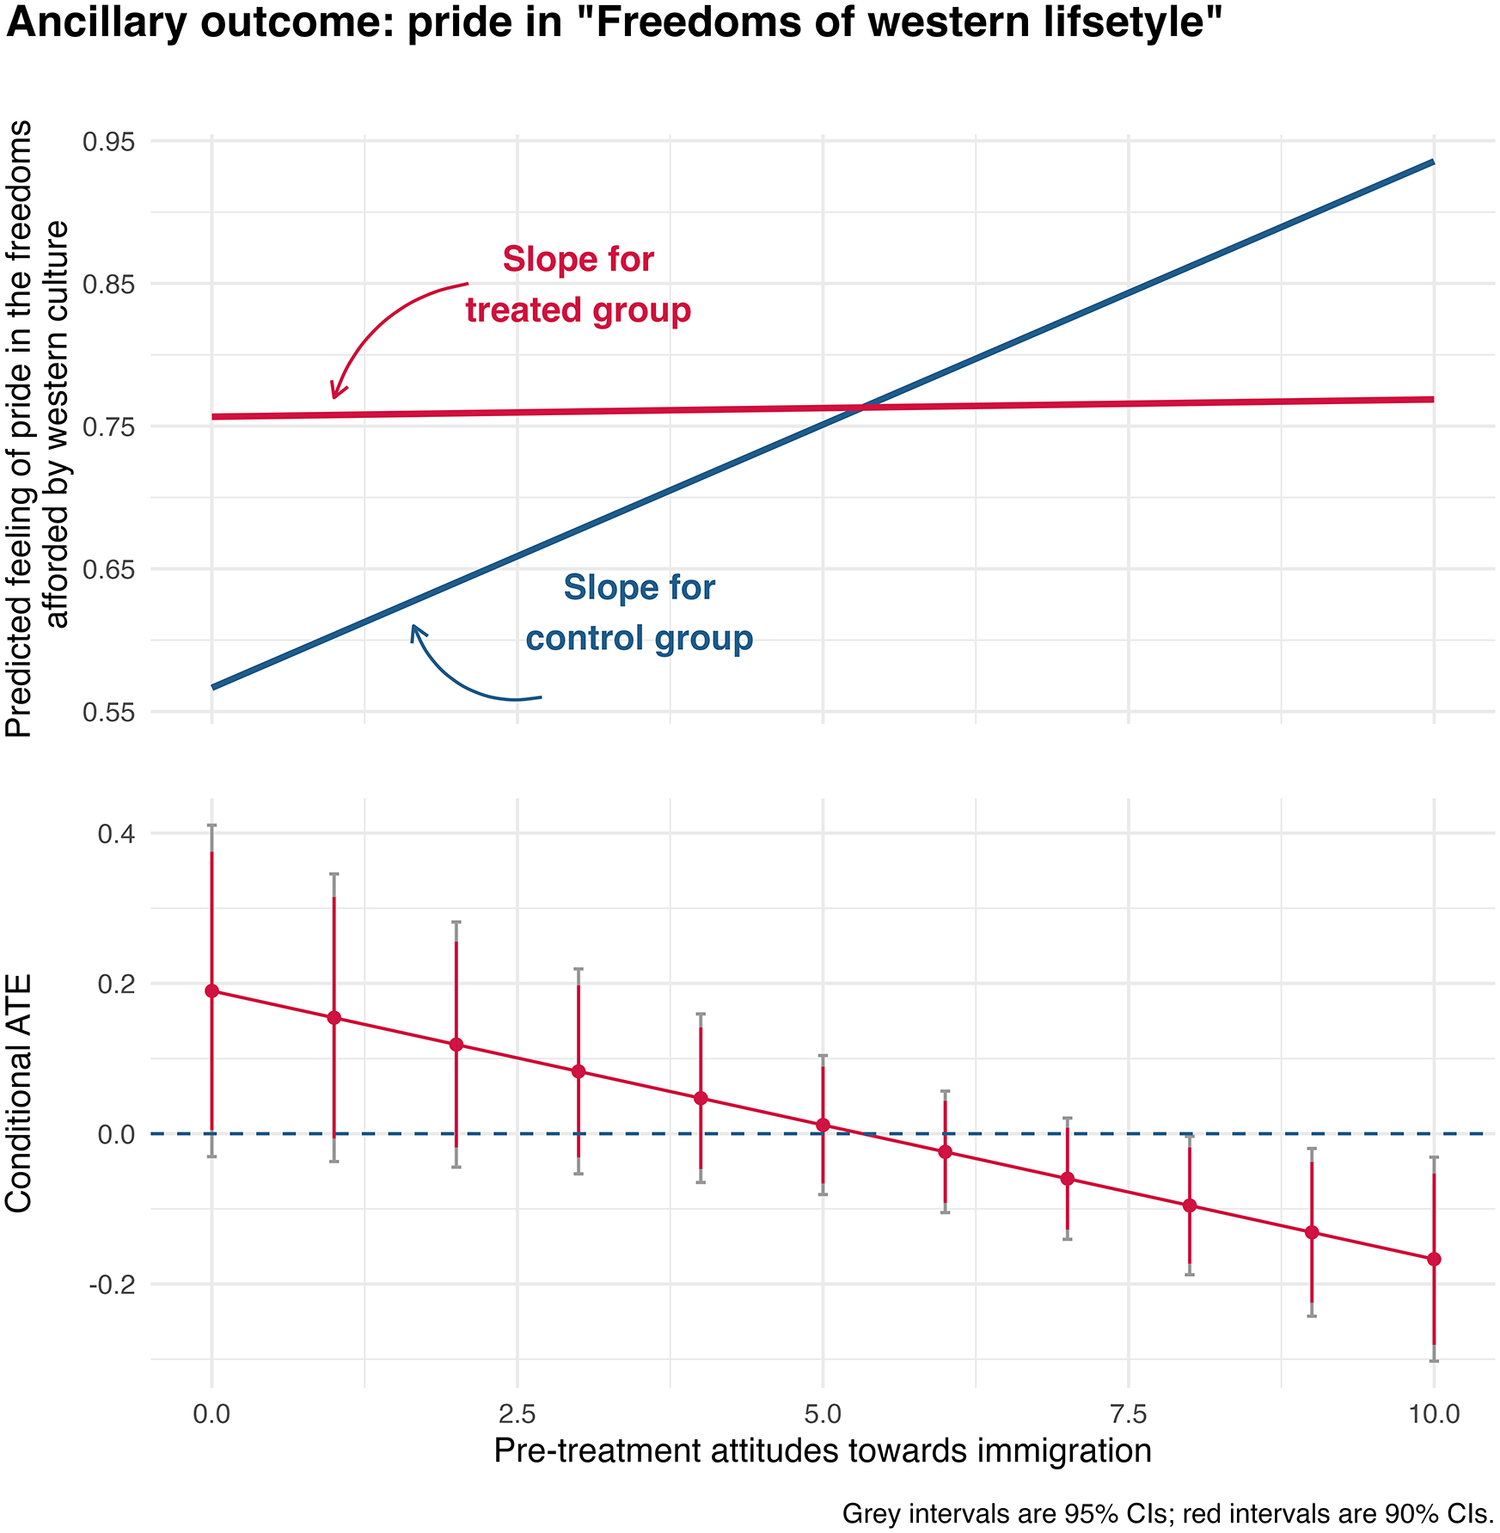
CATE on Pride in Western Liberties – Revised Results
Note: Update for Figure 8 in original article. Visualization based on OLS instead of logistic regression. Visualization with corrected (robust) SEs. The correction does not influence conclusions.

Figure 8. Long description
The figure consists of two vertically stacked panels with a shared X-axis labeled Pre-treatment attitudes towards immigration, ranging from 0.0 to 10.0.
Top Panel: The Y-axis is labeled Predicted feeling of pride in the freedoms afforded by western culture, ranging from 0.55 to 0.95. It contains two lines. A red line, labeled Slope for treated group, remains nearly flat, starting at approximately 0.76 and ending slightly higher. A blue line, labeled Slope for control group, shows a steep linear increase, starting at approximately 0.57 and ending at approximately 0.93. The lines intersect at an X-value of approximately 5.5.
Bottom Panel: The Y-axis is labeled Conditional A T E, ranging from -0.2 to 0.4. A horizontal dashed blue line marks the 0.0 baseline. A red line with circular data points shows a downward linear trend, starting at a Conditional A T E of approximately 0.2 at X equals 0.0 and crossing the 0.0 baseline at X equals 5.5, ending at approximately -0.18 at X equals 10.0. Each data point includes vertical error bars. A note at the bottom right specifies that grey intervals are 95% C I s and red intervals are 90% C I s.
Dataverse available at: https://doi.org/10.7910/DVN/70UDEG.

 Open access


Comments
No Comments have been published for this article.