I. INTRODUCTION
Chips generated during machining are a major challenge for the industry and environment. Although recycling through remelting is widely practiced (conventional technique), it is typically energy intensive and consequently expensive. Sharma and Nakagawa proposed a new method of recycling the chips and scraps through direct conversion, circumventing the melting route.Reference Sharma and Nakagawa1 This approach gained momentum in the 1990s when several publications appeared presenting high-strength products manufactured through recycling of machined chips.Reference Mabuchi, Kubota and Higashi2–Reference Nakanishi, Mabuchi, Saito, Nakamura and Higashi4 This new method has been known as solid state recycling (SSR) from the nature of its recycling route, which involves cold compaction followed by hot extrusion with or without sintering.
Due to increasing usage of light metals (such as magnesium and aluminum alloys) in electronic, automotive, and aircraft industry, wastes such as chips and swarfs can be expected to become more worrisome to the industry and the environmentalists. This has led to an extensive research in improving strength properties of SSR-machined chips. Although SSR of aluminum chips is equally successful and quite a number of papers are available on this material,Reference Samuel5–Reference Chino, Mabuchi, Otsuka, Shimojima, Hosokawa, Yamada, Wen and Iwasaki8 limited work is available on steelsReference Chino, Iwasaki and Mabuchi9 and titanium alloysReference Luo, Xie, Paladugu, Palanisamy, Dargusch and Xia10. This is possibly because recycling magnesium (Mg) alloys through this technique is more sensible, for it does away with the hazardous melting route. Mg alloys being the lightest among the structural alloys have many beneficial characteristics: high specific strength and stiffness, superior damping capacity, high thermal conductivity, high dimensional stability, good electromagnetic shielding characteristics, and good machinability. This has made Mg one of the most sought-after materials in the industry and it is the material of study in the present investigations.
SSR promises effective recycling of Mg chips provided desired properties are achieved at attractive cost, environmental benefits, or both. Though the latter is beyond the scope of the present study, it is generally understood that SSR offers almost double the yield as that of a conventional melting route.Reference Samuel5, Reference Gronostajski, Marciniak and Matuszak6 The property developments, on the other hand, depend on the developments in microstructures. In addition to grain and defect structures, oxide contaminants and relative presence of prior chip boundaries are expected to be important for SSR of Mg alloys. Past studies have shown clear developments of tensile properties with prior extrusion conditions.Reference Chino, Kobata, Shimojima, Hosokawa, Yamada, Iwasaki and Mabuchi11–Reference Tao, Ming-yi, Xiao-shi and Kun16 This study attempts the same for compression properties and more importantly tries to address the role of prior chip boundaries in chip-consolidated Mg.
II. EXPERIMENTAL
A. Chip production and consolidation
Commercial purity (99.9%) magnesium billet was turned in a lathe to produce chips. The chips were 3–7 mm in length, around 2 mm in width, and 0.4 mm (400 μm) in thickness. Machining speed was kept sufficiently low to avoid the use of coolant. These chips were compacted under a pressure of 350 MPa at ambient conditions for 30 min to a billet of 28-mm diameter. The cold-compacted (CC) billets were soaked at the extrusion temperature for 1 h before extruding using CBJ 250 ton hydraulic press at four different temperatures: 250, 300, 350, and 400 °C maintaining a ratio of 49:1, at a velocity of 2 mm·s−1. Extrusion temperature in the present work implies temperature of the billet (as-cast or CC) just before the start of extrusion.
Here chip-consolidated products are termed as cold compacted and extruded (CCE). Depending on the temperature of extrusion, they have been abbreviated as 250_CCE, 300_CCE, 350_CCE, and 400_CCE. For the purpose of comparison, cast magnesium billet of same composition was extruded under similar conditions and are denoted as-extruded (AE) material. These have been abbreviated as 250_AE, 300_AE, 350_AE and 400_AE.
B. Density and hardness measurements
Densities of CC, CCE, and AE specimens were measured using Archimedes’ principle. An electronic balance with 0.0001 g accuracy was used for the weight measurements. Micro-Vickers Hardness was measured using a Zwick/Roell hardness tester (INDENTEC Hardness Testing Machines Limited, Middlesex, UK) at a test load of 25 and 200 g applied for 10 s.
C. Microstructural characterization
Polishing was done by standard metallographic route up to no. 4000-grit emery paper, followed by final cloth polishing with submicron diamond paste. An etchant consisting of mixture of 5% nitric acid, 15% acetic acid, 20% distilled water, and 60% ethyl alcohol was used for revealing conventional microstructures using optical microscope (OM). Etching duration was 20 s. For electron backscattered diffraction (EBSD) and x-ray texture studies, the samples were initially polished up to no. 4000-grit emery paper and later with submicron colloidal silica for approximately 2 min. Conventional microstructures or grain structures were examined using OM and FEI Quanta 200HV scanning electron microscope (SEM; QUANTA 200HV, FEI, Eindhoven, Netherlands). Grain sizes were estimated using standard linear intercept method. For EBSD, a SEM with field emission gun (FEG) (QUANTA 3DFEG, FEI, Eindhoven, Netherlands) was used. The EBSD data were processed using TSL OIM analysis software (TSL Crystallography, AMETEK Inc., Berwyn, PA). An area of at least 400 × 400 μm2, at 0.1-μm step size, was measured in each sample. Beam and video conditions were kept identical between the scans. X-ray bulk texture measurements were done using D8 Discover diffractometer (Bruker AXS, Karlsruhe, Germany). For calculations of orientation distribution functions (ODFs) and inverse pole figures (IPFs), a commercial software (Labosoft) was used.
D. Compression test
Room temperature (25 °C) compression tests were performed, as per ASTM E9-89a standard, using a screw driven Zwick/Roell Z100 testing machine (Zwick/Roell, Ulm, Germany) at a strain rate of 10−3 s−1. Cylindrical test specimens measuring 2.5 mm in diameter (D) and 4 mm in length (L) were prepared from the 4-mm-diameter extruded rod along the extrusion direction and loaded along the extrusion direction. The extruded rod was machined 0.75 mm (depth of cut) to eliminate possible surface defects. This results in an effective 2.5-mm-diameter rod. Preparing samples perpendicular to the extrusion direction, though might have brought interesting insights into the study, was avoided due to practical limitations. To maintain a minimum L/D ratio of 1.5, the best possible machining would have given 1.33-mm-diameter specimen of 2-mm height, if prepared perpendicular to extrusion direction. Such miniature specimens would be physically difficult to handle; moreover, a smaller sample in chip-consolidated product is expected to be less representative of the overall property. Therefore, the compression samples were prepared only along the extrusion direction. Test specimens were cleaned with acetone, and the load bearing surfaces were lubricated using molybdenum disulfide. 0.2% compressive proof stress (CPS), ultimate compressive stress (UCS), and the strain to failure were obtained from true stress–true strain curve. The fracture surface was observed using both OM and SEM.
III. RESULTS
A. Density
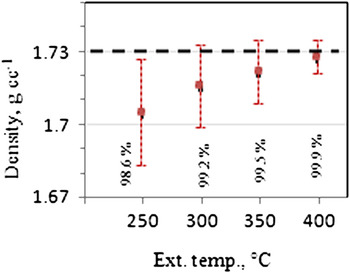
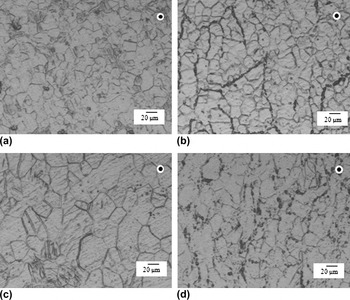
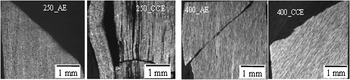
As shown in Fig. 1, 250_CCE had a low relative density (98.6% as compared to AE), and the density improved with increasing extrusion temperature. 400_CCE, on the other hand, was almost fully dense. The error bars (or experimental scatter) on the density data clearly decreased with increasing extrusion temperatures. This indicates a similar trend for the relative presence of porosities. While the chip boundaries were pronounced in 250_CCE, their presence dwindled in 400_CCE as shown in Fig. 2. Peng et al.Reference Peng, Wang, Han, Zheng and Guo17 have noted that elevated temperature plastic deformation can lead to better closure of porosities leading to improved homogeneity. Our results clearly support such an agreement. Magnesium is a soft material, and metallographic polishing (including polishing by colloidal silica) often welds up the surface porosities. The electropolishing, on the other hand, can artificially enhance the presence of such porosities. This is primarily the reason that the present study did not attempt to report data on pore size and distribution of the CCE samples.
Density of cold compacted and extruded (CCE) products extruded at different temperatures. Density of as-extruded (AE) (1.73 g cm−3) is shown as reference. Relative densities of the CCE samples (with respect to AE) are also noted for comparison.

Cross-sectional optical micrographs comparing (a) 250_AE, (b) 250_CCE, (c) 400_AE, and (d) 400_CCE. Chip boundaries were pronounced in (b) and clearly reduced in (d).

B. Microstructure
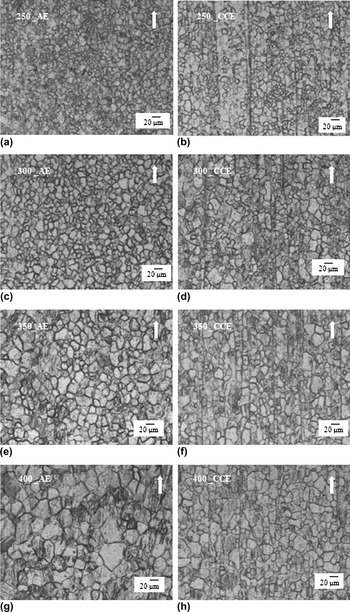
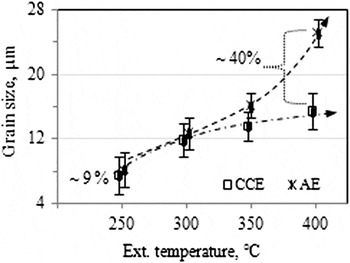
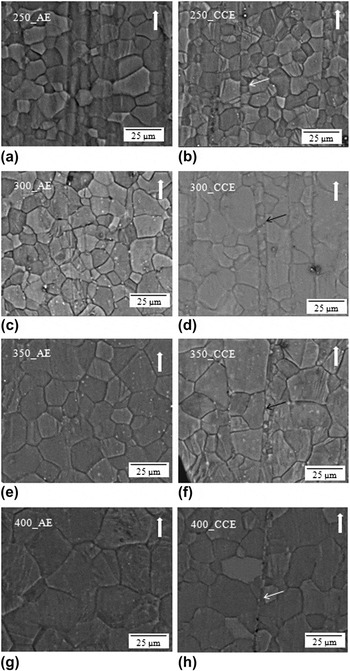
Optical micrographs of CCE and AE specimens, extruded at four different temperatures, are shown in Fig. 3. The grain size information is further collated in Fig. 4. Figure 4 shows finer grains at lower extrusion temperature and larger grains at higher temperatures. Grain size of CCE was always smaller than AE. Such difference was, however, significantly more at the higher working temperature. For example, 400_CCE had ∼40% reduction in average grain size, whereas the difference was only ∼9% for 250 °C extrusion. This indicates grain growth inhibition in CCE as compared to AE at higher extrusion temperatures. Relatively higher magnification SEM micrographs (Fig. 5) show clear evidences of grain boundary pinning or growth suppression at the chip boundaries. It is to be noted that oxides were not evident, either under OM (Figs. 2 and 3) or under higher magnification backscattered SEM (Fig. 5), as shown elsewhere by researchers in magnesium chip and powder consolidated products.Reference Chino and Mabuchi15, Reference Pérez, Garcés and Adeva18 The growth inhibition, observed in the present study, appears to be primarily caused by the presence of chip boundaries.
Optical micrographs of the extruded specimen in longitudinal section. Arrow shows the extrusion direction.

Plot of grain size versus extrusion temperature for CCE and AE samples.

Backscattered scanning electron microscopy micrographs of CCE and AE samples in longitudinal sections. Line arrows indicate chip boundaries. Solid arrows indicate extrusion direction.

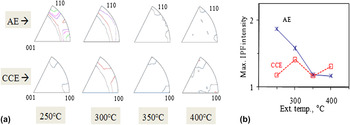
IPFs, estimated from x-ray diffraction, showed weak crystallographic textures as shown in Fig. 6. At 250 °C, AE had slightly stronger texture than CCE: with clear preference for  and
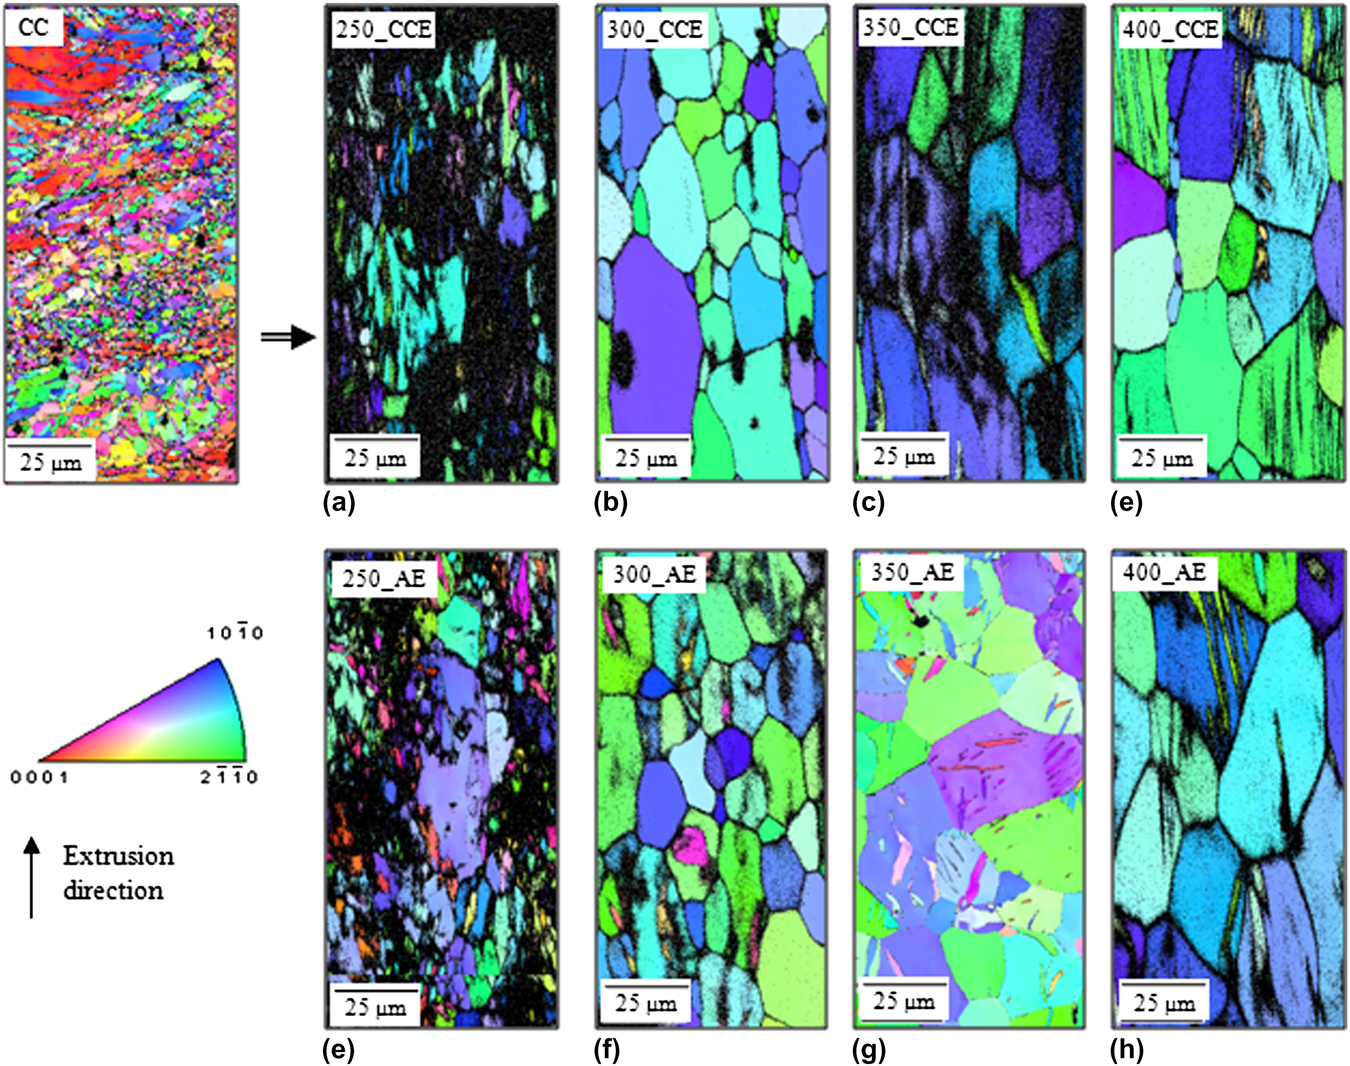
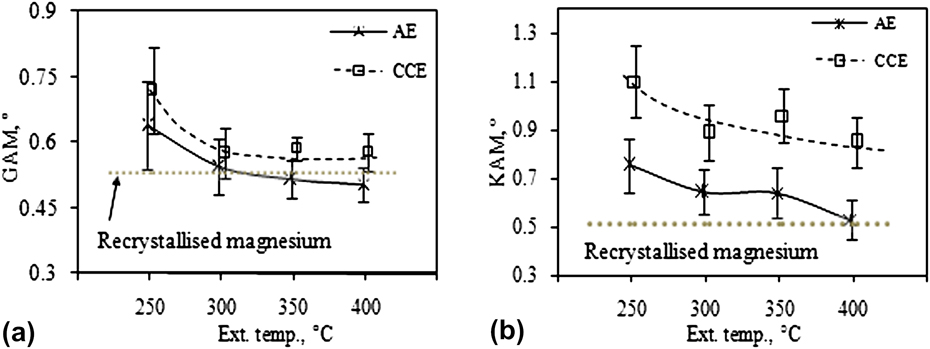
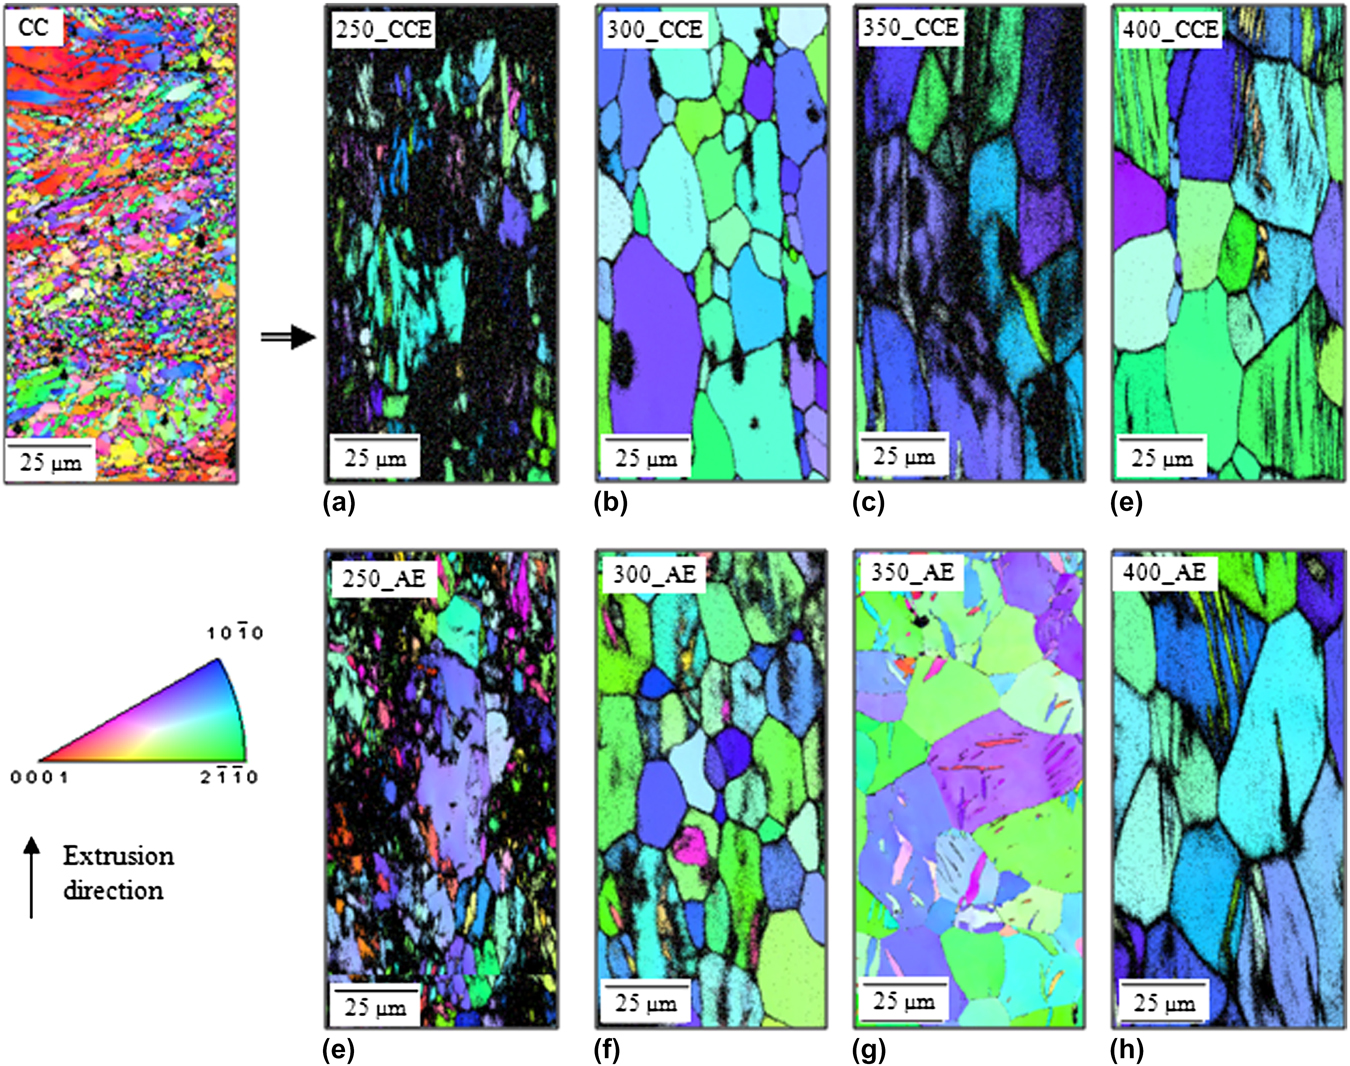
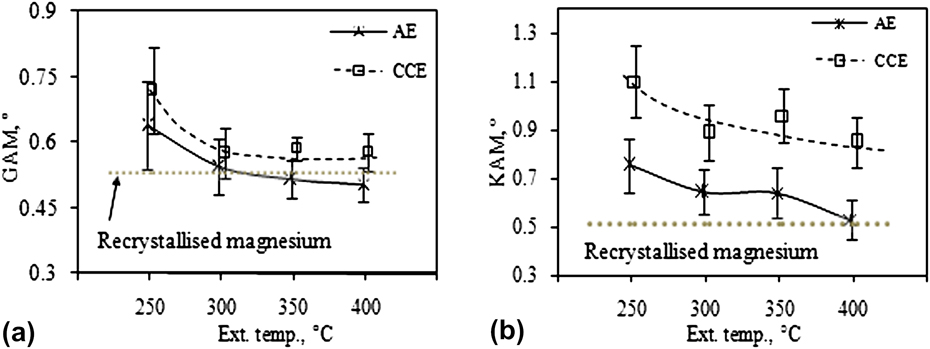
 plane normals. This is expected in extruded magnesium alloys.Reference Mueller, Mueller and Reimers19, Reference Bohlen, Yi, Swiostek, Letzig, Brokmeier and Kainer20 High working temperatures removed such preference and made the textures randomized for both AE and CCE. EBSD scans were made for all these samples—see Fig. 7. At the lower working temperatures, even with FEG source, there were unindexed data points. The other significant features were in-grain misorientations and the relative presence of the twins. The former can be represented as so-called grain average misorientation (GAM) and kernel average misorientation (KAM) values. For GAM defining a grain is essential. A grain is defined by the continuous presence of a boundary above 5° misorientation. GAM is the average point-to-point misorientation inside such grains. KAM, on the other hand, estimates the average misorientation between any point and all its neighbors (typically six for a hexagonal scan grid), provided such misorientations are below 5°. The GAM and KAM values, as in Fig. 8, show a clear pattern for higher in-grain misorientations in CCE. The values for AE at higher extrusion temperatures approached that of fully recrystallized magnesium.
(a) Inverse pole figures (IPFs), estimated from x-ray diffraction data, for CCE and AE samples extruded at different temperatures. Contours are drawn at 1.2, 1.4, 1.6, and 1.8 times random. (b) Maximum IPF intensity, for both the samples, at different extrusion temperatures.

Electron backscattered diffraction IPF maps of CCE and with AE samples. [0001] represents the extrusion direction.
Variation of (a) grain average misorientation (GAM) and (b) kernel average misorientation (KAM) with extrusion temperature for CCE and AE. GAM and KAM values of fully recrystallized magnesium are shown as reference.
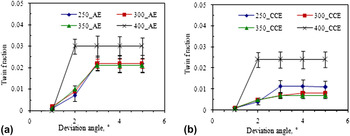
Twin boundaries were identified through appropriate axis angle relationship: 94.8°  for
 tensile twins in hexagonal close packed (hcp) material.Reference Wright, Bingert, Masaon and Larsen21 These were the only twins observed in the present study. As shown in Fig. 9(a), AE had slightly higher twin concentration. The twins, however, had remarkably different nature at and below 400 °C extrusion. At 400 °C extruded samples, in both AE and CCE, the twin fractions were more and they had lower deviations from exact twin orientation relationship. As discussed in separate studies on stainless steelReference Mishra, Narasimhan and Samajdar22 and hexagonal Zr,Reference Sahoo, Hiwarkar, Samajdar, Pant, Dey, Srivastav, Tewari and Banerjee23 deformation twins are expected to have higher deviations than the so-called annealing twins. The remarkably different patterns of twin deviation, Fig. 9, clearly indicate presence of annealing twins in the 400_AE and 400_CCE. Twinning is largely affected by the grain size and crystallographic orientations.Reference Barnett, Keshavarz, Beer and Atwell24–Reference Koike, Kobayashi, Mukai, Watanabe, Suzuki, Maruyama and Higashi26 As textures of both AE and CCE were randomized, the higher twin fractions in AE can be attributed to its relatively larger grain sizes.
Twin fraction versus deviation from ideal twin orientation relations (94.8°  ) for (a) AE and (b) CCE.

C. Hardness
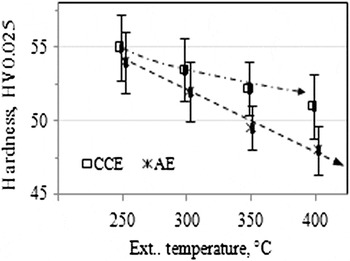
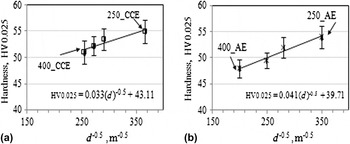
Microhardness measurements were obtained at 25- and 200-g load. The lower load has the advantage of hardness variation at different locations in chip consolidated material (CCE), while the higher load offers a better averaging. As in Table I, the trends were similar. This can be attributed to the fact that at least 20 measurements were obtained to avoid statistical scatter. Figure 10 shows a steep drop in the hardness values of AE with increase in extrusion temperature, whereas the decrease is relatively gradual in case of CCE. Figure 4 shows a significant grain size increase for AE as compared to CCE at 400 °C extrusion, which explains the steep drop in hardness values for AE. As in Fig. 11, both AE and CCE followed the Hall–Petch relationship on grain size (d) dependent hardness.
Plot of hardness versus extrusion temperature for CCE and AE samples.

Hall–Petch relationship on grain size (d) dependent hardness. Hardness as a function of d −0.5 for (a) CCE and (b) AE.

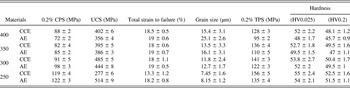
Room temperature compression test data of cold compacted and extruded (CCE) and as-extruded (AE) specimens: compared in terms of compressive proof stress (CPS), ultimate compressive stress (UCS), and total strain to failure. For reference, room temperature tensile proof stress (TPS), grain size, and Micro-Vickers Hardness values are also presented.

D. Compression behavior
The room temperature compression behavior, of the AE and CCE samples extruded at different temperatures, is shown in Fig. 12 and summarized in Table I. The yielding behavior, as in Fig. 12, at and below 400 °C extrusion was different. Below 400 °C [Figs. 12(b)–12d)], CCEs had early onset of yielding as compared to AEs. This can be explained in terms of closure of porosity with the loading: an effect visible in samples of incomplete (see Fig. 1) densification. Though both AE and CCE showed a drop in CPS for specimens extrude at higher temperatures; the CPS of CCE was lower than AE in all extrusion temperatures except 400 °C. 400_CCE showed ∼22% increase in CPS over the corresponding AE.
Room temperature compression test data, as true stress–true strain plots from CCE and AE: (a) 400 °C, (b) 350 °C, (c) 300 °C, and (d) 250 °C extruded specimens. The yield regions are shown in the insets.

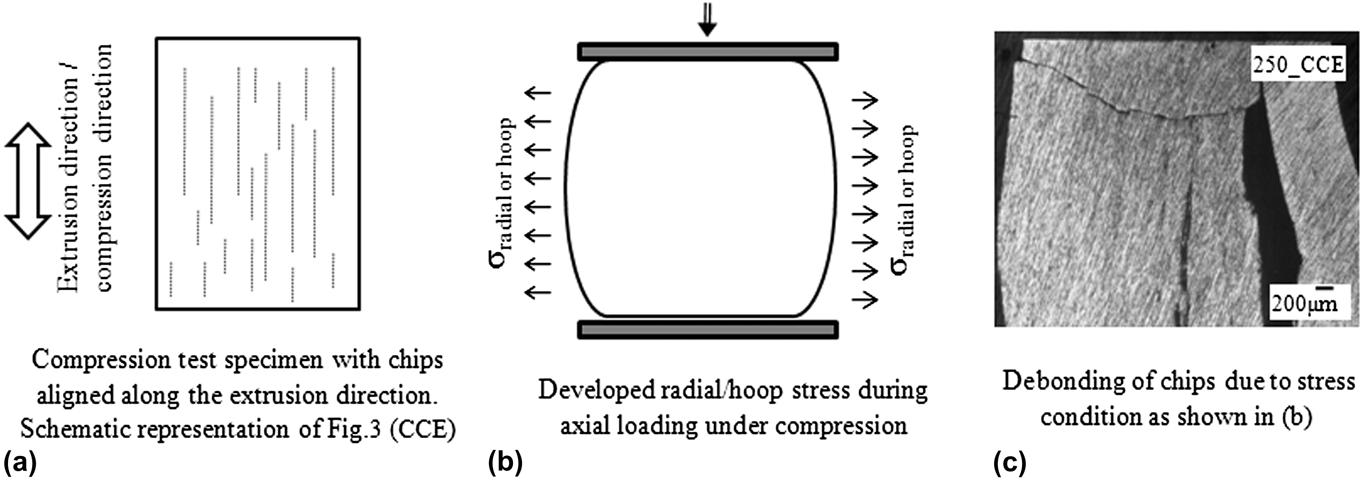
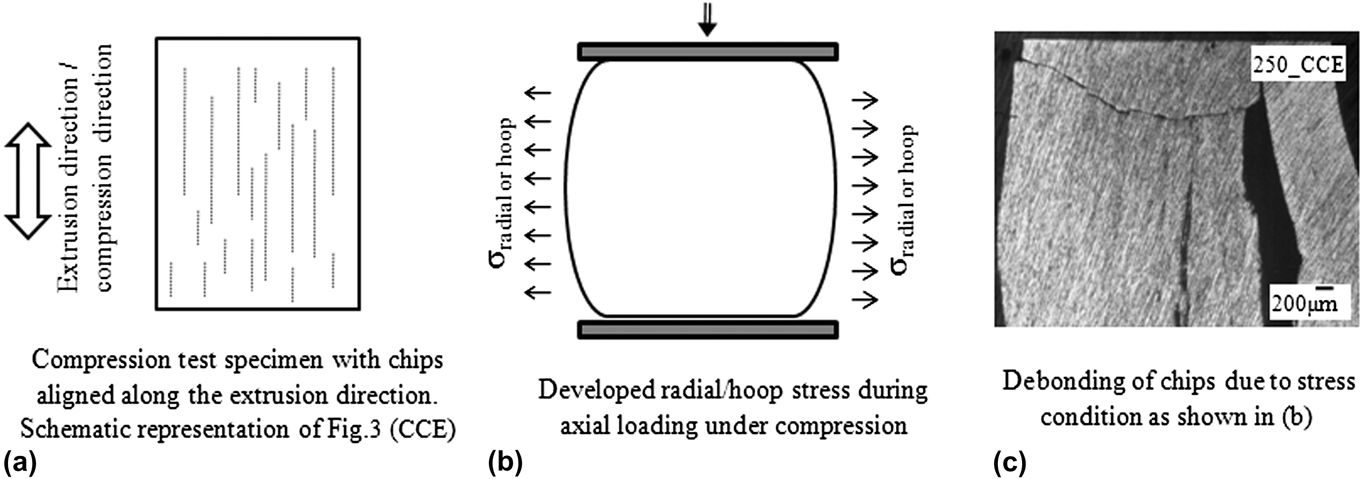
Except for 250 °C extrusion, the UCS in CCE was superior and the ductility (or total strain to failure) was comparable to the corresponding values of AE. As shown in Fig. 13, 250_CCE showed a mixed mode of failure that included longitudinal splitting together with shear at a particular angle to loading direction. As the chips were aligned along the compression direction, such a fracture surface represents poor bonding between the chips causing early separation. Above 250 °C extrusion and with better chip bonding, both CCE and AE specimens failed by shearing at an angle to the loading direction (Fig. 13): typical of Mg alloys.Reference Dorris27 The cleaned and lubricated compression specimens, as used in the present study, are expected to offer lower friction and hence minimum bulging. Complete elimination of friction is not possible and even an insignificant friction, existing between platens and test specimen, would result in hoop stress.Reference Wei and Chau28–Reference Chen and Chen30 It is to be noted, as shown in the schematics of Figs. 14(a) and 14(b), that the alignment of chip boundaries and hoop stress may lead to chip debonding. Although the probability of such debonding would depend on the strength of the chip boundaries and the extent of hoop stress, the combination does provide an explanation for lower CPS. It also needs to be noted that the evidence of chip debonding was apparent in 250_CCE, see Fig. 14(c). However, this kind of failure was not seen in higher temperature extruded CCE specimens, indicating good chip bonding.
Fractured samples of CCE compared with AE at the end of compression tests.

Schematic representations of (a) chip boundaries and (b) radial or hoop stresses in the compression samples. (c) Micrograph showing the final failure of the sample by apparent debonding of chip boundaries.
IV. DISCUSSION
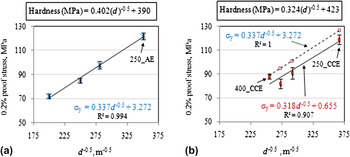
The present study focuses on the room temperature compression behavior of the chip-consolidated products extruded at different temperatures. It is hence important to elucidate the microstructural parameters affecting the compression behavior. A simple Hall–Petch relationship is often considered as a first step in any such effort. As in Fig. 11, hardness versus grain size followed the typical Hall–Petch behaviorReference Biswas, Dhinwal and Suwas31 for both AE and CCE. This was also apparent for the TPS (0.2% tensile proof stress), see Table I. Further, under tensile testing CCEs showed higher ultimate tensile strength (UTS) compared to corresponding AEs, but the elongation to failure was consistently lower. In terms of 0.2% CPS, both AE and CCE showed the overall tendency of increase in yield strength with decreasing grain size. Although CPS values for AE fitted well with Hall–Petch [Fig. 15(a)], fit for CCE was rather poor [Fig. 15(b)]. While CCEs showed higher TPS compared to corresponding AEs at all extrusion temperatures—including 250 °C extrusion, only 400_CCE showed higher CPS compared to AE. Given the finer grain size of CCE (Figs. 3 and 4), a higher CPS is expected. This was observed only for the 400 °C extruded sample: CPS was ∼22% more in CCE than in AE. Density measurements (Sec. III.A.) showed presence of 1.4, 0.8, and 0.5 porosity in 250_CCE, 300_CCE, and 350_CCE samples, which, in turn, explains the early onset of yielding (as in Fig. 12) in theses samples.
0.2% compressive proof stress as a function of d −0.5, represented by the solid lines, for (a) AE and (b) CCE. Considering that 400_CCE was free from porosity and hence represented the Hall–Petch behavior of porosity-free CCE, a dotted line (parallel to the experimental line) was redrawn by back calculating the 0.2% proof stress from the Hall–Petch equation of AE. The corresponding Hall–Petch equations from hardness measurements (converted from HV0.025 to MPa) are also noted.

Two more points need to be stated: (i) Hall–Petch slope of AE was more than CCE: 0.337 MPa√m versus 0.318 MPa√m. The former is in close agreement with reported values for Mg alloys.Reference Andersson, Cáceres and Koike32, Reference Mann, Griffiths and Cáceres33 (ii) Hall–Petch slopes were also estimated from the hardness measurements: assuming 1 kgf/mm2 ≈ 9.81 MPa, VHN (unit of hardness in kgf/mm2) was converted into MPa (unit of strength) and is noted in Fig. 15. A reasonable correlation is seen between these slopes and slopes obtained from compression test data.
An explanation for the consistently lower Hall–Petch slope for the CCE may exist in the strain hardening and/or other microstructural aspects. As shown in Fig. 8, the CCE had more misorientation and hence expected to have more strain hardening than AE. In both cases, however, misorientation dropped with prior extrusion temperature: the drops were similar between CCE and AE. In other words, changes in strain hardening behavior, with prior extrusion temperature, are expected to be similar between CCE and AE and hence do not appear to explain the observed differences in the respective Hall–Petch slopes.
Yield strength of Mg alloys can strongly be affected, often generalized as c-axis loading, by crystallographic texture.Reference Yin, Wang, Liu and Zhao34–Reference Paramsothy, Hassan, Srikanth and Gupta36 In all the samples, except AE after 250 °C extrusion, the crystallographic texture was randomized. Room temperature compression tests showed “concave” nature of the flow patterns for both AE and CCE. Previous studies have attributed such behavior to deformation twinning.Reference Barnett, Keshavraz, Beer and Atwell37, Reference Barnett38 Of course AE had more deformation twinning—see Fig. 9. But this can be explained from the higher grain size in AE.Reference Mishra, Narasimhan and Samajdar22, Reference Sahoo, Hiwarkar, Samajdar, Pant, Dey, Srivastav, Tewari and Banerjee23 In conclusion, although role of crystallographic texture in the deformation behavior of hcp metals is well established,Reference Pérez, Garcés and Adeva18, Reference Barnett, Keshavraz, Beer and Atwell37, Reference Barnett38 observed randomized textures in AE and CCE specimens minimize such a role in all but 250_AE.
To reduce, if not eliminate, the effect of density on the Hall–Petch slope of CCE, a simple numerical exercise was attempted. 400_CCE was considered free from porosities and hence to follow ideal Hall–Petch behavior: a behavior similar to that of AE [Fig. 15(a)]. With this assumption, Fig. 15(b) was modified: the dotted line (parallel to the experimental line) hypothesizing the Hall–Petch behavior of porosity-free CCE samples. In such a hypothetical behavior, improvement in CPS is apparent for 250–350 °C extruded CCE specimens. The fact that TPS of CCE was more than AE (see Table I), and the hardness followed the Hall–Petch relationship supports this hypothesis on the effect of porosity on consistently lower CPS in CCE.
An important distinction between the CCE and AE specimens was in the presence of chip boundaries. It is apparent from the present study that poorly bonded chips (as in case of 250_CCE) are detrimental to the compressive strength properties and with increased extrusion temperatures; however, they became more benign. It also needs to be noted that the CCE samples extruded at temperatures higher than 250 °C showed improved compressive strength and lesser roles for chip debonding. This may have several explanations: ranging from higher diffusivities to improved plastic flow at higher temperatures of processing.
Although an exact explanation on the nature of chip bonding is not evident at this stage, this work has two clear outcomes. Firstly, compression strength properties improved with prior extrusion temperature in chip-consolidated products. Secondly, it strengthens the effort of researchers who have shown that Mg-chip-recycled products, through SSR, have good strength and ductility,Reference Mabuchi, Kubota and Higashi2–Reference Nakanishi, Mabuchi, Saito, Nakamura and Higashi4, Reference Chino, Kobata, Shimojima, Hosokawa, Yamada, Iwasaki and Mabuchi11–Reference Peng, Wang, Han, Zheng and Guo17 corrosion resistance,Reference Chino, Furuta, Hakamada and Mabuchi39 and higher fracture toughness (K IC) compared to their reference material.Reference Matsuura, Watanabe and Hirashima40 Moreover SSR, unlike conventional recycling technique, does not need the usage of hazardous gasses such as SF6 and has high material recovery (96% compared to only 52% through conventional recycling technique)Reference Samuel5 and energy efficiency (saving almost 10 GJ of energy per ton).Reference Gronostajski, Marciniak and Matuszak6
V. CONCLUSIONS
The present study dealt with machined Mg chips: cold compacted and then extruded (CCE) at 250–400 °C. For comparison, cast billets of similar composition were extruded as reference material (AE). Following are the important observations:
(i) Chip boundaries were visible, under optical microscopy, even after 400 °C extrusion at 49:1 extrusion ratio. However, the aforementioned CCE achieved almost complete densification and better mechanical properties than AE.
(ii) CCE samples had finer grain sizes than the so-called as-extruded (AE) product. The chip boundaries clearly suppressed grain coarsening.
(iii) Both CCE and AE samples followed the Hall–Petch relationship: in terms of measured hardness as well as CPS. The Hall–Petch slope was, however, more for AE than CCE. Relative role of the chip boundaries, from initiating chip debonding in 250 °C extruded product to more benign role for CCEs extruded above 250 °C, appears to offer an explanation for lower Hall–Petch slope in CCE and also brings in clear possibilities of recycling Mg chips through cold compaction followed by hot extrusion.
ACKNOWLEDGMENTS
The work involved the Institute X-ray Facility and Institute Nanoscience Initiative (INI) facility sponsored by Department of Science and Technology under the Funds for Improvement of S&T Infrastructure in Universities and Higher Educational Institutions (DST-FIST program) at Indian Institute of Science (IISc), Bangalore. The authors would also like to acknowledge the use of the National Facility for Texture & OIM (a DST- IRPHA (Intensification of Research in High Priority Areas) facility) at Indian Institute of Technology-Bombay for this study. Adamane R. Anilchandra, would like to thank Mr. Somjeeth Biswas of IISc for the useful discussion during the course of work.