I. INTRODUCTION
Microwave low-pass filters (LPFs) are important building blocks of many contemporary wireless systems with RF bandwidth-limited signals, such as cellular radio systems, radars, measurement and test systems, and communication systems. Often, present-day low-pass filtering, which is used to suppress the undesired harmonics or spurious signals, requires enhanced filter performance, such as small insertion loss in the pass band and a wide rejection bandwidth with a large depth of attenuation.
Traditionally, the microwave LPFs are designed using the insertion loss method (ILM) with the three basic steps: (1) synthesis of a lumped prototype; (2) transformation of this prototype into a distributed prototype; and (3) transformation of the distributed prototype into a microwave structure. Often, the lumped prototype requires a modification by Richards' transformation and Kuroda's identities [Reference Matthaei, Young and Jones1, Reference Malherbe2]. However, this procedure does not exploit all degrees of freedom of the structure. Moreover, it may require characteristic impedance that is unrealizable with a given technology [Reference Salerno3].
Microwave LPFs realized with transmission-line stubs and sections inherently exhibit undesirable pass bands, so several approaches have been attempted to design filters with a controllable rejection band. A lossless transmission line model has been used to obtain the guideline for filter design and the conditions for obtaining the desired frequency response have been analytically derived [Reference Mandal4, Reference Velidi5]. The reported structures are, essentially, a single-cell design that is not suitable for cascading.
The microwave filter design, based on periodic electromagnetic structures (PES), might be used in order to overcome some limitations of the above-mentioned design approaches. PES have been studied extensively [Reference Collin6] and, depending on the domain of the application, various terminologies have been used: frequency selective surfaces, photonic band gap, etc., or under the broad terminology of electromagnetic band gap structures [Reference Yang and Samii7]. PES have started playing an important role in the enhancement of the performance of microwave devices because they exhibit significant band-pass and band-rejection properties at microwave frequencies [Reference Karmakar8–Reference Zhou and Yang10]. To a certain extent, closely related to PES is the image parameter method (IPM) of filter design [Reference Pozar11].
PES/IPM permits the non-commensurate design and utilizes all available degrees of freedom. It applies directly to the microwave structure with no need for prototypes and frequency transformations. In addition, PES/IPM may incorporate some technological limitations since both characteristic impedances and delay times are used in the design. Finally, basic PES/IPM filter sections can be cascaded together in order to achieve the desired characteristics.
Some authors [Reference Mohra12–Reference Sor16] suggest PES/IPM inspired filter realizations with defected ground structure (DGS). However, DGS increases the fabrication complexity and the filter sensitivity, so it is not suitable for realization in monolithic microwave integrated circuits [Reference Ye17]. Alternatively, some authors start with periodic structures (with no DGS) from which the filter is designed by truncating the structure to a finite number of identical cells [Reference Xue18–Reference Li20].
This paper proposes a PES inspired design of low-pass microwave filters featuring a deep stop band and a wide controllable rejection bandwidth, which can be realized without DGS. After the description of the underlining theory, several realizations of filters are presented, fabricated, measured, and compared with the implementations reported in the open literature.
II. UNIT CELLS FOR LPF DESIGN
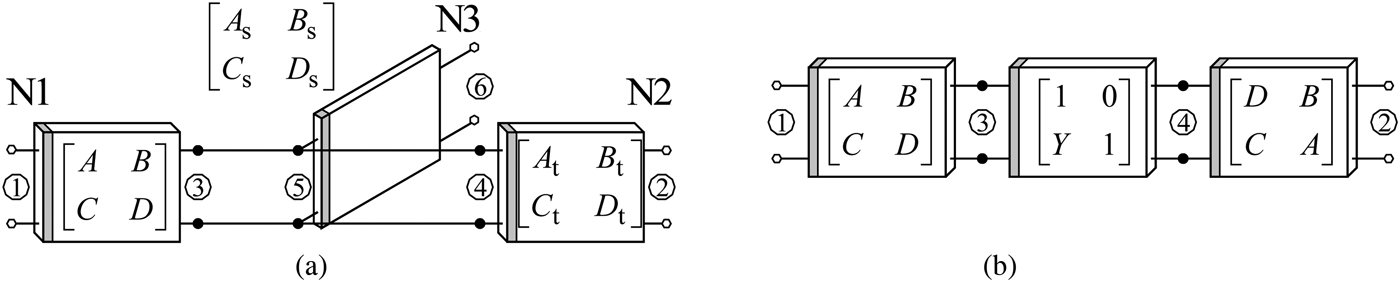
Let us consider a general structure of the unit cell, as shown in Fig. 1. The cell consists of three networks: two networks (N1 and N2) are cascaded and one network is shunted and open ended (N3). Network N2 is the same as N1 except that the roles of its ports are reversed, so that A t = D, B t = B, C t = C, and D t = A. Effectively, two identical networks of ABCD-parameters A, B, C, and D, are cascaded back to back at port ⑤ with the shunt network of ABCD-parameters A s, B s, C s, and D s, whose other port is open (Fig. 1(a)). The shunt network N3 acts as a shunt admittance Y = C s/A s at port ⑤, so it can be replaced by a two-port network of ABCD-parameters 1, 0, Y, and 1 (Fig. 1(b)).
General structure (a) and equivalent structure (b) of the unit cell for LPF design.

The ABCD-parameters of the unit cell are:
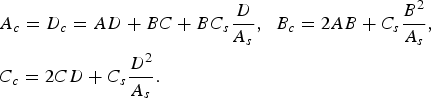 $$\eqalign{&A_c=D_c=AD+BC+BC_s \displaystyle{D \over {A_s }}\comma \; \; B_c=2AB+C_s \displaystyle{{B^2 } \over {A_s }}\comma \; \; \cr & C_c=2CD+C_s \displaystyle{{D^2 } \over {A_s }}.}$$
In an infinite cascade of identical unit cells the wave propagates along the structure only if |(A c + D c)/2| ≤ 1 [Reference Collin6, Reference Foroozesh and Shafai9, Reference Pozar11], which implies existence of pass bands of the structure. For symmetrical unit cells D c = A c and this condition simplifies to |A c| ≤ 1, i.e.
 $$- 1 \leq AD+BC+C_s B\displaystyle{D \over {A_s }} \leq 1.$$
Consequently, condition |A c| > 1 implies existence of stop bands. According to the practical LPF specification only the first pass band around the origin up to some cut-off frequency is desired and the first stop band should be as wide as possible.
In this paper, the networks N1, N2, and N3 will be realized as uniform transmission lines or as cascades of them, whose ABCD-parameters are bounded functions of frequency and equal to zero at some frequencies. In particular, for the shunt network there is a frequency at which the parameter A s passes through zero and changes its sign. Consequently, the expression 1/A s jumps from plus infinity to minus infinity and the parameter A c in the general case changes either from plus to minus infinity, or vice versa. By changing from plus to minus infinity A c must pass through zero, thus satisfying condition (2), resulting in an undesired pass band. In order to eliminate the undesired pass band we set
 $$A_s \equiv D\comma$$
which is further exploited for widening the desired stop band. Namely, by eliminating an undesired pass band the two adjacent stop bands are merged thus creating a wider stop band.
Using (3) and having in mind that for a reciprocal network AD–BC = 1, the pass-band condition (2) and the Bloch impedance [Reference Collin6, Reference Foroozesh and Shafai9, Reference Pozar11] are obtained in the form
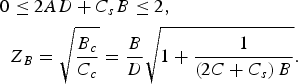 $$\eqalign{0 & \leq 2AD+C_s B \leq 2\comma \; \cr & Z_B=\sqrt {\displaystyle{{B_c } \over {C_c }}}=\displaystyle{B \over D}\sqrt {1+\displaystyle{1 \over {\left({2C+C_s } \right)B}}}.}$$
A) Unit cell made of uniform transmission lines sections – Cell A
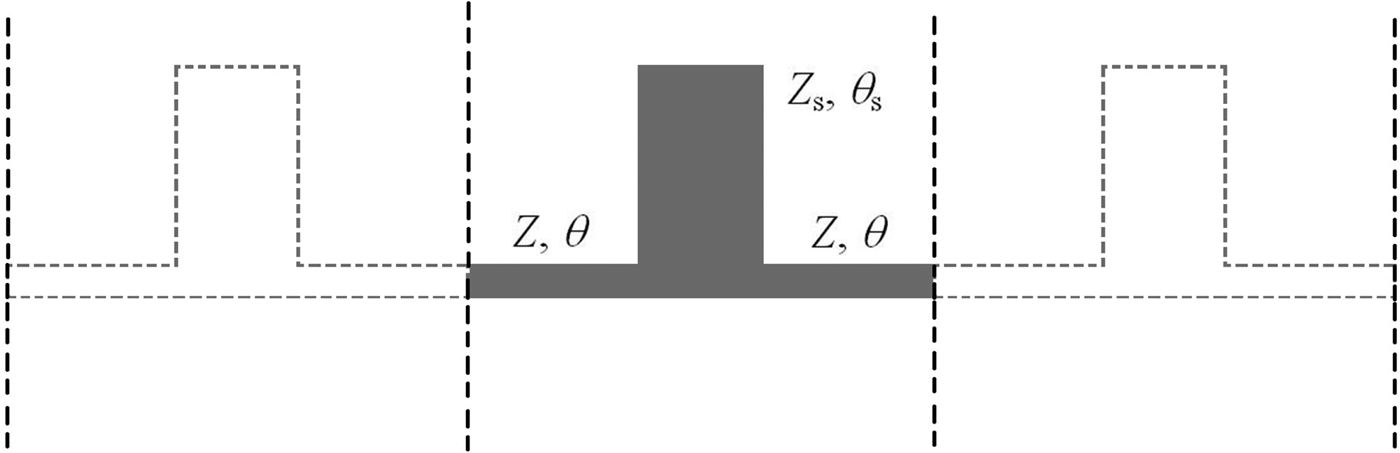
In the basic realization of the unit cell, which is designated as Cell A, the networks N1, N2, and N3 are realized as lossless uniform transmission line sections of equal electrical lengths θ (Fig. 2). The characteristic impedance of N1 and N2 is Z, and the characteristic impedance of N3 is Z s. The corresponding ABCD-parameters are: A = D = A s = D s = cos θ, B = jZ sin θ, C = j sin θ/Z, B s = jZ s sin θ, and C s = jZ sin θ/Z s, so that condition (3) is automatically satisfied.
Unit cell made of uniform transmission line sections – Cell A.
The pass-band condition (4a) and the Bloch impedance (4b) become
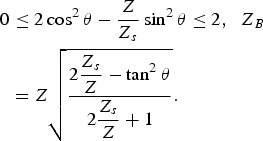 $$\eqalign{0 &\leq 2\cos ^2 \theta - \displaystyle{Z \over {Z_s }}\sin ^2 \theta \leq 2\comma \; \; Z_B \cr & =Z\sqrt {\displaystyle{{2\displaystyle{{Z_s } \over Z} - \tan ^2 \theta } \over {2\displaystyle{{Z_s } \over Z}+1}}}.}$$
The pass-band condition (5a) implies that there are periodic pass bands and stop bands, in terms of θ, with a period of π. Therefore it is sufficient to consider only the first period, i.e. 0 ≤ θ≤ π. The cutoff electrical lengths, which separate pass bands and stop bands, are determined from the left-hand side equality of (5a) as:
 $$\theta _{c1}=\arctan \left({\sqrt {\displaystyle{{2Z_s } \over Z}} } \right)\comma \; \; \theta _{c2}=\pi - \theta _{c1}.$$
Accordingly, three bands can be identified in the first period:
(1) 0 ≤ θ < θc1, the first pass band, which is essential and desired for low-pass design.
(2) θc1 ≤ θ < θc2, the first stop band, which we want to control.
(3) θc2 ≤ θ < π, the second pass band, undesirable, but inherent to periodic structures.
To quantify the stop band, we use a figure of merit, referred to as relative stop bandwidth (RSB), which using (6b) can be expressed as
 $$RSB=\displaystyle{{\theta _{c2} - \theta _{c1} } \over {\displaystyle{1 \over 2}\left({\theta _{c1}+\theta _{c2} } \right)}}=2 - \displaystyle{4 \over \pi }\theta _{c1}.$$
In particular, RSB can be expressed in percent.
After replacing 2Z s/Z in (5b) according to (6a), and after some simple transformations, the Bloch impedance becomes
 $$Z_B=Z\sin \theta _{c1} \sqrt {1 - \left({\displaystyle{{\tan \theta } \over {\tan \theta _{c1} }}} \right)^2 }.$$
It is seen that Z B is close to Z sin θc1 for θ < θc1, except in the vicinity of θc1. This implies that a finite periodic Cell-A array can be practically matched to the nominal impedance Z 0 = Z sin θc1, except in the vicinity of θc1. In that case, the characteristic impedances of Cell A are determined by RSB and the nominal impedance Z 0 as:
(1) The first cutoff electrical length θc1 is determined from (7) as
(9) $$\theta _{c1}=\lpar 2 - RSB\rpar \displaystyle{\pi \over 4}.$$
(2) Impedance of cascaded lines Z is obtained from the nominal impedance as
(10)$$Z={{Z_0 } / {\sin \theta _{c1} }}.$$(3) Impedance of the shunted line is determined from (6a) as
(11)$$Z_s=\lpar Z/2\rpar \tan ^2 \theta _{c1} .$$



Practical filter design requires a finite number of unit cells. Figure 3(a) shows the magnitude response of two Cell-A filters, in terms of electrical length, for three RSB values: 100, 133, and 150% (the results are obtained by circuit simulation using ideal transmission lines). It is seen that the maximum value of s 11 in the pass band is about −20 dB. Figure 3(b) shows the magnitude response of a Cell-A filter for a different numbers of cells and RSB = 150%. It is seen that by increasing the number of unit cells the filter selectivity can be increased, that is, the stop-band attenuation and the roll-off (steepness) can be increased. It can be observed in both figures that the first 3 dB cutoff electrical length is slightly smaller than θc1 and that the second 3 dB cutoff electrical length is slightly larger than θc2; in other words, RSB with respect to the 3 dB cutoff electrical lengths is slightly larger than RSB defined by (7).
Magnitude response of the Cell-A filter in terms of electrical length for (a) two cells and RSB = 100, 133, and 150% and (b) two, three, and four cells and RSB = 150%.
Using the above theory, the two Cell-A filters have been designed with the following specifications: RSB = 150% and Z 0 = 50 Ω. From (9–11) it follows, respectively that θc1 = π/8, θc2 = 7π/8, Z = 130.7 Ω, and Z s = 11.2 Ω. Adopting that θc1 occurs at the first cutoff frequency f c1 = 0.75 GHz, the second cutoff frequency is obtained as f c2 = (θc2/θc1)f c2 = 5.25 GHz.
This filter as well as other filters in this paper have been implemented in microstrip technology on the CuFlon substrate of relative permittivity εr = 2.1, loss tangent tan δ = 0.0004, thickness h = 0.508 mm, metallization thickness t = 17 µm, and metallization conductivity σ = 58 MS/m. For simulation purposes, to take into account the surface roughness of metallization, the conductivity has been set to σ = 18 MS/m.
Using Linpar [Reference Djordjević21] and WIPL-D Impedance calculator [22] the widths of cascaded, shunted, and nominal lines are obtained as w = 0.23 mm, w s = 10.48 mm, and w 0 = 1.61 mm. The same tools are used to calculate the lengths of cascaded and shunted lines. In addition, these lengths have been corrected as follows: (1) all strips of T-junctions are shortened as suggested in [Reference Hong and Lancaster23] and (2) open-ended stubs are shortened to compensate the open-end parasitic capacitance. Thus, the final physical lengths are d = 18.93 mm and d s = 17.00 mm, as shown in Fig. 4.
Layout and magnitude response (s 21) of the two Cell-A filters, which is implemented in microstrip technology in Cuflon. Dimensions are given in mm. All narrow lines are 0.23 mm wide.
Figure 4 shows the magnitude response of the filter versus frequency. The dashed curve refers to the circuit simulation with ideal transmission lines. The solid curve refers to 3D EM simulation performed by WIPL-D Pro [22]. As expected, the frequency response in the stop band is considerably distorted, which cannot be repaired by tuning the widths and the lengths. The observed distortion arises because the implemented T-junction consists of one very wide and two very narrow microstrip transmission lines, so the frequency characteristic of the real junction significantly deviates from the response of the ideal junction. The peak in the middle of the stop band actually indicates that condition (3) is not fully satisfied.
B) Cells made of two-section transmission lines – Cells B and C
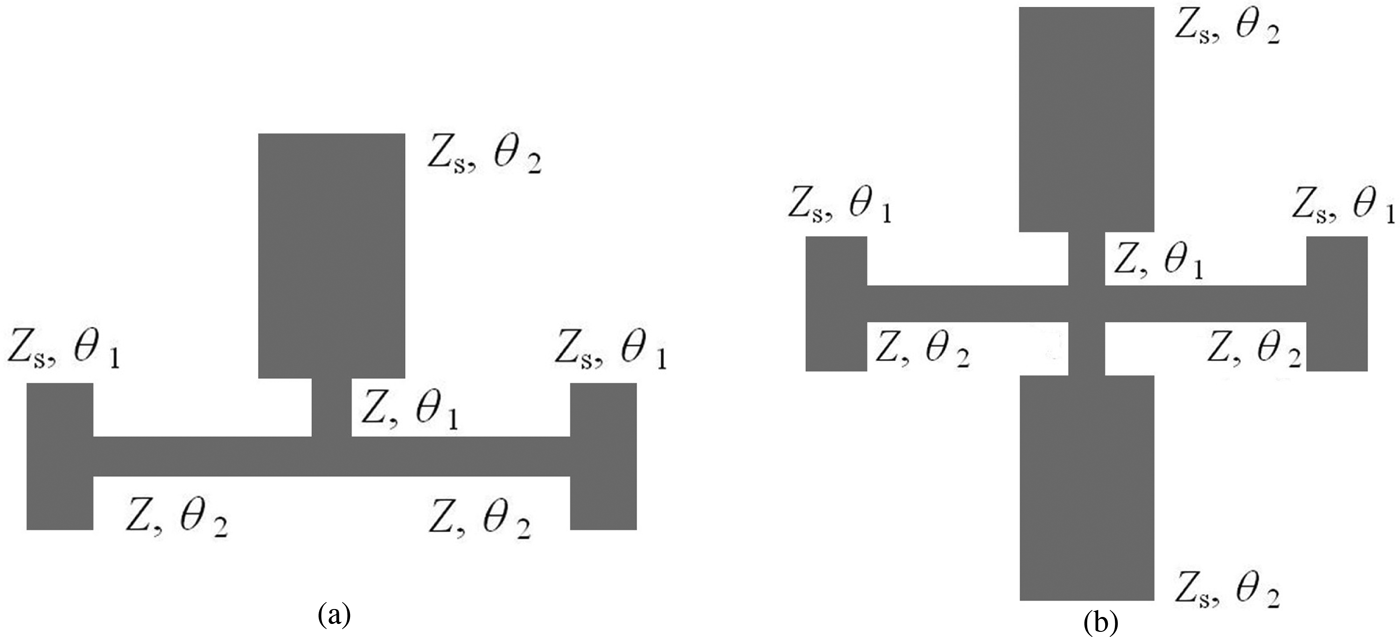
To overcome the problem of the microstrip T-junction formed by one very wide and two very narrow lines each transmission line of Cell A is replaced by two-section lines. Thus Cell B is obtained, as shown in Fig. 5(a).
Unit cells based on two-section transmission lines: (a) Cell B and (b) Cell C.
The parameters A, B, and D of the cascaded two-section lines, and A s and C s of the shunt two-section lines can be expressed as
 $$\eqalign{& A=\cos \theta _1 \cos \theta _2 - \displaystyle{{Z_s } \over Z}\sin \theta _1 \sin \theta _2\comma \; \cr & B=j\left({Z\cos \theta _1 \sin \theta _2+Z_s \cos \theta _2 \sin \theta _1 } \right)\comma \; }$$
 $$\eqalign{& D=A_s=\cos \theta _1 \cos \theta _2 - \displaystyle{Z \over {Z_s }}\sin \theta _1 \sin \theta _2\comma \; \cr & C_s=j\left({\displaystyle{1 \over Z}\cos \theta _2 \sin \theta _1+\displaystyle{1 \over {Z_s }}\cos \theta _1 \sin \theta _2 } \right)\comma \; }$$
so that condition (3) is satisfied. In that case condition (4) can be written as
 $$0 \leq a_0 \displaystyle{1 \over \rho }+a_1+a_2 \rho \leq 2\comma \; \; \rho=\displaystyle{Z \over {Z_s }}\comma$$
 $$\eqalign{& a_{0\comma 2}=- \displaystyle{3 \over 4}\sin ^2 \theta \mp \displaystyle{1 \over 2}\sin \theta \sin \Delta \theta+\displaystyle{1 \over 4}\sin ^2 \Delta \theta\comma \; \cr & a_1=\displaystyle{1 \over 2}\cos ^2 \Delta \theta+\displaystyle{3 \over 2}\cos ^2 \theta\comma \; }$$
where θ = θ1 + θ2 and Δθ = θ2 − θ1.
For θ1 = 0 Cell B reduces to Cell A. If θ1≪θ2, Cell B behaves very similar to Cell-A and Cell-B parameters can be approximately determined in the same way as Cell-A parameters, using (9–11). The corresponding results for two Cell-B filters obtained by the circuit simulation with θ1 = θ/10 are shown to be very close to those for two Cell-A filters given in Fig. 3, except that the stop band is slightly narrowed and the transmission zero is shifted to lower frequencies. However, the results obtained by 3D EM simulation are shown to agree very well with those obtained by circuit simulation. This means that the two Cell-B filters implemented in microstrip technology satisfy condition (3) very well, which is not the case with the two Cell-A filters.
The precise value of ρ = Z/Z s is determined from the left-hand side of inequality (13a), that is, by solving the equation a 0 + a 1ρ + a 2ρReference Malherbe2 = 0. Such obtained ρ and equation (10) can be used to calculate Z and Z s. However, the return loss in the pass band of the two Cell-B filters can be further refined by increasing the initial value of Z given by (10) until the maximum value of |s 11| in the pass band is minimized. Thus obtained optimal values for Z and Z s are shown versus RSB in Fig. 6(a). Figure 6(b) shows the refined magnitude response of the two Cell-B filters (θ1 = θ/10) versus θ for RSB = 100, 133, and 150%. It is seen that the maximum value of refined s 11 is about −30 dB in the pass band, almost 10 dB below the unrefined values shown in Fig. 3(a). Similarly, the maximum value of |s 11| in the pass band of three and four Cell-B filters can be minimized by adjusting Z of the inner cells, Z 1, and Z of the outer cells, Z 2, as will be applied in Section 3. It is also seen that the first transmission zero shifts from θ = π/2 toward the origin by increasing RSB. This zero is obtained from the condition that the shunt impedance Z = A s/C s is equal to zero, i.e. A s = 0, where A s is given by (12c). After expanding A s in the first-order Taylor series about θ = π/2, the approximate formula of this zero is obtained in the form θ0 ≈ (12.858 + 0.279 Z/Z s)/(7.363 + Z/Z s) predicting the zeros from Fig. 6(b) with an error less than 3%.
Two Cell-B filters with optimized return loss in the pass band for Z 0 = 50 Ω and θ1 = θ/10: (a) Z and Z s versus RSB and (b) magnitude response in terms of electrical length for RSB = 100, 133, and 150% (circuit-level simulation).
Generally, RSB is preserved if optimal Z and Z s are proportionally increased (decreased) while the maximum |s 11| in the pass band is increased. Thus, if an optimal value of Z is higher than the maximum realizable value Z max and ρ < Z max/Z min, the filter with a given RSB may still be realized by adopting Z = Z max and Z s = Z max/ρ. Similarly, if an optimal value of Z s is lower than the minimum realizable value Z min and ρ < Z max/Z min the filter with a given RSB may still be realized by adopting Z s = Z min and Z = Z min/ρ. Obviously, the maximum |s 11| in the pass band of such filters would be increased when compared to the theoretical minimum shown in Fig. 5(b).
The maximum realizable RSB that can be obtained with Cell B is determined by ρ = Z max/Z min. The maximum realizable RSB can be further extended if Cell B is modified to Cell C, in such a manner that the shunt network is realized as a pair of two-section transmission lines connected in parallel, as shown in Fig. 5(b). In particular, for θ1 = 0 equations describing Cell C are the same as those describing Cell A, except that Z s should be replaced by Z s/2. Similarly, for θ1 > 0 equations describing Cell C are the same as those describing Cell B, except that C s given by (12d) is doubled and the coefficients a 0, a 1, and a 2 are modified to a 0,2 = −sinReference Malherbe2θ ∓ sinθsinΔθ and a 1 = cosReference Malherbe2θ. The key benefit of Cell C lies in the fact that it practically halves the ratio ρ = Z/Z s required by the Cell-B filter design and increases the maximum realizable RSB for about 40%.
III. SIMULATION, FABRICATION, AND MEASUREMENT
The theory of designing low-pass microwave filters with a deep stop band and a controllable rejection bandwidth, presented in the previous sections, has been verified by several implementations in microstrip technology and corresponding laboratory prototypes. The fabricated filters were measured and the experimental results were compared with the results of the circuit simulation and the full-wave 3D EM simulation. The laboratory prototypes were fabricated on the CuFlon substrate, whose parameters are given in Section II.A. In addition, the electrical lengths of wide transmission lines are further shortened for 5% of the difference in width between these lines and narrow lines to which they are connected. Using full-wave 3D EM simulation [22] we confirmed that such an adjustment mostly reduces the deviation of the frequency characteristics of the implemented step discontinuities from the frequency characteristic of the ideal step. In all cases Z 0 = 50 Ω and θ1 = θ2/10 are used.
In the first two examples Cell B is designed to have (1) f c1 = 1 GHz and f c2 = 5 GHz (RSB = 133%) and (2) f c1 = 0.75 GHz and f c2 = 5.25 GHz (RSB = 150%) in an infinite periodic array of cells. Two identical cells are combined in a filter using optimal values for impedances given in Fig. 5(a): (1) Z s = 18.6 Ω and Z = 115.2 Ω and (2) Z s = 12.9 Ω and Z = 153.9 Ω. Physical dimensions are given in Fig. 7. The filters' characteristics are shown in Figs. 8 and 9. It is seen that cutoff frequencies for the two Cell-B filters are slightly different from those used to design Cell B, i.e. these parameters are: (1) f c1 = 0.96 GHz, f c2 = 5.12 GHz and (2) f c1 = 0.72 GHz, f c2 = 5.30 GHz. It is concluded that in the design of the two Cell-B filters of given f c1 and f c2, the unit cell should be designed with a slightly larger value of f c1 and a slightly smaller value of f c2.
Photograph of the fabricated two Cell-B filters with (a) RSB = 133% and (b) RSB = 150%. Dimensions are in mm. Narrow lines are: (a) 0.32 mm wide and (b) 0.14 mm wide. Connectors are SMA (not shown in the figures).
Magnitude response of the two Cell-B filters shown in Fig. 7(a) with RSB = 133%: (a) comparison of circuit and 3D EM simulation and (b) comparison of measurements and 3D EM simulation.
Magnitude response of the two Cell-B filters shown in Fig. 7(b) with RSB = 150%: (a) comparison of circuit and 3D EM simulation and (b) comparison of measurements and 3D EM simulation.
In the third example Cell B is designed to have f c1 = 0.75 GHz and f c2 = 5.25 GHz (RSB = 150%) in an infinite periodic array of cells. Initially, three identical cells are combined in the filter using optimal values for Z and Z s given in Fig. 5(a), i.e. Z s = 12.9 Ω and Z = 153.9 Ω, resulting in a maximum value for |s 11| in the pass band of about −14 dB. To decrease it, Z of the inner cell, Z 1, and Z of the outer cells, Z 2, are independently adjusted, resulting in Z 1 = 137.0 Ω (Z s1 = 11.9 Ω) and Z 2 = 151.4 Ω (Z s2 = 13.2 Ω). Final physical dimensions, after all corrections, are given in Fig. 10(a). The filter characteristics are shown in Fig. 11. Note that the maximum value of |s 11| in the pass band is just below −20 dB. As expected, the first cut-off frequency of the filter is slightly lower than that used to design the unit cell, i.e. f c1 = 0.72 GHz.
Photographs of the fabricated (a) three Cell-B filters with RSB = 150% and (b) two Cell-C filter with RSB = 163.6%. Dimensions are given in mm. All narrow lines are 0.14 mm wide. Connectors are SMA.
Magnitude response of the three Cell-B filters shown in Fig. 10(a): (a) circuit simulation results are compared with 3D EM simulation and (b) measured results are compared with 3D EM simulation.
In the last example, two Cell-C filters are designed to have f c1 = 0.72 GHz and f c2 = 11f c1 = 7.92 GHz. The maximum filter impedance is set to Z = 154 Ω, which is considered to be the maximum feasible impedance using available technology. The minimum filter impedance is found to be Z s = 13.6 Ω. Physical dimensions, after corrections, are given in Fig. 10(b). The filter's characteristics are given in Fig. 12. Note that the maximum value of |s 11| in the pass band is just below −13 dB.
Magnitude response of the two Cell-C filters shown in Fig. 10(b): (a) circuit simulation results are compared with 3D EM simulation and (b) measured results are compared with 3D EM simulation.
The performance of a typical fabricated filter can be described by quantities shown in Fig. 13. In order to evaluate the filter implementations proposed in this paper and compare them with implementations published in the open literature several additional quantities are defined: the normalized stop-bandwidth (NSB), the normalized transition width (NTW), and the normalized footprint (NFP), i.e.
 $$\eqalign{& NSB=\;\displaystyle{{f_{reject} - f_{stop} } \over {f_{pass} }}\comma \; \; NTW=\;\displaystyle{{f_{stop} - f_{pass} } \over {f_{pass} }}\comma \; \cr & NFP=\displaystyle{{a\, b} \over {\lambda _{\rm g}^2 }}\comma \; }$$
where a and b are the dimensions of the smallest rectangle encompassing the filter, and λg is the guided wavelength at f pass for the 50 Ω line.
Quantities for performance evaluation.
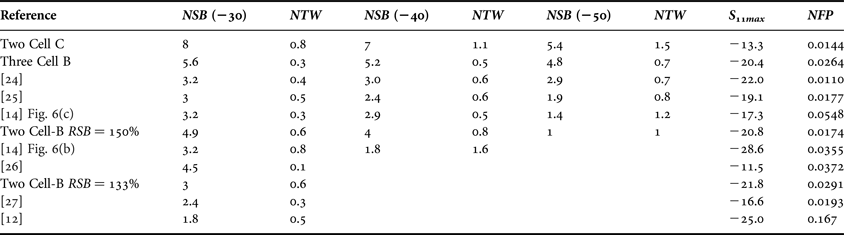
Measured values of NSB and NTW, S 11max, and NFP for the proposed filters and representative filters reported in the open literature are summarized in Table 1, for S 21stop = −30, −40, and −50 dB, respectively. The entries are sorted by NSB at −50 dB.
Comparison of filter implementations for S 21stop = −30, −40, and −50 dB.
Experimental results reported in [Reference Khakzad, Sedighy and Amirhosseini24] show a very compact LPF design NFP = 0.011, good return loss S 11max = −22 dB, and high selectivity NTW(50) = 0.7. Its rejection band is wide, but narrower compared with the proposed solution.
IV. CONCLUSION
The fabricated LPFs exhibit a very deep and very wide stop band, a fairly good transition bandwidth and return loss, and a small footprint. For example, a filter with a 30 dB (50 dB) stop-band rejection has been designed featuring a NSB of 8 (5.4), a NTW of 0.8 (1.7), return loss of 13.3 dB, and a NFP of 0.0144. Other filter realizations, which are reported in the open literature to have a stop-band rejection higher than 30 dB, might feature better selectivity, but at the expense of a significantly reduced rejection bandwidth. For all fabricated filters very good agreement between simulated and measured results is observed. In particular, it should be noted that all final models have been obtained directly after the circuit simulation, without adjusting of either the 3D EM model or the fabricated prototype. With the possibility to control the rejection bandwidth, the proposed design might be considered as a good candidate when a deep and wide stop band is of prime interest.
ACKNOWLEDGEMENT
This work was supported by the Serbian Ministry of Education and Science under grant no. TR32005.
Dusan A. Nesic was born in Belgrade, Serbia, in 1961. He received the B.Sc. (1987), M.Sc. (1995), and Ph.D. (2011) degrees in Electrical Engineering from the School of Electrical Engineering, University of Belgrade, Serbia. He is currently with IHTM-CMTM, University of Belgrade, Belgrade, Serbia. His research interests include passive microwave structures, microwave and millimeter antennas, and sensors and photodiodes.
Branko M. Kolundzija was born in 1958 in Zenica, former Yugoslavia. He received the B.Sc. (1981), M.Sc. (1986), and Ph.D. (1990) degrees from University of Belgrade, Serbia. He joined the Faculty of Electrical Engineering, University of Belgrade in 1981, where he is currently a Full Professor in Electromagnetics and Antennas. He is co-author of 2 monographs, 29 journal articles, and 110 articles at international conferences. His research interests are electromagnetic modeling, antennas, and microwave components. He is a fellow IEEE and the main architect of the WIPL-D software.
 Dejan V. Tošić was born in Belgrade, Serbia, in 1957. He received the B.Sc. (1980), M.Sc. (1986), and Ph.D. (1996) degrees in Electrical Engineering from the School of Electrical Engineering, University of Belgrade, Serbia. He is currently a Full Professor with the School of Electrical Engineering, University of Belgrade. His research interests include symbolic computation and signal processing, RF and microwave filter design, and design of passive microwave circuits.
 Dario S. Jeremic was born in Bihac, former Yugoslavia, in 1986. He received the B.Sc. (2009) and M.Sc. (2010) degrees in Electrical Engineering from the School of Electrical Engineering, University of Belgrade, Serbia. He is currently working on his Ph.D. degree in Microwave Engineering. His research interests include computational electromagnetics, RF and microwave filter design, and design passive microwave circuits and filters.