1. Introduction
The Chairman (Mr N. J. H. Salter, F.I.A., President of the Institute and Faculty of Actuaries): It is my pleasure to welcome you and 250 or so people watching this through a webcast.
This lecture is part of a programme that we run of Spring and Autumn lectures, one in London and one in Edinburgh, each year. The idea is that these lectures should be of interest both to members of the actuarial profession but also people who are not in the actuarial profession, so widen the interest and the themes. That is why we are heading it the Thought Leadership Lecture. These are ideas that we should all be able to get hold of and take forward. They are not specifically actuarial matters.
Our guest speaker is Dr Andrew Sentance. Andrew is senior economic adviser to PricewaterhouseCoopers (PwC), a firm that he joined in November 2011, after spending 6 years serving as an external member of the monetary policy committee of the Bank of England, where he was at the heart of the UK policy response to the financial crisis and its aftermath.
After studying at Cambridge and the LSE, Andrew began his career as a business economist at the CBI in the mid-1980s before moving to the London Business School in 1994. While at the CBI, he was a founder member of the Treasury’s panel of independent forecasters, also known as the Seven Wise Men.
Immediately before joining the Bank of England, Andrew was chief economist at British Airways, where he also worked on business strategy and planning, airport policy, airport regulation and environmental affairs.
Andrew is a part-time professor at Warwick Business School, a visiting professor at Royal Holloway London and is a vice-president of the Society of British Economists.
Dr A. Sentance, CBE: The 21st century has not started well in terms of sustainable growth. In conventional terms, the growth figures look impressive. According to the IMF, world GDP this year is expected to be nearly $75 trillion, an increase of 125% on the $33 trillion of economic output generated in 2000. Even if we take inflation out of the equation, the increase has still been 75% in real terms – an average annual growth rate of nearly 4%.
We know that we have had a very bumpy ride over the past decade and a half. We now know that the first 7 or 8 years of growth in this century was dependent on a financial bubble, exploded spectacularly and created the global financial crisis of 2008/2009. The problems with Greece and the euro area remind us that we are still feeling the aftershocks from that episode in parts of the world economy.
We have also made little progress in solving the world’s major challenge in terms of achieving environmentally sustainable growth – climate change. The Kyoto Protocol has run its course and was not very effective in acting as a spur to the reduction of carbon emissions, with the possible exception of the actions taken by the European Union. The nations of the world have yet to put in place a comprehensive successor agreement, despite annual summits, with the next one scheduled for Paris, this December. In the meantime, global carbon dioxide emissions were nearly 40% higher last year, compared with the level we saw in 2000. Indeed, the growth of emissions appears to have accelerated over the past few years – as I will show later in this lecture.
Yet, there are still some grounds for optimism. A number of major western economies – including the UK – seem to be returning to a steady growth track and unemployment rates in northern Europe and North America have returned to levels close to their pre-crisis levels. I will argue later in this lecture that we may be on the cusp of a new growth wave for the major western economies. There are still major challenges ahead to ensure that growth will be sustainable in all the senses of that word.
The outline of this lecture is as follows.
First, I will discuss what we mean by sustainable growth. There is no universally agreed definition – sustainability is a multi-dimensional and complex concept. Second, I will introduce the idea of long growth waves – by looking at the experience of the UK economy over the past 200 years since the Battle of Waterloo and the end of the Napoleonic Wars.
Third, I will discuss the potential for the start of a new growth wave in the UK and western economies.
Finally, I will spell out the business, investment and policy implications of my analysis.
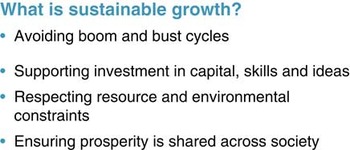
What is sustainable growth?

2. The Concept of Sustainable Growth
What do we mean by sustainable growth? One of the common frameworks for addressing sustainability is the “three pillars” approach – an economy which achieves an appropriate balance of economic, environmental and social progress. In my view, there are four big challenges which flow from this, which are summarised on Figure 1.
The first challenge is to avoid excessive volatility in the economy – repeated boom and bust cycles in which individuals cannot plan ahead and businesses are too uncertain to invest. We cannot totally eliminate the economic cycle and all fluctuations in economic activity. Policy-makers should avoid aggravating the ups and downs of the economy through their own actions. I will later argue that long waves of growth interspersed by periods of economic and financial turbulence seem to be a historical feature of economies like the UK. Indeed, if we go back to biblical times, we find in the book of Genesis the world’s first recorded economic cycle. When Joseph interprets Pharaoh’s dream in Genesis chapter 41, he predicts 7 good years of harvest in ancient Egypt, followed by 7 bad years. Indeed, this is not only the world’s first recorded economic cycle, but the first example of an economic forecast!
Over the past 200 years, we have discovered that three big impediments to a steady pattern of growth are international conflict – including war, inflation and financial excesses of various sorts. The experience of high inflation in the 1970s and early 1980s meant that this was seen as the main threat to economic stability in the period of growth, which started in the mid-1980s and continued after the 1990s recession until 2007. With hindsight, we should have been more focussed on the potential instabilities in the financial system, which triggered the global financial crisis and the recession in 2008/2009. We also saw in the early years of the 2000s, after 9/11, how terrorism, international conflict and war could create turbulence in the world economy.
A second important element of sustainability is ensuring the right balance between consumption and investment in an economy. Economic growth needs to be underpinned by investment in fixed capital – buildings, plant and machinery – as well as skills and ideas, the process of innovation. As our economy becomes more services oriented and complex, skills and ideas are becoming more important relative to fixed capital investment.
Third, we need to respect resource constraints and adverse environmental impacts. As economies get richer, they generally develop frameworks for dealing with local environmental impacts – such as air and water pollution and poor waste management. What we have not done so successfully is to deal with big global environmental challenges and in particular the threat of climate change. In the late 1980s, the nations of the world did agree the Montreal Protocol which has successfully phased out the chemicals which were attacking the ozone layer, like CFCs. We have been much less successful at acting internationally to address the challenge of climate change.
The fourth element of a sustainable growth path for an economy is a situation where the proceeds of economic growth are distributed reasonably fairly across society. That does not mean that we can ensure a totally equitable outcome in a world where there are all sorts of inequalities between individuals in terms of skill, capability and effort. A society in which some groups benefit little or not at all from economic growth is in danger of becoming politically and economically unstable. So a balance needs to be struck between policies which promote social inclusion and redistribute income through the tax and benefit system, while avoiding measures which severely blunt incentives and hence undermine the fundamental underpinning of a successful economy.
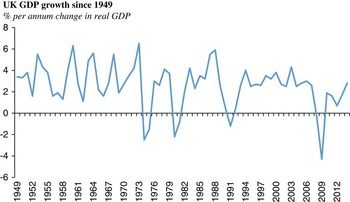
UK GDP growth since 1949Source: ONS.

So how have we been doing in recent times if we think about these four aspects of sustainable growth?
Taking the boom–bust cycle first, Figure 2 shows UK economic growth since the Second World War and we have certainly seen quite a bit of volatility. However, the periods which stand out are the four big recessions in the mid-1970s, early 1980s, early 1990s and in 2008/2009. These were all aggravated to some degree by policy mistakes. In the 1970s, inflation and public finances were allowed to get out of control, and the depth of the early 1980s recession and the consequent period of high unemployment in the UK were partly a consequence of this. The early 1990s recession was also triggered by the need to have high interest rates to control inflation after the late 1980s Lawson boom. And the 2008/2009 recession reflected the imbalances and excesses in the financial system following the global credit boom.
However, in all these downturns there was also an international dimension to the recessions we suffered here in the UK. Many other economies suffered recessions in the mid-1970s, early 1980s, early 1990s and 2008/2009, which were also weak periods for the global economy more generally. So another conclusion we might draw from this experience is that in a very interdependent global economy, we cannot stabilise our economy in isolation from what is happening to our major trading partners. The logical remedy to this feature of the economic cycle would be to have much more co-operation on economic policy between nations. We can see within Europe and the euro area how difficult this is to achieve within a group of countries which have already agreed to co-operate politically and economically, let alone at the wider global level.
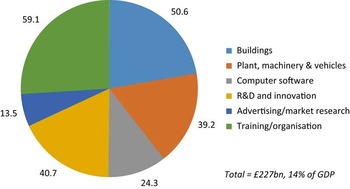
UK business investment in 2011 (£bn)

The second aspect of sustainable growth I highlighted was the need for economic growth to be underpinned by investment. We have frequently debated here in the UK whether we need to invest more heavily in fixed capital investment – and the UK’s ratio of capital spending to GDP is generally lower than other countries. In our modern economy, other forms of less tangible investment are becoming just as important if not more so. As Figure 3 shows, UK-based businesses spend more on intangibles such as skills, market research, computer software, than they do on buildings, plant, and machinery and vehicles.
A lot of the focus on investment in physical capital reflects an economy which was heavily dominated by manufacturing and industrial processes which relied heavily on plant, machinery and buildings. In the more services and information-oriented economy we now inhabit, various forms of intangible investment are becoming much more important. The data on all these various forms of investment is not so readily measured and updated – which is the reason why the data on this slide is a few years’ out-of-date. Looking ahead, we need to start thinking about this broader concept of investment as a more relevant measure for the 21st-century economy.
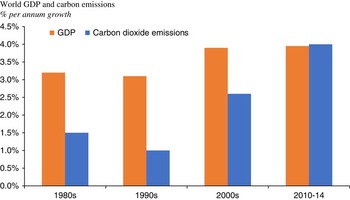
World GDP and carbon emissions

I mentioned earlier that from the perspective of climate change and carbon emissions, economic growth appears to be growing less sustainable, not more so, and Figure 4 is the evidence for that view. Climate change is potentially a global economic problem, so we need to look at it in terms of the global footprint of economic activity.
In the 1980s and 1990s, before the period of intense globalisation we have seen this century, carbon emissions were growing at around 1%–1.5% compared with world economic growth of just over 3%. Since then, in the current century, world economic growth has accelerated, particularly in the large economies of Asia – China, India and Indonesia – and as these economies have industrialised and developed their contribution to global carbon emissions has increased significantly. In fact, the latest data from the BP Review of Energy Statistics shows that in the OECD economies, led by the US and Europe, carbon emissions peaked in 2007 and are now 8% below that level. By contrast, the emerging and developing economies outside the OECD now account for over 60% of world carbon emissions, with the richer OECD countries responsible for <40%.
This highlights another area where international co-operation is necessary to achieve sustainable growth. An individual country cannot escape the consequences of global climate change, however good its own environmental record might be.
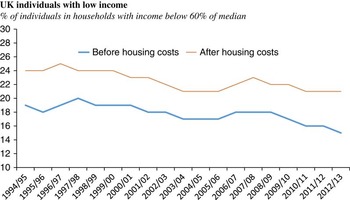
UK individuals with low income

The fourth aspect of sustainable growth I highlighted was social inclusion and income inequality. Many western economies – including the UK – have seen a rise in inequality in the distribution of incomes in the more advanced economies in the world.Footnote 1 According to the OECD and other analysts, the forces of globalisation and new technology have played a major part in this change. In the UK and other western economies, globalisation and technology have advantaged people with high skills and scarce capabilities relative to those with low skills – particularly if the latter are relying on basic manual labour. Even though our economies have systems designed to redistribute income from the rich to the poor, and help the disadvantaged improve their economic prospects, these mechanisms may not be adequate in the face of the accelerating pace of economic change.
In the UK, analysis by the Institute for Fiscal Studies (IFS) confirms the growing importance of insecure employment prospects and low wage growth to the issue of poverty in the UK. IFS economists note that until the 1970s, the main causes of poverty in the UK were old age and persistent unemployment. More recently, they conclude:
“Poverty has become much more of an in-work phenomenon since the 1970s, as increased earnings inequality in the 1980s and relatively slow growth in earnings since have pushed more low and middle earners into poverty. This shift in poverty from something concentrated among the old and workless to something increasingly felt by employed and self-employed working-age adults is a major socio-economic change”.Footnote 2
Figure 5 shows one measure of income inequality for the UK since the mid-1990s, which marked the start of the era of intense globalisation as China, India, Eastern Europe and the former Soviet Union economies integrated into the world economy. Interestingly, though, the number of individuals living at incomes significantly below average has not increased over this period; in percentage terms it has fallen. This reflects the protection afforded to low-income households in an economy like the UK by a redistributive tax system and an extensive system of benefit payments. The increase in the personal tax allowance to over £10,000 a year under the coalition government has also helped working people on low incomes.
3. A Zero-Growth Economy?
Before moving on to think about the prospects for sustainable economic growth looking ahead, I would just like to deal with one issue which sometimes comes up in this context, the notion of a zero-growth society. The idea of zero growth really highlights the tension between different aspects of a sustainable economy and the need to strike a balance between the economic, social and environmental strands of sustainability.
There are three main arguments against setting our sights on a zero-growth world, in my view, even in countries like the UK which have already achieved a high standard of living. First, the global economy has become highly interdependent, and in the financial crisis we witnessed how a disruption to some key parts of our economy rippled round the world in a fairly indiscriminate way. With many poorer economies dependent on rising demand and investment from richer economies, a zero-growth policy in the West would most likely stifle the development of poorer economies too. It would kick away the ladder of growth in trade and investment which countries like China, India and Indonesia have used to support their rapid development since the 1990s.
Second, a zero-growth policy could be very bad for employment. We rely on a degree of economic growth to absorb the increases in economic output created by a rising population and technological progress, which tends to raise the productivity of the labour force over a period of time. By pursuing a zero-growth strategy, productivity increases reflecting technological change would displace employees and create a worsening problem of unemployment. While this problem could technically be solved by encouraging everyone (or some people) to work less, it is not obvious that this outcome should be enforced on our economy if it is not a natural outcome reflecting individual choices to prefer leisure over gainful employment.
Third, a zero-growth economy is likely to be divisive rather than inclusive. It means that those on lower income could only improve their prospects at the expense of those on higher incomes and vice versa. This potentially creates a “zero-sum” society – in which I can only improve my prospects at your expense. A growing economy avoids this problem and creates the possibility that everyone can see some rise in living standards even if there are variations in the experience of different sections of the population.
So zero growth is unlikely to be economically or environmentally sustainable, even if there are some who believe it is an environmentally desirable outcome. Instead, we need to find an approach to growth which strikes a sensible balance between economic, social and environmental objectives. But we first need to understand how the process of economic growth has evolved in the UK and other western economies over the period of industrialisation which has shaped the current position of our economies.
4. Long Growth Waves
To understand where we are currently in terms of economic growth, I want to introduce you to the concept of long growth waves.
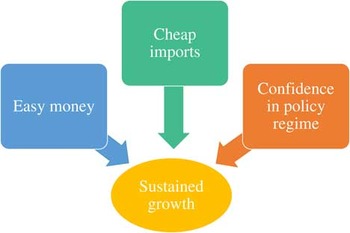
Pre-2007 drivers of economic growth

A few years ago, when I started thinking about the position of the major western economies like the UK after the financial crisis, it became clear that we had come to the end of a long growth wave which had its roots in the 1980s. From the 1980s until 2007, economic growth in the West was supported by three factors which prevailed for most of the period and shaped the nature of our economies – easy money, cheap imports driven by the shift in production of many goods to low-cost countries like China and confidence in the ability of governments and Central Banks to head off downturns, which meant that the private sector retained its confidence in underlying business conditions. Other factors also contributed to growth over this period – including the application of new technologies, especially in information technology (IT) and mobile communications. Technology has been a fairly consistent underpinning of economic growth in the West for about 200 years.
The three factors on Figure 6 were tailwinds to growth, in my view, and they disappeared around the time of the financial crisis. The easy money was undermined by the problems in the banking system and the response of regulators in imposing tougher prudential requirements. The benefit of cheap imports of manufactured goods began to be offset by a big spike in global energy, food and commodity prices – from the mid-2000s onwards. Confidence in the economic policies of governments and Central Banks was shaken by the realisation that they could not return us to our previous growth track after the financial crisis.
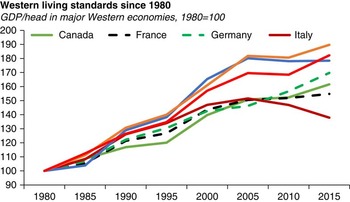
Western living standards since 1980Source: IMF World Economic Outlook, April 2015.

Having said all that, if we look at how the largest western economies have moved forward since this growth wave started in the early 1980s, there are some pretty impressive performances. The UK leads the pack on this measure with GDP per head of population nearly doubling over the past 35 years. This is a fact worth remembering and recognising amidst all the agonising about sluggish UK productivity growth in recent years, which has brought a mood of unwarranted pessimism in its wake.
The US has performed similarly to the UK on this measure, and – despite its short-term problems – Spain has benefited over the long term in the post-Franco world as it has integrated itself into the EU and modernised its economy. The two worst-performing economies in this period have been France and Italy, and this reflects their inability to reform their labour markets and introduce other business-friendly economic reforms. Indeed, Italian GDP per capita is now going backwards and is now nearly 10% below where it was in 2005.
It is clear from Figure 7 that most western economies have struggled to make progress since the mid-2000s, reflecting the impact of the financial crisis and a sluggish recovery. However, the question this poses is whether this is a temporary phase, or whether we are shifting gradually into a better growth phase where we may see a return to a better and more sustained increase in living standards.
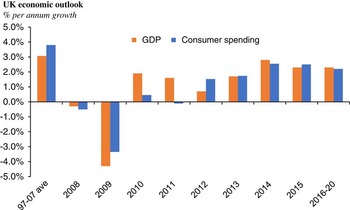
UK economic outlookSource: Office for National Statistics and PwC Forecasts.

The UK’s economic performance is interesting in this context. Here in the UK we appear to have entered a better phase of economic growth beginning around 2013. Growth picked up to 2.8% last year when the UK led the growth league. Growth of 2%–2.5% is forecast for this year and for the remainder of this decade. So it looks like the UK economy is moving out of the post-crisis economic doldrums and is set for a more sustained period of economic growth.
However, if we compare current forecasts with the decade before the crisis shown on the left of Figure 8, growth is not expected to return to the average we experienced in the decade before the financial crisis. In terms of consumer spending, growth of 2%–2.5% is significantly short of the 3.5%–4% experienced before the financial crisis. We should not bemoan this fact too much; however, if the rates of growth we now foresee for the economy as a whole and for the consumer are more sustainable, which I believe is the case.
I have described this more subdued growth outlook for the UK and for other western economies as the New Normal for economic growth. The idea here is that we have lost the tailwinds which carried us forwards, perhaps unsustainably, before the financial crisis. A respectable rate of growth is still possible for economies well adapted to our new world, including the UK.
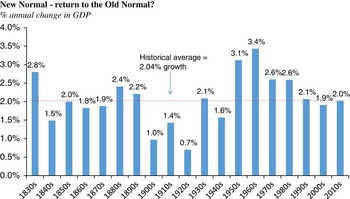
New Normal; return to the Old Normal?Sources: Bank of England (1830–1949), ONS(1950--2013) and PwC forecasts.

In judging what a respectable rate of growth might be, it helps to have a bit of historical context. Since 1830, the UK economy has grown by just over 2% a year. There were fluctuations around this rate of growth in the 19th century. The first half of the 20th century saw prolonged sub-standard growth, with two world wars taking their toll. You can see Figure 9 the strong post-war recovery in the 1950s and 1960s. More recently, growth has been dropping back towards the 2% norm.
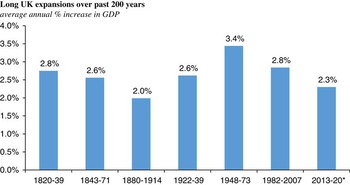
Long UK expansions over past 200 years. *partly forecast Sources: Bank of England; ONS; University of Warwick; PwC.

However, there is a different way of looking at this economic growth experience, which may be more instructive. This slide seeks to identify prolonged growth waves over the period since the Battle of Waterloo, which marked the end of the Napoleonic Wars 200 years ago. Immediately after that, the UK economy went through some very difficult times including a period of severe political unrest in the late 1810s. From 1820 onwards, the UK economy experienced the first of a series of six long growth waves where growth averaged 2% or above, which have shaped our economy since the industrial revolutions. These were characterised by different phases of technological and industrial development: the railways, sewers and other big engineering projects in the mid-19th century; steamships, consumer goods and mechanisation of agriculture from the 1880s through to the First World War; electricity, radio and the motor car between the wars; and post-war reconstruction and mass market consumer goods in the 1950s and 1960s.
The intervening years were periods of conflict and economic and financial turbulence, including the two world wars and their aftermath. The message from Figure 10 is that after a period of 5–10 years of economic difficulty, a well-functioning economy like the UK has the capacity to embark on a new growth wave. The rate of growth will not be the same as the past, and the characteristics of each growth wave will be different. In a market economy where firms and individuals have the opportunity to seek out new sources of growth, they can do so once political, economic and financial conditions stabilise.
5. A New Growth Wave?
On the right of Figure 10, I have added a seventh bar covering the period since 2013 when the UK economy has been growing more strongly. If this is the start of a new growth wave, it has started after a relatively short period – 5 years after the traumas of 2008. This new growth wave – if it continues and develops – is not particularly strong, which may not be that surprising. As economies mature and become more services oriented, the potential for productivity growth is likely to fall. There are also concerns that conventional measures of economic progress do not properly capture the growth driven by the digital economy and the internet.
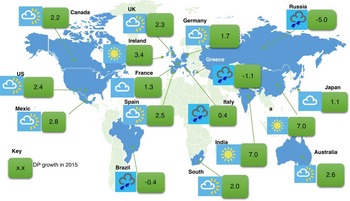
Global growth in 2015: PricewaterhouseCoopers (PwC) forecasts

How confident can we be that this is the start of a new growth wave? One positive characteristic is, as shown in Figure 11, that we are seeing improving prospects across a number of economies, mainly based in northern Europe and North America, though Spain is also seeing a growth turnaround and is projected to grow by around 2.5% this year. Other southern European economies, Greece and Italy, and France are forecast to perform less well. These are economies which have struggled to introduce economic reforms to create more flexible labour markets and more business-friendly economies, which can adapt to the New Normal economic world.
However, it is hard to spot the drivers of the next growth phase in advance. In the early 1980s, when the previous long growth wave started, we could not foresee how the internet and mobile communications would transform our society and economy. Looking at the primitive computers available over 30 years ago, like the Sinclair ZX and the Commodore 64, it would have been hard to predict the information and communications revolution which was to follow.
So we cannot be definitive about the drivers of a new growth wave. Technology will play a major part – as it has since the Industrial Revolution – though we should not think just in terms of IT and communications. Materials technologies, biotechnology, and developments in the energy and environmental sectors will also play a part. Technology is not the only factor at work. Previous waves of growth have also been driven by major social changes and new business opportunities. In addition to new technology, there are four other major forces which can support a new growth wave in the UK and other western economies – globalisation, demographics, a services sector revolution and a shift in the energy system to a more sustainable low carbon model. Let me say a few more words on each of these.
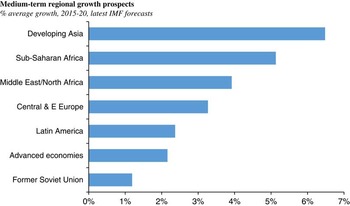
Medium-term regional growth prospectsSource: IMF World Economic Outlook, April 2005.

First, we should see the continuing expansion of the world economy – as economies in Asia and Africa continue to develop and move closer to western living standards. The growth of markets in the emerging and developing world has been a powerful driver of world economic growth in the 21st century so far, as economies around the globe have been able to access the world trading system underpinned by World Trade Organisation (WTO) rules.
Asia is at the epicentre of this emerging market growth engine, but as Figure 12 shows, Africa – starting from a much lower base but with a strongly expanding population – is also expected to grow strongly, according to the latest IMF forecasts.
By contrast, Latin America and the former Soviet Union economies are expected to experience relatively sluggish growth. We are therefore seeing a growing divide between the growth prospects of different regions in the world economy. Asia is the true powerhouse of the emerging and developing world, with Africa coming up from behind. The BRIC economies as a group – Brazil, Russia, India and China – have very different growth fundamentals and hence do not enjoy the same growth prospects.
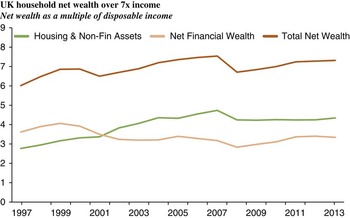
UK household wealth over 7× incomeSource: Office for National Statistics and PwC Forecasts.

Second, demographic change – an ageing population – can open up new growth opportunities. There is the potential to unlock financial reserves tied up in property and other assets – supporting the development of a new “Independence Economy”, based on accumulated wealth, new ideas and a more flexible labour market. As Figure 13 shows, despite all the concern about higher borrowing and debt levels before the financial crisis, the total net wealth of the UK personal sector is seven times disposable income – even after taking account of mortgages and other forms of borrowing. A lot of this is tied up in housing, but financial wealth is three times income, including accumulated pensions assets which can now be invested more flexibly.
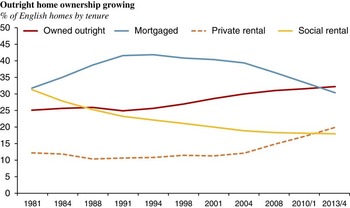
Outright home ownership growingSource: English Housing Survey.

Indeed, as we see in Figure 14 the number of households owning their own property outright now exceeds the number of households buying their property on a mortgage – probably for the first time in our modern history. This accumulation of property and pension wealth is not the only feature of the “Independence Economy”. The growth of self-employment and part-time employment also allows individuals to tailor their own careers and lifestyles more flexibly and to develop new ideas and business models based around the internet and the digital economy.
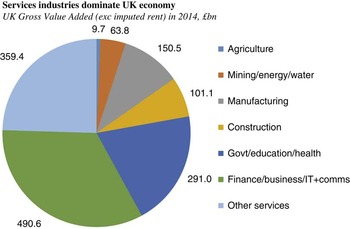
Services industries dominate UK economySource: Office for National Statistics.

Third, we could well be on the threshold of a services sector revolution. As Figure 15 shows, we are in a highly services-oriented economy in the UK, with traditional sectors – like agriculture, manufacturing, mining, energy and water, and construction – contributing less than a quarter of total value added. Structural changes in the services sector – like the sharing economy, the growth of homeworking and internet-based businesses – have the potential to create major disruptive change and challenge traditional businesses, just as we have seen successive industrial revolutions over the past 200 years.
It is of course very difficult to predict exactly how these changes will occur. However, one change which we could well see over the next decade or so is “the death of the office” – businesses moving away from traditional skyscraper office blocks and establishing more flexible business centres closer to where people live, linked up by IT and modern communications.
The fourth potential ingredient of the new growth wave is the prospect of changes in the energy sector and the way businesses and consumers respond to major environmental challenges – especially climate change. In the US, we have seen how the shale oil and gas revolution has changed the energy system, and affected the global oil market. The potential to shift to a new low carbon energy system and improve energy efficiency could open up a much bigger range of investment opportunities if economies around the world start to seriously address the challenge of climate change.
Economies which are well positioned to ride this new growth wave can do well over the next two decades, and that should include the UK – which has a flexible labour market, a business-friendly economic climate and a very diverse business base, with strengths in high-technology manufacturing and services. The UK is also a leading exporter of services among the major economies – exporting 12% of GDP in services, compared to 5%–8% for other major European economies and 4% in the United States.
Economies which are less flexible and not so well adapted to the post-crisis New Normal are likely to struggle, as we see in parts of Europe at present.
In the UK, we should not expect to return to the growth rate of nearly 3% we saw in the 25 years before the financial crisis; 2%–2.5% growth would be a more likely and sustainable outcome in the post-crisis economic environment. This would be a much better economic performance than we have seen in the early years of this economic recovery. As growth becomes better established and the financial crisis becomes more distant, we should expect interest rates to return to more normal levels.
The challenge for the new UK government and other governments in the West is to maintain business-friendly economic conditions and flexible labour market structures, which allow economies to adjust and adapt to new sources of growth. Other key pillars of sustainable growth should be:
-
∙ investment in an efficient transport system;
-
∙ making sure we have a well-educated and skilled workforce; and
-
∙ ensuring we have good access to markets around the world. That should include being a full and committed participant in the EU market on our doorstep and supporting further global trade liberalisation – particularly focussed on unlocking the potential for increased trade in services.
Finally, if we are to unlock the potential of growth from new environmental and energy technologies and systems, we need a much clearer policy framework which points us towards a low carbon economy and a more energy-efficient economy. This is not something which can be agreed or implemented at the national level or just by a group of nations like the European Union. It is a truly global challenge. In recent years, the nations of the world have struggled to establish a durable and comprehensive climate change agreement. Our ability to meet this challenge in the years ahead is one of the most significant issues in terms of achieving truly sustainable growth in the 21st century.
The Chairman: Thank you very much, Andrew. I now invite questions from the floor.
Question from a member of the audience: You have not talked much about today’s risks from asset prices and debt, which obviously worries a lot of us. You did show that net of debt, if you aggregate everything, total apparent net assets look more comforting.
Is there not an element of delusion around where the asset values could fall? Lenders think they have cash in the bank yet that cash is other people’s IOUs, and today we have pressure to acquire scarce resources such as property, so people are borrowing more and prices are rising.
Is that not either a recipe for a huge crash or huge caution on the part of thoughtful people with assets?
Dr Sentance (responding): I have argued against people who see our recent problems and the slower growth that we have been experiencing in western economies, purely in terms of debt. The financial crisis played a part. Debt has been focussed in certain sectors of the economy.
The business sector, with the exception of some parts of property and construction, did not go into the financial crisis with lots of debt. It was quite well managed financially.
There are parts of the personal sector which had accumulated quite a bit of debt; and, as a result of the financial crisis, the public sector accumulated in many countries quite a bit of debt.
It does not help to aggregate this into a big mountain, as some reports tend to do, because you have to look at the capabilities of those different sectors to manage their affairs back into a more sustainable position and the extent to which some countries are more exposed than others.
Considering the UK, the business sector is in generally quite good shape in terms of debt. In the household sector, the ratio of debt to income has gone up to over 100%. It has come down from the peaks to about 130%–140% at the moment.
The net asset position is 700%, so we have to look at those debts in relation to the assets that the private sector has.
On the government side, I am very supportive of the government’s desire to get on top of its borrowing and to stabilise its debt position, which it seems likely to do round about 80% of GDP. We have to remember that we came out of the Second World War, and the Napoleonic Wars, with 250% of GDP.
In an historical context, you have to see that in relation to where we have been in the past.
It is not the debt itself that is the problem; it is the ability of the economy to grow and service that debt, and individuals and firms have to develop real value-added activities that will then service the debt, and the public sector to be able to manage its affairs properly so it is dealing with a healthy economy.
If I look at economies that are struggling with debt at the moment (particularly Greece which is in the headlines), underlying capability of the economy to grow, is at the heart of the problem. If you are confident in the ability of your economy to grow and its supply side fundamentals, then you can service quite a high level of debt and manage it downwards over time. It is when that capability is not there that you have a problem.
So I am optimistic of what I call the better-adapted economies in the western world, in North America and in Northern Europe, parts of Eastern Europe as well, to manage their debt problems over a period of time; it is obviously not going to go away overnight. It is economies in southern Europe which do not have such strong underlying economic fundamentals that are the ones that are going to struggle most.
The Chairman: Does this mean that your view is that austerity is the wrong way to go about it? If we are looking for the economy to grow to enable the debt to be paid off, is that the other approach?
Dr Sentance: What is called “austerity” has to be part of the equation. You have to stop the problem getting worse at the same time as you are trying to make it better. Government having a grip of its public finances, particularly by controlling public expenditure, has to be part of the equation.
If you look at what has happened in the UK in the 2000s (and David Smith of the Sunday Times has written about this), public spending grew, on average, by about 4.5% in real terms. That was clearly unsustainable. We have had to manage it down closer to about 0 in real terms in order to get on top of the situation. Over two decades that is about 2% growth in real terms, which is probably sustainable for an economy like the UK.
It is a question of trying to correct past problems – what people are calling “austerity”.
If you look at government spending in total, we are not seeing government spending coming down in real terms by a significant amount. It is more being kept at a steady level, or a very small decrease in real terms. In cash terms, we are not expecting government spending to fall at all.
When people talk about austerity, maybe there are some countries like Greece where it has been more severe. In the UK, the term tends to be a bit overused. We do need control of government spending if we are going to get a more sustainable financial position as the economy grows.
Mr P. D. G. Tompkins, F.I.A.: My query is about spending on health, as you have not concentrated much on that. One of the reasons for the growth in the UK spending by the public sector in the 2000s was an increase in spending on health.
It is a pressure that western economies face right across the board, which is an inexorable demand for more spending on health, which has to be broken in some way because you cannot spend your entire economy on health.
Have you any comments to make on the propensity for health spending to take an ever-larger share of our economies because of our ability to do more and more with pushing that longevity out, which of course comes through to the ageing population?
Dr Sentance: I can see that there are going to be pressures in that direction and government needs to find some countervailing pressures if it is not going to end up with a very large bill.
One of the countervailing pressures can be better use of technology in the health service and in public services more generally, so you also encourage people to manage their own health better. You ensure that there is better information. Therefore, you are targeting your resources much more effectively at the problems that exist.
Over a period of time we are probably going to have to find that, as private individuals in various ways, those who can afford it will bear perhaps a larger share of their own health expenditure. That can be in preventative ways, making sure that you look after your own health better. We cannot push the whole problem at the government’s door and say the National Health Service will always pick up the bill.
I agree with you this is going to be a big challenge. It did appear on one of my slides, talking about reforming and restructuring public services alongside tax reform. That was a very catch-all phrase for a number of public services that have upward pressures on them. It is not just health, it is social care as well.
We are going to have to find ways of managing these and perhaps rethink and re-prioritise where we expect the government to put its resources. We have found in the UK that when government spending gets significantly over 40% of GDP, it is very hard to raise the taxes to finance that and we end up getting rather big deficits as we did in the 1970s, and we have done recently.
There seems to be some sort of natural limit in our economy, maybe it is not so evident elsewhere, which gives us a budget constraint to work within; 40% of GDP is still quite a substantial amount of money. There is a big challenge for this government and future governments to make sure that they are prioritising their spending on the things that are going to add value to consumers and businesses in the 21st century.
Mr P. G. Meins, F.I.A.: As a member of the Resource and Environment Board of the Institute and Faculty of Actuaries, I was pleased to hear the emphasis you have given to the importance of climate change in talking about these issues.
You did not say much about resources, although, one of your criteria for sustainable growth was respecting resource and environmental constraints.
As regards resources, do you not see that as a major issue over the timescale you were talking about? Is that more of a longer term issue?
Dr Sentance: We are very creative in finding new resources when existing resources run out or become depleted. In the oil industry, they have been quite creative about trying to find new sources of oil – for example, shale oil and gas.
In general, the supply curve has been upward sloping, however, in these resources that have been in relatively high demand, and there are some materials, rare earth materials, and so on, that are quite important in various industrial processes in electronic goods, and so on, where people are beginning to ring alarm bells about the lack of availability.
At the ingenuity which we apply through innovation, we will find substitutes for those things. I mentioned dealing with the problem of the hole in the ozone layer and CFCs. We have found a lot of substitutes for those. Maybe we have to change the way in which we do things. Maybe we have to change some of the products that we use to deal with resource constraints.
The process in terms of resource constraints will be more adaptive. It seems to be less apocalyptic than the way the scientists are talking about climate change, even though they are talking on a much longer time horizon.
The thing that worries me about climate change is our use of carbon-based fuels is very heavily woven into our lifestyles that we conduct; people seem to be very keen on travelling more now. Travel is predominantly fuelled by fossil fuels.
If you look around at the way we use energy, we use it quite casually. We seem to be still working with a mindset in which we see energy as a fairly freely available resource. There is perhaps a more fundamental shift that needs to take place towards energy, and carbon-based sources of energy, if we are going to seriously address this challenge of climate change, which we are beginning to at the surface; but, as I showed from the figures, at the global level we are not achieving the reductions in emissions that the scientists are talking about. They are still going up.
Mr S. Howard (UK Sustainable Investment and Finance Associate): Just following on from your last answer, the model you are outlining seems to me to be a continuance of basically the economy we have with some attention being paid to climate change on the side. It was consistently the last bullet point on your slides.
Have you any idea of where your model of the economy sits in terms of carbon emissions on the scale of scenarios which the authorities are presenting to us? My instinct is that it must be certainly not on the path we need if material climate change impacts are to be avoided; but, if anything, perhaps towards the 3/4 degree scenario.
Dr Sentance: Certainly, as my slides have showed, we have not made a lot of progress in addressing climate change. We have not really, at the global level, approached the problem very comprehensively. You do find that when there is a comprehensive attempt to deal with a big problem, it is surprising how we can harness the skills and resources of the human capability in terms of innovation, R&D, skills, etc., to address those challenges.
We have seen this most spectacularly in wartime, when suddenly we can create and produce massive amounts more than you might have thought beforehand.
We do not want to create a wartime-based economy in order to deal with climate change, but I would be hopeful that through price signals and through signals to create technological and behavioural change, we can do quite a lot more than we are doing at the moment to improve the efficiency with which we use carbon emissions.
The way I would characterise this is we have spent most of the last 200 years trying to raise labour efficiency and getting more GDP out of labour. It has been quite successful. We have produced an awful lot more than we used to do 200 years ago in terms of the level of productivity that we can achieve now.
We need to take some of that innovative capability and that technology and direct it much more towards this challenge of climate change and environmental efficiency. We do not yet have the price signals and the right frameworks that are encouraging us to do that.
In some areas, the private sector is taking the initiative, with hybrid cars and new technological developments, solar panels, etc. We are beginning to see what is possible. With stronger frameworks, clearer price signals and more investment, we can achieve quite a bit more.
Maybe there will be changes in the way in which we conduct our lifestyles. If you look at the way in which we travel, particularly work-related travel, a lot of people who are working in the services sector and IT-related jobs and business-related jobs, can do their job from a workplace which could be at their home or within five miles of their home. Those are some of the changes that we could start to embrace over 10–20 years. There may be improvements in people’s quality of life as well as environmental improvements.
We could see some quite significant changes. It is not just going to be a continuation of business as normal.
What we really need to see is a much more consistent set of signals to the private sector from policy-makers and governments; that is the direction we are clearly going to go in.
Perhaps I underplayed it by showing the figures on emissions because in the policy debate, we are inching closer to some more coherent international frameworks, but it is taking us quite a time to get there.
The Chairman: Andrew, you talked about labour markets and said that to be sustainable you need the growth to be socially inclusive. If we also need greater flexibility in the labour markets, does that not pull you in the opposite direction?
Dr Sentance: Not necessarily. You have two levers that you can deploy to try to even out incomes. One is through the tax and benefits system which is quite well developed.
The other is through interventions in labour markets, making sure that people coming out of schools and into the labour market have the right skills and the right motivation and have the right opportunities, and get work experience. That is where I would probably like to see more active policies.
If we rely exclusively on trying to redistribute the proceeds from the better off to the worst off, that is not necessarily going to deal with the issue. We need to make sure that people coming out of school and through university have the right skills and opportunity to get work experience that will equip them for the modern 21st-century labour market.
I started my career after doing a PhD on unemployment in the mid-1980s. Then the problem was that we had a big shake out of manufacturing and a lot of manual workers from manufacturing had found that they were not really equipped for the jobs that were coming up in the services sector. They were towards the end of their careers and perhaps not as attractive as some younger workers.
Over a period of 10–20 years we developed policies that addressed that issue, encouraging people to retrain and providing support for them to get back into the labour market. We need to apply those types of policies now much more at the younger end of the age spectrum to make sure that people coming through school and university have the right skills for the modern labour market.
It is easy for me to say that as a general principle. The point that I am making is we cannot rely exclusively on just recycling income from one group to another. We would probably end up with an unwieldy tax and benefits system if we relied on that. We have to intervene more in skills and education.
The Chairman: I have a question tweeted in “What qualities do you consider future leaders will need in the 21st century?”
Dr Sentance: Leaders need to be quite brave.
We had a generation of leaders who came up through the 1930s and through the Second World War, and dominated the period after that, who were quite shaped by that experience. They had some quite strong ideological views; people like Margaret Thatcher and Ronald Reagan. We need perhaps to find a new generation of leaders who have vision and bravery about the way in which we need to go into these big, new challenges.
If leaders are always going to be tacking for short-term political advantage, we are going to struggle to deal with some of the big issues that I have talked about here. Perhaps it is sometimes difficult to see where that new generation of leaders comes from.
We cannot always run our economy on the basis of the next election, or where a few extra votes are going to come from. We need to try perhaps to have a vision of where we are heading. Vision and courage are what I am looking for in leaders.
Question from a member of the audience: How much does your thesis depend on a stable geopolitical environment? You have not talked much about changing geopolitical actors and their different incentives or motivations – for example, China, the decline of the US and the insurance that it was providing to various fragile world states, the rise of India, etc.?
Dr Sentance: It is very important. I have said that there are three things that seem to drive big disruptions to the economic cycle. One was inflation; the second was big financial problems; and the third one was international conflicts of various sorts, wars, terrorist action, etc.
We are quite dependent upon there being a stable government in China, for example. We produce forecasts at PwC of what the world is going to look like in 2030 and 2050. There are going to be two very big economies according to that analysis: China and the US. It depends on your timing whether you think China is going to be bigger than the US or the US is going to be bigger than China.
By 2050 it seems likely that China, with its much bigger population, is going to be bigger than the US.
We are going to need a stable government in China. Whether that is a modification of the current government or whether that is something where we get a more fundamental shift in the political system there, is difficult to predict. That is a source of instability.
We have also seen in the Middle East repeated instability. We can live with a certain amount of that; but there have been times when it gets more disruptive.
For example, if economies that we depend on quite a lot for energy, like Saudi Arabia, were affected by turbulence in the Middle East, then that could also be a big geopolitical development.
We should be watching out for trouble signals in the geopolitical world. We also have some countervailing influences. There is a recognition that all countries depend on the modern world economy to some degree – and it is quite painful for countries to become distant and remote from the modern world economy.
It is hope that promotes an encouragement in countries to engage and to try to find peaceful and diplomatic ways of doing things rather than to try to engage in military conflict.
We have seen what has happened in Russia. Perhaps it is getting on the edge of whether that incentive is still exactly as strong as it was. Russia does not want to distance itself too far from the world economy. It needs trading partners. That is as it was for much of the 19th century, quite an important factor promoting stability and diplomatic and peaceful solutions.
Mr K. B. Donaldson, F.I.A.: Returning to your point about income disparities but taken at a global level. You said that we might be entering a 2%–2.5% growth phase for quite a long run. That is a 75% increase over 25 years in consumption, more or less, very broadly.
If the UK is to benefit from that, and if Africa and Asia are to not only to keep up but narrow the disparity, that sounds like an awful big ask for a lot of people fighting over limited growth opportunities.
It starts to sound less sustainable to me at a global level.
Dr Sentance: I made the comment that in the OECD economies since 2007, our carbon emissions have peaked. Even though they have bounced back a little bit from the financial crisis, in the most recent years, in the OECD countries they have fallen back again.
The quid pro quo of our growth being more service-orientated, more virtual, is what we count as GDP, which creates activity and interest is not as resource-hungry as the growth that some of the emerging market economies are trying to develop.
Countries in an earlier phase of development will be more resource-hungry than countries that are at a later phase of their development. If, again, we embrace a challenge like climate change more seriously, a lot of the heavy lifting needs to be done by the richer economies to give more room for growth in the poor economies.
If you talk about broader constraints on growth, there is a fallacy that people talk about, a lump of labour fallacy. There is only so much work to go round. Actually, that does not seem to apply. As the world population expands, that creates new consumption opportunities. The constraints are likely to align more closely on the resources and the environmental side rather than there being a limit to the ability of the amount of human work that can be done.
Human work creates new markets at the same time as people are working. It is dealing with this resource and environmental constraint that is going to be the real issue that bites. It is hoped that there is a growing recognition that we need to do that.
Question from a member of the audience: I have a question on the micro level in terms of your presentation. How do you see the impacts, given globalisation of the transnational corporations? For instance, in the UK a lot of companies have outsourced to China, India, etc., and generated greater profits.
The US did the same thing and they found that when the crisis came, their workers did not have some of the skills that they had more or less developed.
Your model suggests a certain path for growth and obviously for government policies; but governments do not control the transnational corporations. So how do you see the movement with the transnational corporations?
Dr Sentance: That is a very interesting area. We have seen a debate on this topic in the tax arena about companies that pay tax in different countries and are they paying the right amount of tax in the right countries? Part of the response to that was to ensure much better economic co-operation under the OECD and other organisations to get some basic ground rules to that issue.
I made a couple of comments. I could have said more about it in my presentation about the role of international co-operation. We have created a very integrated world economy, and you are alluding to that in your comments. What we do in this country affects what happens elsewhere, and what happens elsewhere affects us.
We have not created a very good regulated system to that world economy, both in terms of general economic management and the specific issues like climate change. I do see that if we are going to manage successfully the world economy that is now unfolding and emerging, we need to have better international co-operation of various sorts in the economic sphere. We are struggling to achieve that in some parts of the world economy like Europe, the euro area.
Over a period of time, I cannot see how we are going to manage our economies without getting better international co-operation. I have mentioned the WTO on a few occasions. There is a good example. We went through the global financial crisis and many people drew parallels between that period and the 1930s.
What happened in the 1930s was the world trade system fell apart. The US and other countries, and eventually the UK, started imposing trade barriers. That intensified the recession and made the whole problem much worse and made it very difficult for economies to recover.
That did not happen this time round because we had an international body that seems to be respected and its rules tend to be followed across the world. We are going to have to develop over a period of time, similar forms of institutions where international companies will respect that they have to follow certain protocols and certain ways of conducting themselves.
When I talk to business people, there is no fundamental resistance to that. However, when new rules are invented, they want to be part of the process of what the rules look like to make sure that they are sensible and business-friendly and they do not artificially constrain businesses in a perverse way.
If we can achieve that we can deal with the issue about large, multinational companies, and we are starting to see that on the tax front.
The Chairman: May I thank Andrew Sentance very much indeed on all of our behalfs for a fascinating lecture, taking those questions and being prepared to answer them all. Thank you very much indeed.