


Introduction
Between 1980 and 2016, 117 rampage school shootings took place in 40 US states.Footnote 1 More than 234 people died, most of whom were children. None of these events went unnoticed: each time, the country mourned the dead and debated intensely about gun control. Citizens voiced their outrage, politicians—depending on their views—responded with attempts to pass or prevent new regulations, and gun control became more salient and divisive (Elsass, Schildkraut, and Stafford Reference Elsass, Schildkraut and Stafford2016; Joslyn and Haider-Markel Reference Joslyn and Haider-Markel2013). Did these profound experiences alter political behavior? Specifically, did people living in areas where school shootings took place change their voting behavior? We offer a novel empirical study of the effect of school shootings on both voter turnout levels and the relative electoral support for the Democratic and Republican parties in counties where such shootings have occurred.
Extant scholarship in American and comparative politics on related topics does not provide clear theoretical expectations. Indeed, literatures on the behavioral effects of violence and the drivers of political behavior produce somewhat different expectations about whether, and how, violence may affect voters’ choices. The growing research on the effects of terrorism, civil war, and crime suggests that violence can either increase or decrease political participation. This body of work has also found that violence can influence partisan preferences in various ways, such as in favor of the incumbent or in support for more radical parties (Bateson Reference Bateson2012; Bauer et al. Reference Bauer, Blattman, Chytilová, Henrich, Miguel and Mitts2016; Córdova Reference Córdova2019; Getmansky and Zeitzoff Reference Getmansky and Zeitzoff2014; Hersh Reference Hersh2013; Hobfoll, Canetti-Nisim, and Johnson Reference Hobfoll, Canetti-Nisim and Johnson2006; Ley Reference Ley2018; Malone Reference Malone2010; Montalvo Reference Montalvo2011; Parás, Coleman, and Seligson Reference Parás, Coleman and Seligson2006; Pérez Reference Pérez2003; Robbins, Hunter, and Murray Reference Robbins, Hunter and Murray2013; Trelles and Carreras Reference Trelles and Carreras2012). However, little is known about the conditions under which violence can trigger each of these effects.
Scholarship on preference change, for its part, has mostly focused on the influence of new information that is received via mass or interpersonal communications; less is known about the effects that localized events, personally experienced by people, have on political decisions. The few studies that do focus on the effects of localized events have produced mixed findings (Hopkins Reference Hopkins2018). Studies of preference formation in the realm of gun politics often find that voters’ outlooks are resistant to new developments (Hassell, Holbein, and Baldwin Reference Hassell, Holbein and Baldwin2020; Jang Reference Jang2019; Kantack and Paschall Reference Kantack and Paschall2020; Rogowski and Tucker Reference Rogowski and Tucker2019). Numerous studies also show that motivated reasoning is widespread when it comes to highly contested, partisan political issues, such as gun control (Bolsen, Druckman, and Cook Reference Bolsen, Druckman and Cook2013; Leeper and Slothuus Reference Leeper and Slothuus2014; Taber and Lodge Reference Taber and Lodge2006). Moreover, other research shows that increased partisan polarization causes political attitudes to be less responsive to new information (Druckman, Peterson, and Slothuus Reference Druckman, Peterson and Slothuus2013). Consistent with this literature, a recent study of the effects of all types of school shootings—including rampage school shootings as well as those related to gang conflicts and interpersonal fights—finds that these events do not affect participation in elections or the relative electoral support received by each party (Hassell, Holbein, and Baldwin Reference Hassell, Holbein and Baldwin2020). Nonetheless, other studies find that, under the right conditions, some individuals’ views on gun control can shift as a result of gun violence (Haider-Markel and Joslyn Reference Haider-Markel and Joslyn2001; Joslyn and Haider-Markel Reference Joslyn and Haider-Markel2018; Pearson-Merkowitz and Dyck Reference Pearson-Merkowitz and Dyck2017).
At the same time, the literature on the effect of catastrophic events and “anxious politics” on political behavior suggests that events that are threatening often lead to strong emotional reactions that can “free” people from their partisan bias as they become more engaged, look for more information, and seek policies that are protective (Albertson and Gadarian Reference Albertson and Gadarian2015; Atkeson and Maestas Reference Atkeson and Maestas2012). Events that trigger strong emotions, like rampage school shootings, can therefore engage the public in ways that are unthinkable during ordinary times, leading to changes in political behavior such as deciding whether or not to vote in a particular election, and for whom. These findings align with studies indicating that voters sometimes hold politicians accountable for negative developments—such as increased crime rates or a weaker economy—that occur in society.Footnote 2
In sum, the literature on the behavioral effects of violence suggests that school shootings should have electoral effects—although which particular effects is unclear. The political science literature on preference change, on the other hand, suggests that school shootings are unlikely to affect political preferences and, if they do, the expected direction of the effect is unclear. And finally, studies on the effects of catastrophic events on political behavior suggest that such events can both increase political participation and alter electoral outcomes.
These contradictory theoretical expectations reveal just how much we still do not understand about the effects of violence on political behavior more generally—both in the US and elsewhere. As Ley (Reference Ley2018, 1964) notes, “violence still remains an unexplored contextual variable for understanding the various forms and aspects of political behavior.” This is a serious gap: violence is part of societal life, and one of the core functions of the state is precisely to offer protection—this is, indeed, one of the pillars of the social contract. Yet, we are only beginning to understand how different types of violence affect political attitudes and choices.
Investigating the political effects of school shootings in the US is important for three reasons. First, this is a particularly sensitive form of violence because it is intentional, designed to harm as many people as possible, and affects mostly children (Elsass, Schildkraut, and Stafford Reference Elsass, Schildkraut and Stafford2016). In addition, school shootings receive widespread media attention and are sensationalized in ways that make them seem misleadingly common (Elsass, Schlidkraut, and Stafford Reference Elsass, Schlidkraut and Stafford2014; Schildkraut and Elsass Reference Schildkraut and Elsass2016; Silva and Capellan Reference Silva and Capellan2018). As a result, these shootings often incite widespread fear, creating a “moral panic”—that is, a situation that “can shape public opinion and drive policy change on a host of issues, including gun control, mental health, and violent media” (Schildkraut and Elsass, Reference Schildkraut and Elsass2016, 2). The intense debates on gun control that follow after every school shooting—especially since the 1999 Columbine shooting—make it a consistently divisive and salient political issue on which the two main political parties have increasingly taken opposite views (Karol Reference Karol2009; Silva and Capellan Reference Silva and Capellan2018). Given the many social effects of school shootings, it is important to investigate their political implications. This paper investigates their effects on electoral outcomes.
Second, beyond the inherent importance of this topic, it is also useful for learning more about how politically relevant events—personally experienced by people—affect political behavior and democratic accountability in the US, especially in the context of partisan polarization. Although political science research has advanced our understanding of how political preferences change due to external influences, most of this work focuses on persuasion and strategic communication (Druckman and Lupia Reference Druckman and Lupia2000).Footnote 3 We know less about how actual events—like school shootings—affect individuals’ political preferences, especially when they are relevant to issues that are polarized along partisan lines (which, as noted above, may make attitudes more resistant to change). Despite this gap, the work that has been done on the topic provides reason to believe that shocking events—especially politicized tragedies—can catalyze policy changes by influencing political behavior (Atkeson and Maestas Reference Atkeson and Maestas2012; Hersh Reference Hersh2013). Understanding the behavioral effects of school shootings can therefore shed light on how politicized tragedies can shape policy change.
Third, the as-if-random nature of school shootings makes them analytically useful for tracing the effects of social violence on political behavior. There is no indication that the timing of a school shooting in a given county is systematic or correlated with variation in common predictors of electoral behavior.Footnote 4 This allows us to treat them as natural experiments and to identify their causal effect on voting outcomes. This is important because most studies that have identified the causal effects of violence on political behavior focus on political violence, tracing the effects of what are believed to be random acts, such as terrorist attacks or bombings. Yet, it is possible that different types of violence—for example crime and terrorism—affect behavior in distinct ways. If that is the case, learning about the behavioral effects of one type of violence would not necessarily tell us how other forms of violence influence decision making.
By investigating rampage school shootings, we focus on the effects of a form of violence that can be classified as social as opposed to political or criminal.Footnote 5 This is not only a feature of the definition of rampage school shootings that we rely on—which explicitly excludes incidents related to criminal or political activities—but also a pattern that most research on school shootings in the US has identified. Although it is impossible to know the motivation of the perpetrators of these shootings, research on the US overwhelmingly suggests that these attacks are rarely politically motivated. As Muschert (Reference Muschert2007, 63) states in their review of research on school shootings, “Frequently, the motivations for rampage shootings are to attain power or to exact revenge on the community or large groups within the community, and the rampage shooter has also been labeled in the literature as the classroom avenger.”Footnote 6 To be sure, there are cases of school shootings that are politically motivated, such as acts of terrorism—although we could not find even one instance in the US—and government shootings on school grounds—for example, the 1968 shootings at South Carolina State University. However, most school shootings in the US are not associated with a particular ideology or political goal. Rather, most research points to individual and social dynamics including mental illness, peer relationships, family relationships, student–faculty relationships, community cohesion, and macro-level cultural factors such as a culture of violence and masculine roles (Muschert Reference Muschert2007). Moreover, none of the seminal studies of rampage school shootings mentions a political motive or a political factor as a cause of these events, except the fact that the percentage of events has been higher in Republican states than in Democratic ones, as well as in less populated areas, which are usually more conservative (Kimmel Reference Kimmel, Agger and Luke2008; Kimmel and Mahler Reference Kimmel and Mahler2003; Madfis Reference Madfis2014; Reference Madfis2017; Muschert Reference Muschert2007; Newman and Fox Reference Newman and Fox2009).Footnote 7 In addition, although there have been cases of gang-related killings on school grounds, the definition of rampage school shootings we rely on explicitly excludes them, as does our dataset. Rampage school shootings are, therefore, acts of social violence rather than political or criminal violence. This is, to our knowledge, the first study that can identify the effects of nonpolitical violence on political behavior; as such, it provides insights that may be crucial to subsequent efforts to build theories about the political consequences of violence.
Our research design allows us to identify the effects of school shootings on electoral outcomes at the county level in US presidential elections. We find that these events do not affect voter turnout. They do, however, increase the vote share of the Democratic Party in the subsequent election by an average of nearly 5 percentage points within affected counties. We consider different heterogeneous effects and find that school shootings have a larger influence on party vote share in recent elections, a trend that may reflect increasing partisan division on gun control over time; as the parties have become more differentiated (and thus easier for voters to distinguish between) on the issue, the effects of school shootings on partisan vote share have increased. We also find that the effect is higher in states that lack strict gun laws, which could signal that voters are punishing the Republican Party—which is much less supportive of gun control than the Democratic Party—for inaction in states where such laws have not been passed. Overall, the effects we identify represent a remarkable shift in an age of partisan polarization and close presidential elections and are especially notable given the numerous competing factors that go into an individual’s decision about who should hold the country’s highest office. Our results hold even when we estimate the models accounting for counties with competitive elections and using only data for swing states, and they are robust to multiple model specifications.
School Shootings and the Political Effects of Exposure to Violence
There is no consensus on the definition of terms like mass shooting, school shooting, and rampage school shooting. Some definitions are quite broad, including all events involving a shooter in a public space (or school, in the case of school shootings); others specify certain conditions to differentiate these incidents from other types of violent events. Experts who adopt a more demanding definition usually emphasize three attributes: First is the indiscriminate selection of at least some of the victims, which rules out cases of targeted violence such as domestic violence and personal vendettas linked to either criminal activities or personal grievances (Bjelopera et al. Reference Bjelopera, Bagalman, Caldwell, Finklea and McCallion2013; Newman et al. Reference Newman, Fox, Harding, Mehta and Roth2004; Schildkraut and Elsass Reference Schildkraut and Elsass2016). The term “rampage” is often used to denote the expressive and symbolic aspect of the attack (Muschert Reference Muschert2007). Second is the absence of political or criminal motives in order to distinguish these shootings from acts of terrorism as well as violence motivated by criminal profit (Bjelopera et al. Reference Bjelopera, Bagalman, Caldwell, Finklea and McCallion2013; Schildkraut and Elsass Reference Schildkraut and Elsass2016). And third is the occurrence of the event in a relatively public place (Bjelopera et al. Reference Bjelopera, Bagalman, Caldwell, Finklea and McCallion2013; Newman et al. Reference Newman, Fox, Harding, Mehta and Roth2004; Schildkraut and Elsass Reference Schildkraut and Elsass2016). These factors are important because one of the reasons that school shootings—and other public shootings—receive so much attention and are so traumatic is the general perception that the victims were innocent people who just happened to be at work, school, or a mall and were attacked for no apparent reason (Muschert Reference Muschert2007; Schildkraut and Elsass Reference Schildkraut and Elsass2016). In addition, school shootings require the association of the perpetrator with the school in order to exclude violent acts perpetrated on school grounds but unrelated to the school community (Newman et al. Reference Newman, Fox, Harding, Mehta and Roth2004). Therefore, we use the term rampage school shootings to emphasize the indiscriminate nature of these attacks and define them as those shootings that “take place on a school-related public stage before an audience; involve multiple [not necessarily fatal] victims, some of whom are shot simply for their symbolic significance or at random; involve one or more shooters who are students or former students of the school” (Newman et al. Reference Newman, Fox, Harding, Mehta and Roth2004, 50); and where “the motivation of the shooting [does not] correlate with gang violence or targeted militant or terroristic activity” (Schildkraut and Elsass Reference Schildkraut and Elsass2016, 28). A mass school shooting is a rampage school shooting involving more than two fatalities.
Should we expect school shootings to have important downstream political effects, particularly on individual behavior and electoral outcomes? Existing studies—coming from different subfields of political science and economics—support different hypotheses. On the one hand, the burgeoning literature on the effects of violence on political behavior suggests that it can influence political participation as well as individuals’ political preferences. These effects have been found among direct victims of violence as well as those living near the location of a violent event. A recent meta-analysis of research on the effects of civil war violence on postwar social and political behavior, for example, reviews multiple studies that find that victims are more likely to show up to vote than nonvictims (Bauer et al. Reference Bauer, Blattman, Chytilová, Henrich, Miguel and Mitts2016). In the US, a study of the effects of the September 11 attacks found that victims’ families and neighbors tended to participate more in elections and that the effect is quite persistent over time (Hersh Reference Hersh2013). A detailed analysis of survey data on 70 countries across continents also shows that victims of crime are more likely to participate in elections than nonvictims (Bateson Reference Bateson2012). A few studies, however, find that both political and criminal violence suppress voting in other contexts (Acemoglu, Robinson, and Santos Reference Acemoglu, Robinson and Santos2013; Córdova Reference Córdova2019; Gallego Reference Gallego2018; García-Sánchez Reference García-Sánchez2010; Ley Reference Ley2018; Trelles and Carreras Reference Trelles and Carreras2012). A recent study on the effects of school shootings in the US—including those related to gang activity, suicides, and interpersonal violence—finds that these events do not increase participation in elections (Hassell, Holbein, and Baldwin Reference Hassell, Holbein and Baldwin2020). We elaborate on this last paper’s approach and findings later in the paper.
Research has also found that violence affects people’s decisions about who to vote for. Several studies of terrorism find that party support changed as a consequence of political violence. The September 11 attacks, for example, increased support for the Republican Party among victims’ families and neighbors (Hersh Reference Hersh2013). On the other hand, the 2011 Madrid train bombings, were found to decrease support for the conservative, incumbent party in Spain (Bali Reference Bali2007; Montalvo Reference Montalvo2011) and the threat of rockets in Israel increased support for right-wing politicians (Getmansky and Zeitzoff Reference Getmansky and Zeitzoff2014). Spikes in crime have also been found to increase support for more radical parties that embrace iron-fist policies to curb insecurity (Bateson Reference Bateson2012; Malone Reference Malone2010; Parás, Coleman, and Seligson Reference Parás, Coleman and Seligson2006; Pérez Reference Pérez2003). In these and other studies, the mechanism connecting violence to political behavior is individuals’ perceptions of which party is better at providing protection from threats, with the party perceived as more protective receiving increased support. These findings are consistent with those of several other studies showing that exposure to political violence triggers feelings of vulnerability and threat, which in turn lead to attitudes emphasizing self-protection (Hirsch-Hoefler et al. Reference Hirsch-Hoefler, Canetti, Rapaport and Hobfoll2016; Hobfoll, Canetti-Nisim, and Johnson Reference Hobfoll, Canetti-Nisim and Johnson2006).
Therefore, this body of literature suggests that school shootings should affect turnout—although whether such an effect should be positive or negative is unclear—as well as the relative electoral support of the Democratic and Republican parties among individuals who believe that one party is more likely than the other to protect their communities from future shootings. However, in the case of school shootings, it is difficult to develop a clear expectation of which party is most likely to be perceived as the one offering more protection; which party has “issue ownership” here, in other words, is unclear (Petrocik Reference Petrocik1996). For the Democratic Party, the narrative takes the form of imposing barriers to gun ownership—making it harder for potential shooters to obtain weapons. For the Republican Party, the narrative focuses on using more guns for protection, suggesting that gun control is not a useful solution to school shootings. These conflicting narratives further complicate the link between partisan support and protection.
In sum, most prior studies of the behavioral effects of political and criminal violence find that violence does affect political behavior—but what those effects are remains unclear. The only study on the effects of school shootings finds that neither turnout nor party support change as a result of a school shooting, including instances of both rampage and selective killings. Therefore, existing research fails to provide clear theoretical expectations about the effects of rampage school shootings on voters’ decisions.
Extant scholarship on public opinion about highly partisan issues suggests that policy preferences and voting decisions can be resistant to change. Partisan identification is a very stable individual-level characteristic that rarely changes over the course of an individual’s life, even in response to important political events and broad sociopolitical change. Moreover, aggregate partisanship in the US—often referred to as macropartisanship (MacKuen, Erikson, and Stimson Reference MacKuen, Erikson and Stimson1989)—is also stable over time, with the relative proportion of Americans who identify as Democrats and Republicans changing only slowly (Green, Palmquist, and Schickler Reference Green, Palmquist and Schickler2004). Beyond its stability over time, partisan identification is also a very strong driver of how individuals vote, choose issue stances, and process new information and events (Bartels Reference Bartels2000; Bolsen, Druckman, and Cook Reference Bolsen, Druckman and Cook2013; Druckman, Peterson, and Slothuus Reference Druckman, Peterson and Slothuus2013; Green, Palmquist, and Schickler Reference Green, Palmquist and Schickler2004; Jacobson Reference Jacobson2015). As a result of both the stability of partisan identification and its influence on political behavior, it is unusual for political events to have large effects on the relative vote share of each political party—a reality reflected in the consistently close results of national elections in the US in recent years. This resistance to change may be particularly likely when prominent events are closely related to partisan issues, which include gun control (Karol Reference Karol2009); individuals instead tend to engage in motivated reasoning, processing new information in ways that align with their existing attitudes (Druckman, Peterson, and Slothuus Reference Druckman, Peterson and Slothuus2013; Joslyn and Haider-Markel Reference Joslyn and Haider-Markel2013).
Within the realm of the studies focused explicitly on mass shootings (and gun violence more broadly), findings are mixed: some studies align with what we would expect based on the literature on the behavioral effects of violence, but others align with what we would expect based on the preference change literature. Consistent with the former, scholars have found that support for gun control following mass shootings is higher among individuals who feel anxious as a result of such shootings (Joslyn and Haider-Markel Reference Joslyn and Haider-Markel2018), that pro-gun-control frames may be more effective following mass shootings (at least for some individuals; Haider-Markel and Joslyn Reference Haider-Markel and Joslyn2001), and that, on average, support for gun control is greater in high-crime areas than in low-crime areas (which suggests that proximity to violent events is relevant to individuals’ views on gun control; Pearson-Merkowitz and Dyck Reference Pearson-Merkowitz and Dyck2017). Consistent with the latter, however, other studies of mass shootings’ influence on gun control attitudes have found that they do not significantly alter individuals’ gun policy preferences, broader political behavior, or responsiveness to pro- and antigun frames; rather, individuals engage in motivated reasoning in response to mass shootings, rationalizing their existing gun control attitudes, which are often tied to their party identification (Hassell, Holbein, and Baldwin Reference Hassell, Holbein and Baldwin2020; Jang Reference Jang2019; Kantack and Paschall Reference Kantack and Paschall2020; Rogowski and Tucker Reference Rogowski and Tucker2019). Based on this literature, we should not expect school shootings to influence voters’ partisan support.
To be sure, most existing studies of preference change have focused on the effects of new information that individuals receive through mass or interpersonal communications, with much less attention devoted to the localized effects of prominent events like mass shootings. Existing studies on the effects of events—which do sometimes find that they affect political behavior—have often focused on “politically irrelevant” events, including shark attacks (Achen and Bartels Reference Achen and Bartels2012; Fowler and Hall Reference Fowler and Hall2018) and sporting events (Busby and Druckman Reference Busby and Druckman2018; Busby, Druckman, and Fredendall Reference Busby, Druckman and Fredendall2017; Healy, Malhotra, and Mo Reference Healy, Malhotra and Mo2010). Only a few studies have focused on the effects of “relevant” events, such as natural disasters, climate change, and crime (Healy and Malhotra Reference Healy and Malhotra2009; Hopkins Reference Hopkins2018; Malhotra Reference Malhotra2008; Malhotra and Kuo Reference Malhotra and Kuo2008; Velez and Martin Reference Velez and Martin2013). Of particular importance are studies on the effects of catastrophic events, such as hurricanes, pandemics, and terrorist attacks (Albertson and Gadarian Reference Albertson and Gadarian2015; Atkeson and Maestas Reference Atkeson and Maestas2012). The studies that focused on more explicitly political phenomena have produced mixed findings, with some localized issues producing statistically significant effects and others not; in general, events that receive widespread media attention, are associated with feelings of threat, and that facilitate blame attribution are most likely to produce such effects (Hopkins Reference Hopkins2018)—and even lead to unprecedented policy changes (Atkeson and Maestas Reference Atkeson and Maestas2012). In light of these findings, we might expect school shootings—which generate substantial media coverage and trigger a sense of threat—to have localized effects. However, prior studies on the localized effects of mass shootings have produced inconclusive results: one study finds that individuals who live near such events become more supportive of gun control (Newman and Hartman Reference Newman and Hartman2017), but another finds that these effects disappear when an improved geocoding scheme is used (Barney and Schaffner Reference Barney and Schaffner2019). The only study to date that has investigated whether school shootings influence electoral outcomes finds that they do not (Hassell, Holbein, and Baldwin Reference Hassell, Holbein and Baldwin2020). The dataset used in this study, however, includes many nonrampage school shootings (e.g., suicides, gang violence on school grounds, and fights that escalated); these events—which actually outnumber rampage school shootings—are nonrandom, which makes them less useful statistically and also less likely, theoretically, to produce the sorts of feelings that may cause individuals to change their political behavior. Our dataset, by excluding these events, is better equipped to identify the effects of rampage-style shootings at schools.
Finally—and across studies of both politically relevant and irrelevant events (as well as those more broadly focused on retrospective voting and accountability)—when electoral outcomes in American politics are the dependent variable of interest, the focus has been on how such events influence support for incumbents (Achen and Bartels Reference Achen and Bartels2012; Andrew and Malhotra Reference Andrew and Malhotra2013; Fowler and Hall Reference Fowler and Hall2018; Gailmard and Patty Reference Gailmard and Patty2019; Healy, Malhotra, and Mo Reference Healy, Malhotra and Mo2010; Karol and Miguel Reference Karol and Miguel2007). Therefore, little is known about whether particular political parties are rewarded or punished based not on incumbency but instead on their policy stances as they relate to issues that are relevant to localized events. Under polarized conditions—in which competing parties have taken clearly divergent stances on issues that are relevant to localized events—changes in electoral outcomes may not reflect incumbency but instead issue stances. Along these lines, if people living near the location of a school shooting do become more supportive of gun control—or if gun control becomes more salient among individuals who already supported it—they might also become more likely to vote for the Democratic Party. If this is the case, the effect should be stronger in recent elections, as the parties have become increasingly polarized on gun control and as school shootings have become more common (Karol Reference Karol2009). In fact, we expect that there may be no effect until relatively recent periods in which polarization on gun control has spread to the mass level (Bacon Reference Bacon2019; Joslyn et al. Reference Joslyn, Haider-Markel, Baggs and Bilbo2017); after all, voters must recognize differences between the parties on an issue in order to punish or reward them for their stances on it. If so, this would suggest that, although polarization makes individuals less responsive to new information that they receive through the media or interpersonal communication, it can also make it easier for voters who personally experience salient events to change their voting behavior in response. In other words, polarization may have opposite effects among those who hear about events that occurred elsewhere and among those who personally experience such events.
Taken together, prior studies—on the effects of political and criminal violence, as well as preference change in light of new information and events in American politics (including mass shootings)—lead to different expectations about the effects of school shootings. Based on most of the literature on political violence, we would expect school shootings to increase turnout, whereas most studies of criminal violence would predict a suppression of turnout and the literature on public opinion would predict no change; indeed, even studies of locally experienced phenomena that identify significant shifts in electoral support for incumbents generally do not observe changes in turnout (Healy, Malhotra, and Mo Reference Healy, Malhotra and Mo2010; Karol Reference Karol2009). Likewise, although studies of political and criminal violence would predict greater support for the party that offers greater protection in the wake of school shootings, studies on public opinion and voting behavior lead to conflicting expectations.
We approach these ongoing debates empirically. By investigating whether voter turnout and support for the Democratic and Republican parties change as a result of a school shooting, this paper contributes to both our understanding of the political effects of exposure to traumatic, violent events and, more broadly, the ways in which voters respond to such events. In particular, our focus on electoral outcomes—as opposed to public opinion about gun control—is of tremendous importance because it addresses whether votes are won or lost as a result of the parties’ stances on the issue. Indeed, previous studies indicate that politicians tend to respond to the preferences of the minority of Americans who oppose firearms regulations because such individuals feel much more strongly about—and thus are much more likely to vote on the basis of—gun control than the majority of Americans who support stricter laws (Bishin Reference Bishin2009); if it turns out that school shootings depress support for pro-gun politicians, their calculations might change. Further, our focus on shifts in support for each party—rather than for incumbents—sheds light on the extent to which both polarization and issue stances affect voters’ reactions to events. Finally, our study has the potential to begin bridging the gap between the numerous studies, discussed above, that currently lead to different conclusions by highlighting certain conditions under which political outcomes change as a result of violent events.
Research Design and Data
Our research design treats school shootings as natural experiments. That is, we assume that the timing of a school shooting in a particular county is as-if random. Using the language of the potential outcomes framework, the conditional unconfounded treatment assumption likely holds at the county-period level. That is, the probability of a shooting occurring in a given county and in a given period is independent of potential outcomes (in this case, electoral outcomes).Footnote 8 This assumption allows us to estimate the effects of school shootings on electoral behavior by comparing counties where a shooting occurred with counties in which no shootings took place, conditional on a series of county-level characteristics and temporal effects. Our design expands a traditional two-period difference-in-differences approach to cover several periods.Footnote 9 In turn, the conditional parallel trends assumption (for each period) is critical for our identification strategy. We assume that in the absence of the shooting, and conditional on covariates, counties that experienced a shooting and counties that did not would have followed parallel paths with respect to their electoral outcomes.
This assumption is supported by the fact that most predictors of rampage school shootings identified in the literature pertain to individual-level attributes of the shooters themselves (as opposed to the locations of the shootings). Moreover, those attributes do not seem to be associated with characteristics of the counties in which they occur (Madfis Reference Madfis2017; Paolini Reference Paolini2015; Wike and Fraser Reference Wike and Fraser2009). In addition, we control for the few county-level demographic factors that, according to existing research, tend to characterize (but have not been shown to statistically predict) the communities where school shootings have taken place (Kimmel and Mahler Reference Kimmel and Mahler2003; Madfis Reference Madfis2017). Additional tests of our main assumptions can be found later in the paper.
To estimate the causal effects of rampage school shootings, we created a dataset of these events with several details on each attack, including its geographical location. We started with a list of rampage school shootings that occurred in the US between 1980 and 2016, which was compiled by Wikipedia.Footnote 10 We then refined this list by locating newspaper articles for each of the shootings, coding several details of each attack, and keeping only those that can be classified as rampage shootings and that took place in K to 12 institutions, colleges, or universities.Footnote 11 We also compiled a county-level panel dataset with the electoral outcomes of presidential elections as well demographic characteristics from 1980 to 2016.Footnote 12 Containing several decades of county-level data on elections, shootings, and demographic patterns, this dataset enables us to produce robust estimates of the influence of school shootings on electoral outcomes. We leverage the variation across time and space using county fixed effects and time effects as the basis of our analysis.
In addition to being available throughout our period of study, county-level data are useful for our purposes because they generally capture the geographic zone in which we might expect shootings to have effects; counties—unlike lower- or higher-level units of analysis—tend to be large enough to capture the geographic range in which school shootings might have local effects but not so large as to contain many voters who would likely not be “treated” by a shooting. Moreover, any spillover effects from treated counties that are geographically small into nearby counties would bias our effect sizes toward zero, as we would be including counties that experienced the treatment in our control group. Similarly, the existence of counties that experienced shootings but that are geographically large enough to potentially contain areas that were not in fact “treated” by such shootings (because they are too far from where the shooting took place) would also bias our effect sizes toward zero. In other words, the heterogeneity of county sizes does not affect the robustness of our findings; indeed, potential issues related to both large counties and small counties would have the same effect—reducing differences between the treatment and control groups. This county-level approach follows most other studies focused on the political effects of locally experienced phenomena, including federal grant spending, the outcomes of sporting events, the occurrence of shark attacks, and preelection hurricanes (Achen and Bartels Reference Achen and Bartels2012; Fowler and Hall Reference Fowler and Hall2018; Healy and Malhotra Reference Healy and Malhotra2009; Kriner and Reeves Reference Kriner and Reeves2012; Reference Kriner and Reeves2015; Velez and Martin Reference Velez and Martin2013). Finally, counties are particularly appropriate units of analysis in our study given that school districts are organized based on county boundaries in many parts of the US. Nonetheless, we also estimated alternative models as robustness checks to address whether our findings depend on the use of county-level outcomes; these enable us to examine whether there are spillover effects to nearby counties and the influence of any such effects on our findings, as well as whether our results hold when using a different unit of analysis. They are discussed below.
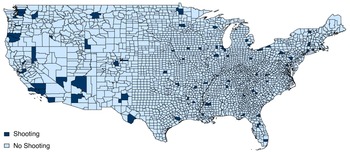
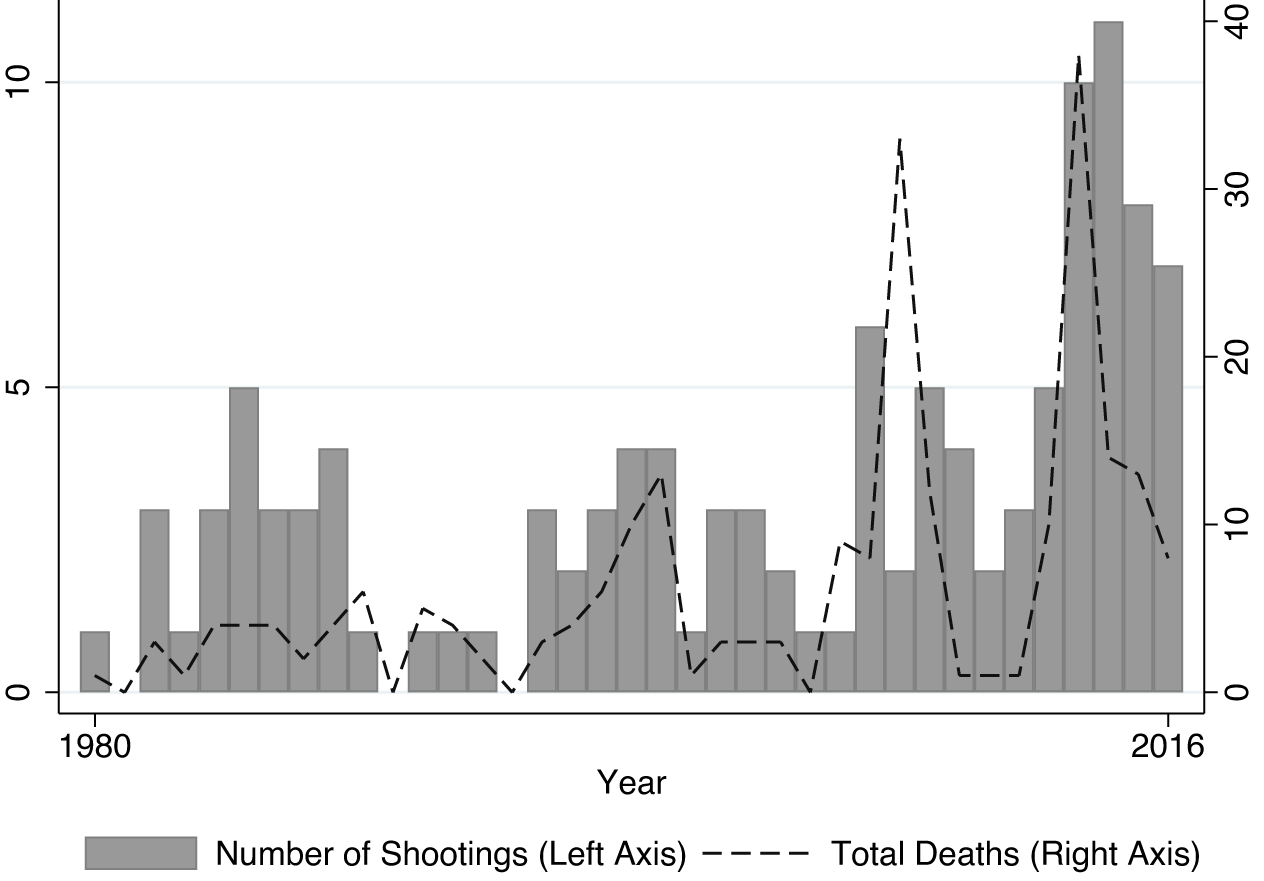
The dataset contains all school shootings during our years of study, with dummy variables indicating whether a school shooting occurred in each county in the years between presidential elections. The spatial distribution of the shootings—depicted in Figure 1—indicates that shootings occur all across the US. There were, on average, 3.2 school shootings per year, with a notable increase since 2011 (see Figure 2). Sixty five percent of the shootings resulted in fatalities and, on average, shootings that were fatal resulted in 3.05 deaths. The number of yearly fatalities has also increased since 2011. Additional descriptive statistics are contained in the appendix (see Tables A.1 and A.2 in appendix A.1.)
Spatial Distribution of School Shootings, 1980–2016
Note: The map shows the spatial distribution of school shootings in US counties between 1980 and 2016. Dark blue signifies there was at least one school shooting in that county and light blue indicates no shooting.

Number of Shootings and Fatalities over Time
Note: The figure shows the number of shootings (left axis) and the total number of deaths (right axis) for each year between 1980 and 2016.

The dataset also contains county-level outcomes—pertaining to both voter turnout and party vote share—of all presidential elections during our period of study. Although we do not have data on congressional or state-level elections, our presidential election indicators represent a strong proxy for other types of elections given that voters overwhelmingly support candidates from the same party as their preferred presidential candidate (Bump Reference Bump2016; Jacobson Reference Jacobson2015). Thus, it is likely that similar trends exist in lower-level races. Furthermore, the conversation around gun control often takes on national importance.
To identify the causal effect of school shootings on turnout and partisan vote share, we estimate the following equations:
 $$ \begin{array}{c}\hskip-15.5pc Turnout\left(i,t\right)=\\ {}{\beta}_0+{\beta}_1{Shooting}_{i,t}+\sum \limits_k{\delta}_{k,i,t}{Controls}_{k,i,t}+{\lambda}_t+{\omega}_i+{\varepsilon}_{i,t}\end{array} $$
and
 $$ \begin{array}{c}\hskip-14pc {DemVoteShare}_{\left(i,t\right)}=\\ {}{\beta}_0+{\beta}_1{Shooting}_{i,t}+\sum \limits_k{\delta}_{k,i,t}{Controls}_{k,i,t}+{\lambda}_t+{\omega}_i+{\varepsilon}_{i,t}.\end{array} $$
Turnout and Democratic vote share are our dependent variables of interest.
 $ {Shooting}_{i,t} $
is a dummy variable taking the value of 1 if a school shooting happened in county i between presidential elections. To account for potential omitted-variable bias, we include county fixed effects, which account for unmeasured, time-invariant attributes of counties that might explain differences in electoral outcomes, such as level of rurality. We also include time fixed effects, which account for national-level trends that could influence partisan vote share and turnout. Finally, we include as controls measures of three demographic characteristics of counties that could explain variation in electoral outcomes: total population, change in the unemployment rate, and the proportion of the population in each county-year classified by the census bureau as nonwhite.Footnote
13
The coefficient
 $ {\hat{\beta}}_1 $
is the estimate of the average causal effect of school shootings on turnout and partisan vote share conditional on county fixed effects, time effects, and a set of controls. We assume that, conditional on the previously mentioned controls, the probability of a school shooting happening in a particular county at a particular time is independent of partisan vote share and turnout in that county. We then estimate the effect of the independent variable of interest—school shootings—by comparing electoral outcomes in counties where a school shooting occurred with those in counties where no such shooting occurred. We also explore several heterogeneous treatment effects.Footnote
14
Results
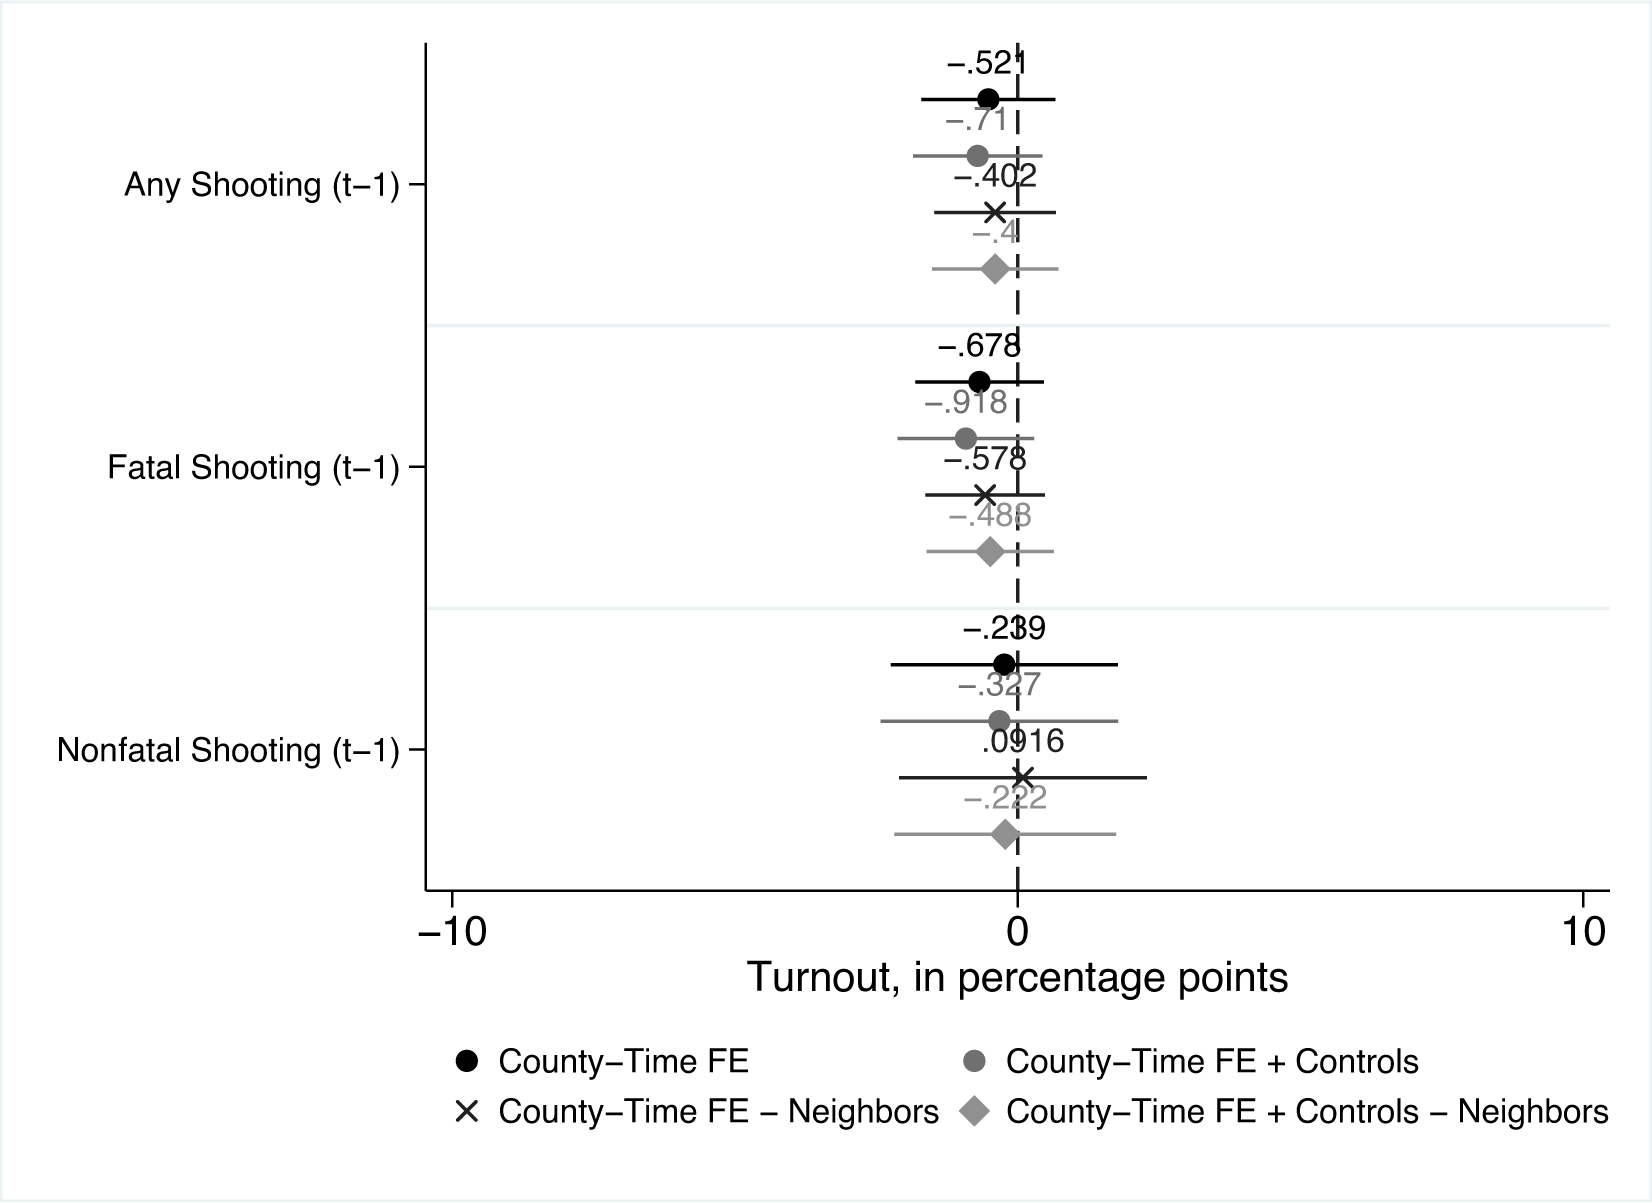
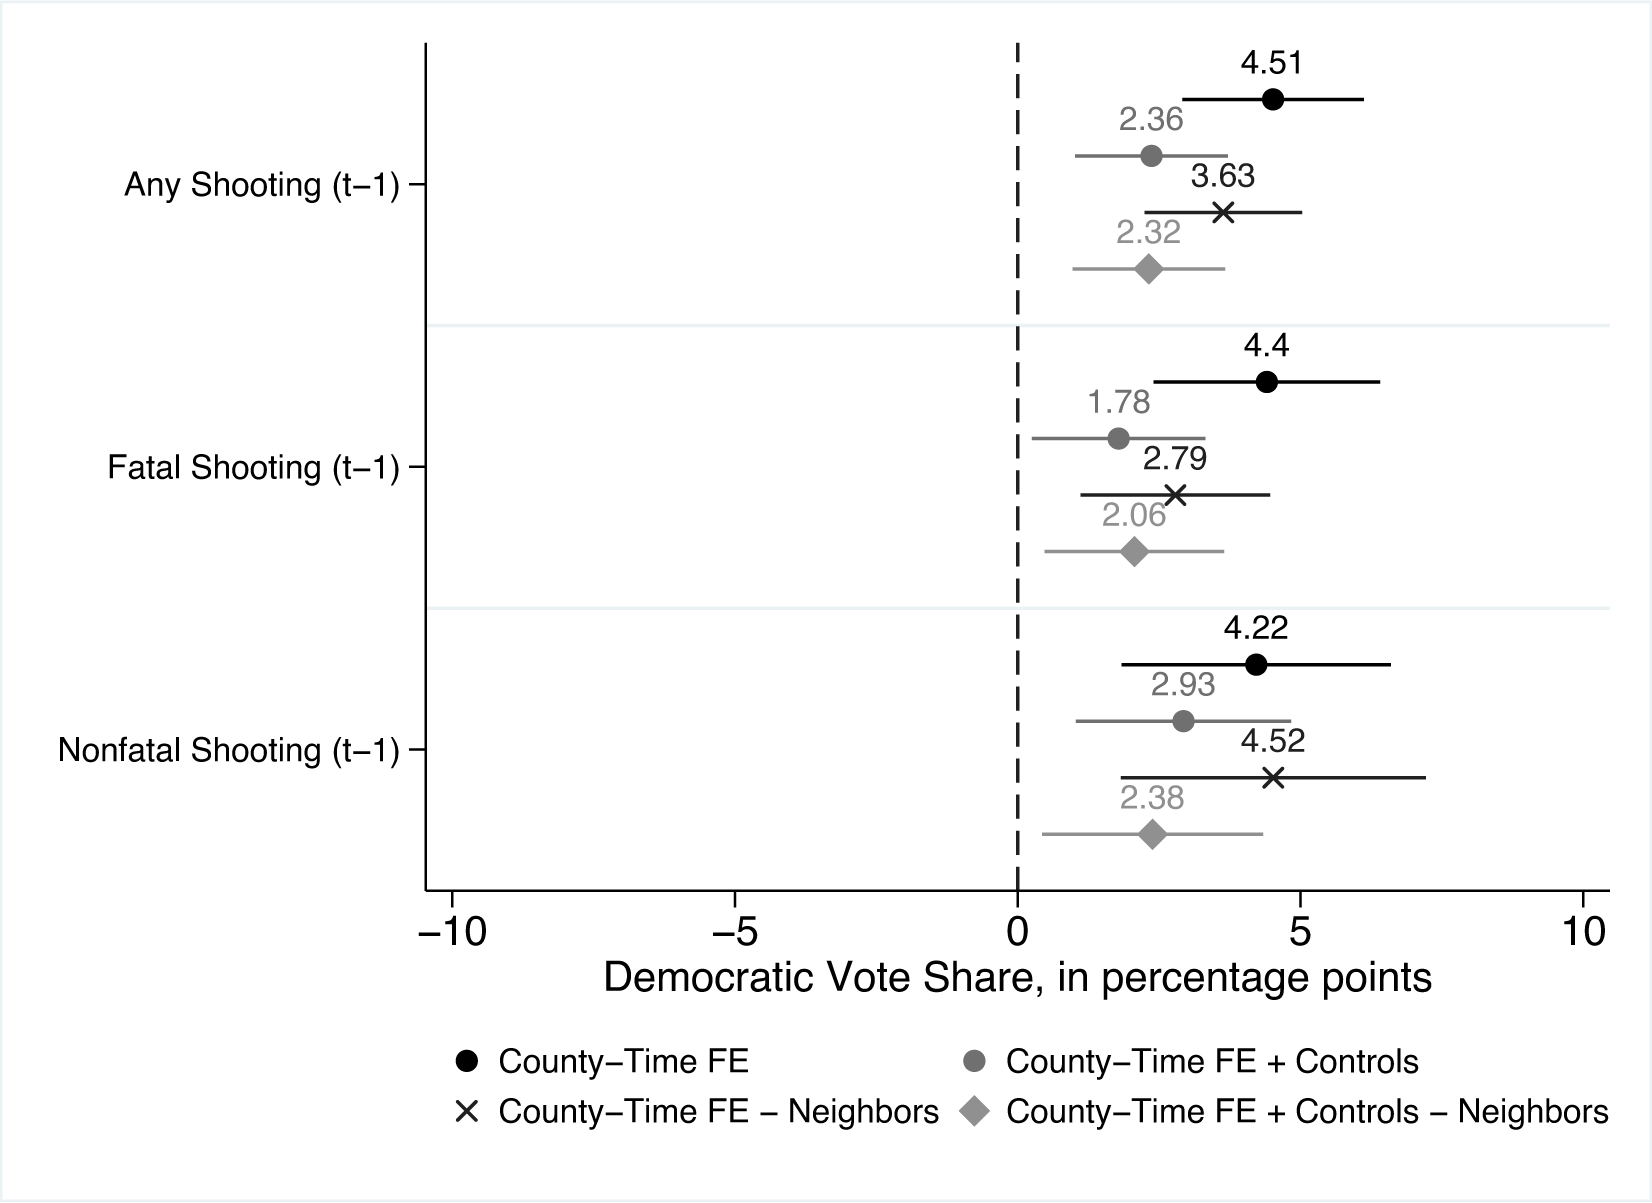
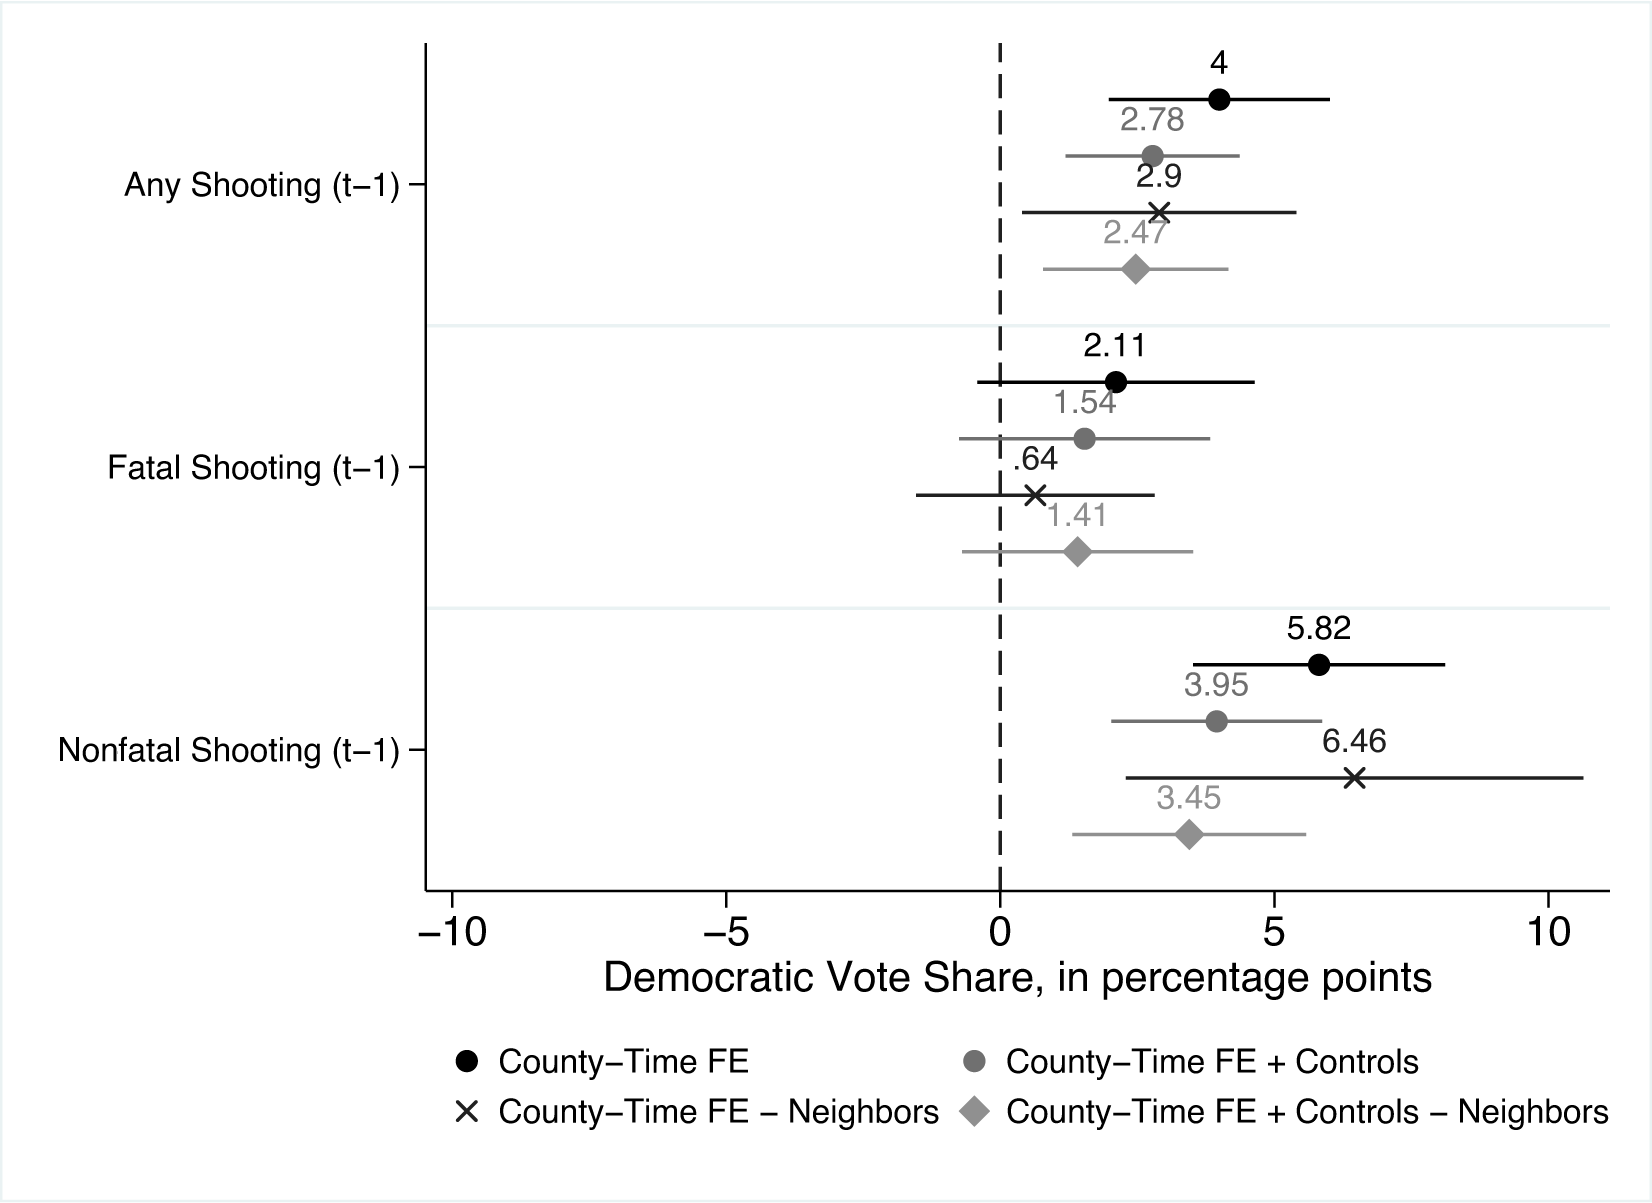
We find that school shootings do not have a significant effect on voter turnout (see Figure 3.) They do, however, have a substantively large and highly statistically significant effect on relative electoral support for each party: Democratic vote share in affected counties increases, on average, by 4.51 percentage points following a shooting (see Figure 4; Table A.4 in appendix A.2 summarizes the full results of corresponding estimations). Our results are robust to different specifications of the model, including whether we use state fixed effects instead of county fixed effects, whether we use decade fixed effects as opposed to year fixed effects, and whether we include home state advantage as an additional control (see appendix A.3: Figures A.4 and A.5, Figures A.6 and A.7, and Figures A.8 and A.9.) Because shootings that result in deaths may cause greater alarm and receive more attention than those that do not, we also examine whether fatal and nonfatal events have different effects on vote share. We do so by estimating similar models but separating shootings that result in fatalities from those that do not. We do not find that any type of shooting has an effect on turnout (Figure 3). Regarding party vote share, shootings resulting in at least one death lead to an average increase in Democratic vote share of 4.4 percentage points. As Figure 4 shows, both types of shootings have large, statistically significant effects, with no significant differences between fatal, nonfatal, and all incidents.Footnote 15
Average Effect of a School Shooting on County-Level Turnout
Note: The figure depicts the estimated average effects of school shootings, expressed in terms of percentage-point shifts, across different model specifications. The figure includes 95% confidence intervals. All model specifications use county and election fixed effects. Models are estimated using both the full and restricted (which includes only neighboring counties as the control group) samples and with and without controls. “Fatal shootings” include those resulting in at least one death, “nonfatal shootings” include those that did not cause any deaths, and “any shooting” includes both types of events.

Average Effect of a School Shooting on County-Level Democratic Vote Share
Note: The figure depicts the estimated average effects of school shootings, expressed in terms of percentage-point shifts, across different model specifications. The figure includes 95% confidence intervals. All model specifications use county and election fixed effects. Models are estimated using both the full and restricted (which includes only neighboring counties as the control group) samples and with and without controls. “Fatal shootings” include those resulting in at least one death, “nonfatal shootings” include those that did not cause any deaths, and “any shooting” includes both types of events.

As a robustness check, we also assessed whether there are spillover effects into nearby counties; we did so by estimating models in which our primary independent variable is a continuous measure of the distance to the closest county that experienced a shooting during the same electoral period (rather than a dichotomous county-level treatment variable). In the model focused on vote share, we find that there is a negative relationship between distance to the closest county that experienced a shooting and county-level support for Democrats; in other words, among counties that did not experience shootings, proximity to counties that did predicts greater Democratic vote share—a pattern that suggests that spillover effects do exist. As is the case in our main analysis, when our dependent variable is turnout rather than partisan vote share, the effect is not statistically different from zero. See appendix A.3, Figure A.11.
Given this evidence of spillover effects when it comes to partisan vote share, we also use a more conservative approach to estimate the effects of school shootings. Rather than including all counties that did not experience shootings, we include only counties that did not experience shootings and share a border with a treated county. Because neighboring counties likely share several characteristics correlated with party vote share—and because there are potential spillover effects to them—restricting the analysis to these counties is a more conservative strategy to identify the effect of shootings. Put differently, focusing on a smaller control group consisting of counties that are similar to treated counties—and that we expect may, to a lesser degree, be treated themselves—is a hard test for our findings. The results are plotted in Figures 3 and 4. As both figures show, our findings hold for this smaller group of counties, although the magnitude of the effect on Democratic vote share—as expected given the potential for spillover—is smaller. The fact that this effect holds when restricting the control group provides further support for our finding of a large and significant effect of school shootings on support for the Democratic Party.
We also examine whether the effects of school shootings depend on electoral context. More specifically, it is possible that individuals are more likely to change their voting behavior when they believe that their vote is unlikely to affect the result of the election. Put differently, in electorally uncompetitive states, people may be more willing to express their disagreement with their own party if they believe that doing so will not alter the outcome of the election. In addition, it is possible that the intensity of presidential campaign efforts in electorally competitive states reduces the effects of shootings. We check for this sort of potential treatment effect heterogeneity in two different ways. First, we estimate models that examine whether the effect of school shootings on Democratic vote share differs in counties with small and large electoral margins. In order to do this, we interact our shootings variable with a dummy indicating whether the prior election was decided by fewer than 10 percentage points. The effect of a school shooting is slightly larger in counties where the prior election was decided by more than 15 points, but the coefficient of the interaction is not statistically different from zero, indicating that our findings hold in the areas in which they are most consequential. We again find null results with respect to turnout. (See Table A.5 in the appendix A.3.)
In addition, we examine whether the effect of school shootings is different in electorally crucial swing states by estimating the models restricted to the subset of states classified as swing states.Footnote 16 As Figure 5 shows, the effects of school shootings in swing states are slightly smaller than across all states but are nonetheless substantively meaningful and statistically significant.Footnote 17 Somewhat oddly, when comparing the effects of school shootings that result in fatalities with those that do not, we observe significant differences in their effects on Democratic vote share. This may be a product of the relatively small number of shootings in swing states or the ways in which campaigns address shootings in electorally crucial states. Our findings with respect to turnout are again null under this specification.Footnote 18
Average Effect of a School Shooting on County-Level Democratic Vote Share in Swing States
Note: The figure depicts the estimated average effects of school shootings in swing states, expressed in terms of percentage-point shifts, across different model specifications. The figure includes 95% confidence intervals. All model specifications use county and election fixed effects. Within states classified as swing states, models are estimated using both the full and restricted (which includes only neighboring counties as the control group) samples and with and without controls. “Fatal shootings” include those resulting in at least one death, “nonfatal shootings” include those that did not cause any deaths, and “any shooting” includes both types of events.

We also examine whether proximity to election day affects our findings. We estimated a model in which the number of days between the shooting and the next election is the main independent variable and include only counties that experienced a shooting between elections. We find that the number of days between the shooting and election day does not significantly change its effects on support for the Democratic Party or turnout.Footnote 19 In addition, we estimated models in which we interacted the shootings variable with a dummy variable capturing whether the shooting occurred before or after the midterm election; the interaction term indicates that the effects of pre- and postmidterm shootings are not statistically different from each other.Footnote 20 Together, these findings indicate that the effects of school shootings are not short-lived. Instead, shootings have important effects on subsequent county-level election results even when they are relatively temporally distant from the next electoral contest.
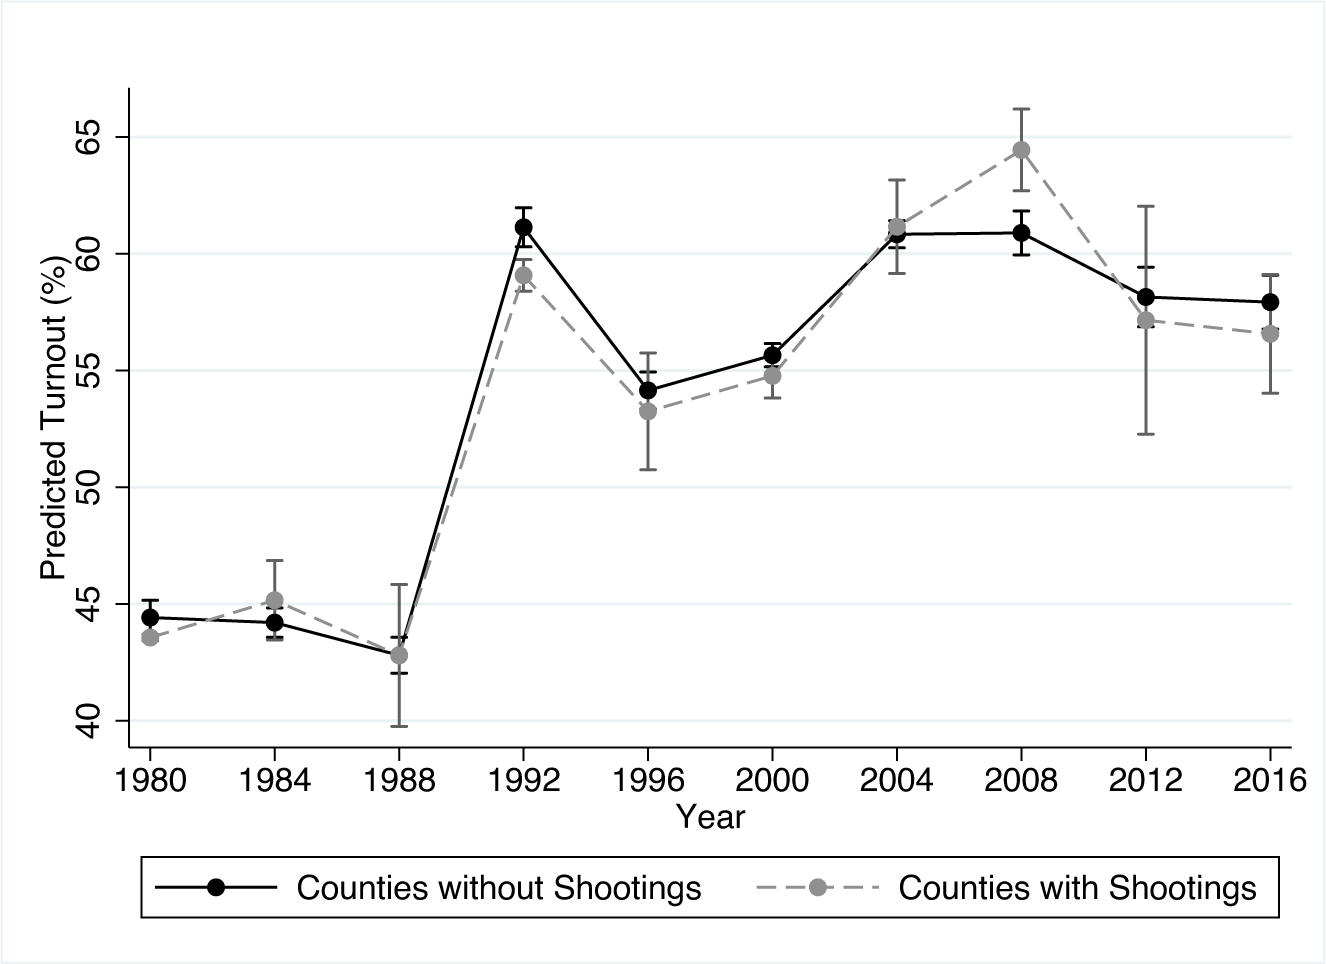
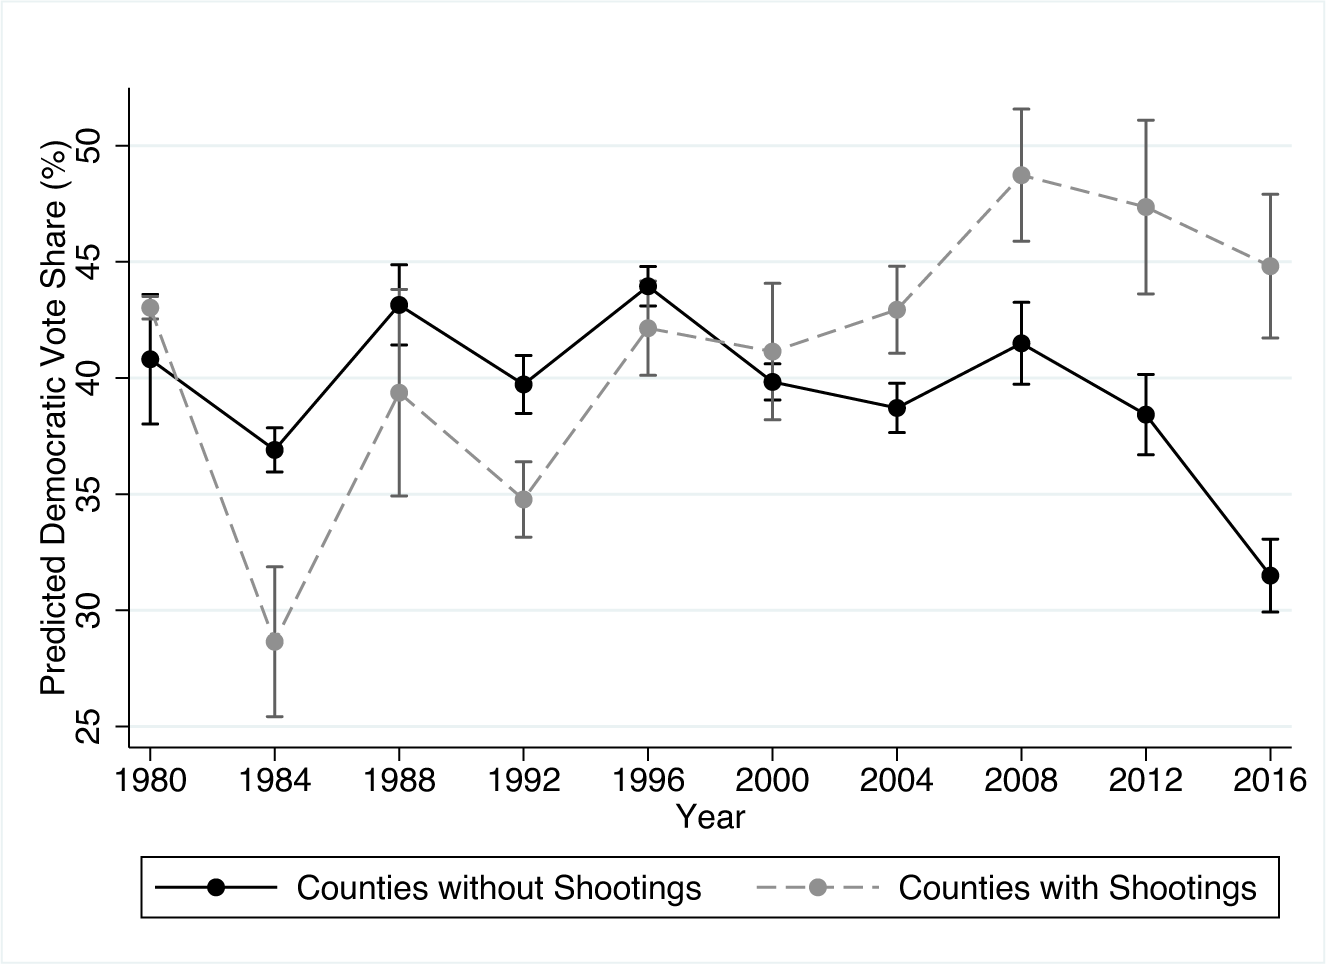
Finally, we examine whether the effects of school shootings on turnout and Democratic vote share have changed over time. Given the increased frequency of rampage school shootings and greater separation between the Democratic and Republican parties on gun control over time, these violent events may have had larger effects in more recent elections. Alternatively, however, it is possible that polarization could lead to smaller effects as a result of mass-level partisans becoming more committed to their parties’ stances on the issue. Consistent with the former, the effect of a school shooting on Democratic vote share has become greater over time. Estimating the marginal effect of a shooting on Democratic vote share and turnout for each election, we find the effects of school shootings on Democratic vote share have become increasingly large over time. These findings are depicted in Figure 7, which shows difference-in-differences estimates by year, highlighting adjusted predictions of Democratic vote share within counties that experienced and did not experience a school shooting between elections. Importantly, this finding suggests that partisan polarization among politicians may be a scope condition that is necessary for exposure to violence to influence partisan vote share; in other words, voters must recognize a gap between the parties on a relevant issue in order to reward or punish them in response to prominent events, like school shootings. However, despite these large differences across time, the null effects of school shootings on turnout appear to be constant through time (Figure 6).
Effect of a School Shooting on County-Level Turnout by Election
Note: The figure depicts difference-in-differences estimates by year of Democratic vote share (expressed in terms of county-level percentage) based on whether a county did or did not experience a school shooting in the time since the previous presidential election. The figure includes 95% confidence intervals.

Effect of a School Shooting on County-Level Democratic Vote Share by Election
Note: The figure depicts difference-in-differences estimates by year of Democratic vote share (expressed in terms of county-level percentage) based on whether a county did or did not experience a school shooting in the time since the previous presidential election. The figure includes 95% confidence intervals.

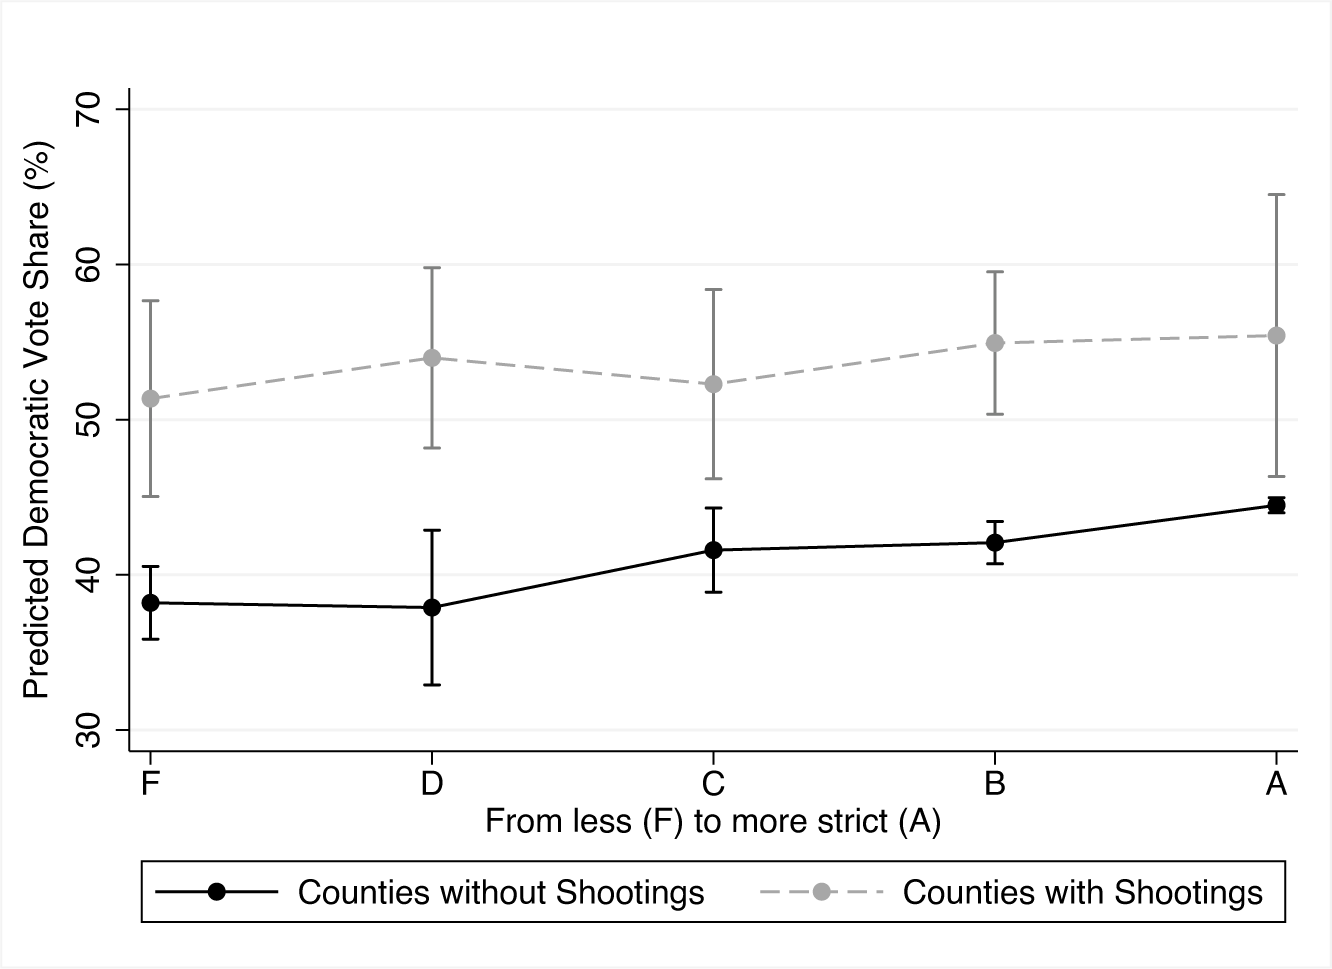
One of the hypothesized mechanisms connecting school shootings to partisan vote share is that voters punish the Republican Party for their lenient position on gun control. If this is the case, then we would expect to see smaller effects in states where gun laws are already strict. In these states, it is harder to adjudicate blame and punish the GOP following shootings. We test this mechanism by estimating whether shootings have heterogeneous treatment effects based on existing laws in the states in which they occur. We rely on the Giffords Law Center’s scorecard that ranks states from A (more strict) to F (less strict) based on their gun regulations. As Figure 8 shows, the marginal effect of a shooting on Democratic vote share gets smaller as the laws become more strict—a finding that aligns with our proposed mechanism.Footnote 21
Effects of School Shootings on County-Level Democratic Vote Share by State Gun Law Strictness
Note: The figure depicts difference-in-differences estimates by state gun law strictness of Democratic vote share (expressed in terms of county-level percentage) based on whether a county did or did not experience a school shooting in the time since the previous presidential election. Gun law strictness, based on the Giffords Law Center’s scorecard, ranges from F (less strict) to A (more strict). The figure includes 95% confidence intervals.

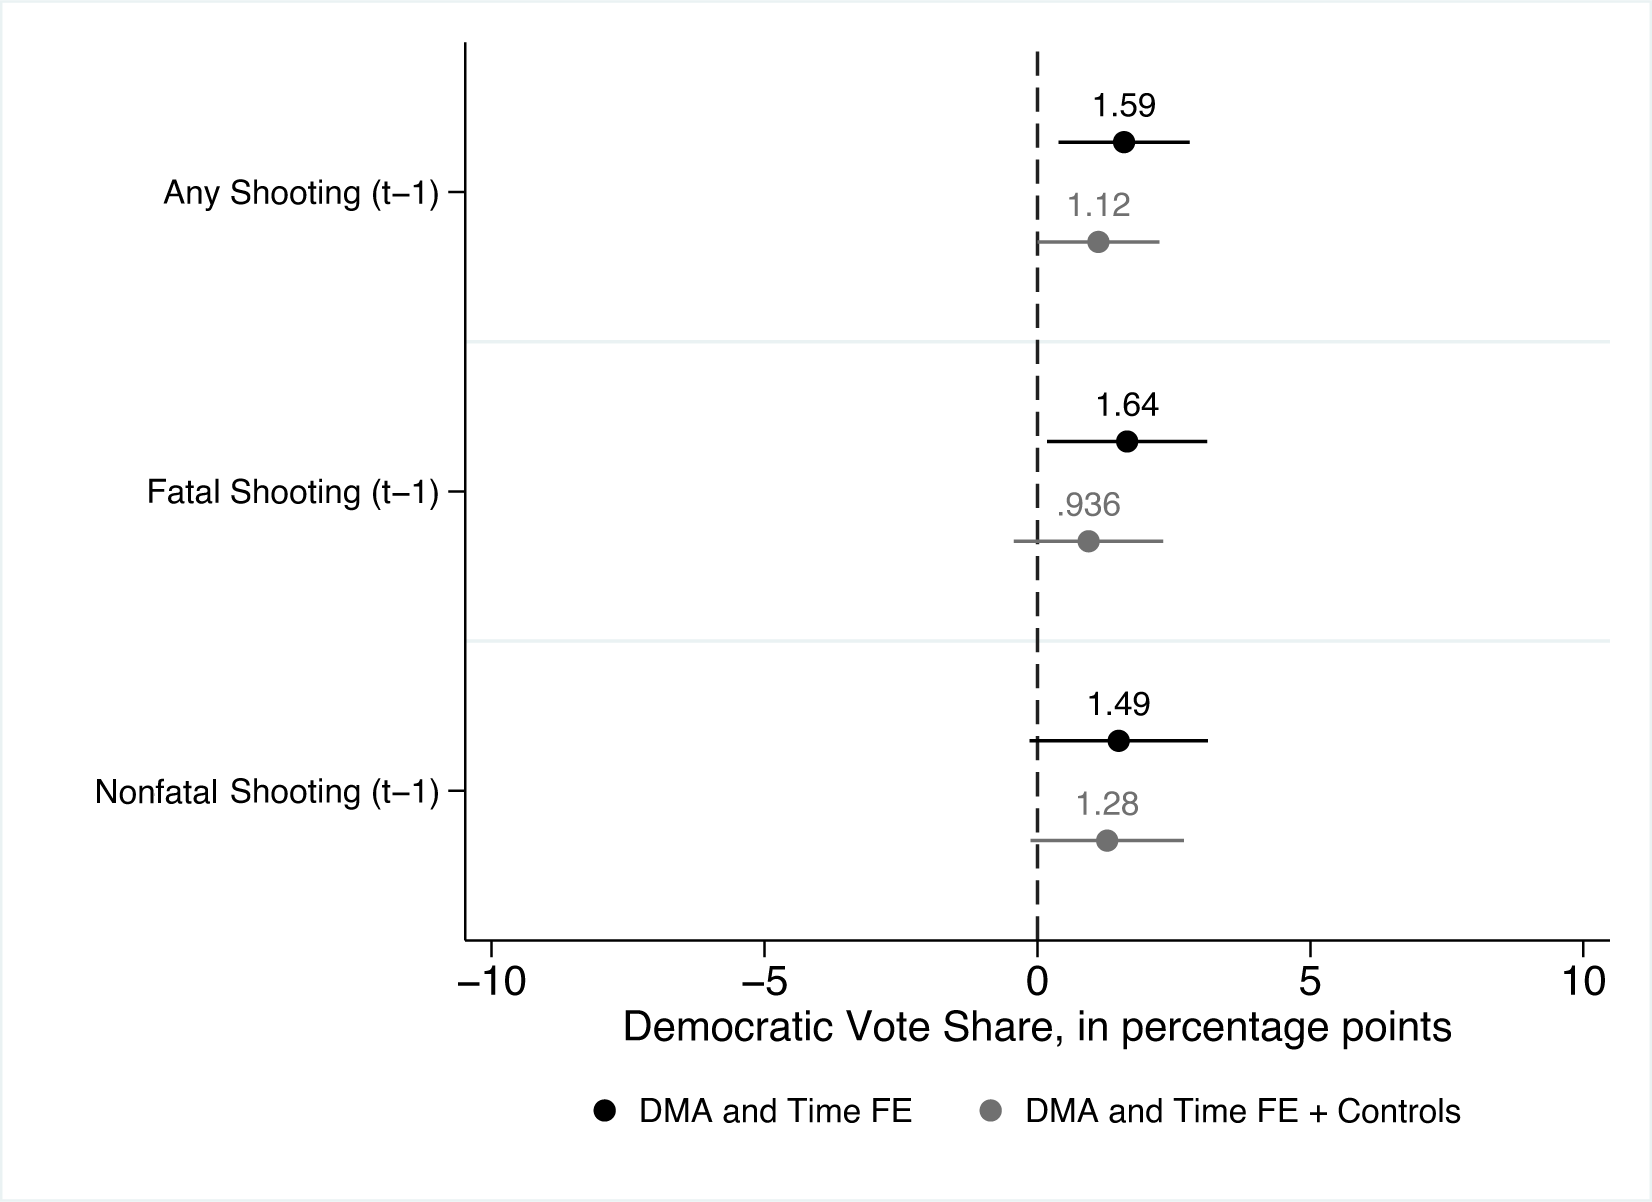
Finally, as one last robustness check, we explored whether our results hold at a different level of analysis by using designated market areas (DMAs)—rather than counties—as the unit of analysis. DMAs tend to be larger than counties and are used to define radio and television markets. This is useful for us for two reasons.Footnote 22 First, they provide us with a way to test whether our results hold when our unit of analysis comprises a larger geographic area. Second, they are closely related to media coverage of shootings; if a shooting occurs within a DMA, consumers of local news throughout that DMA are likely exposed to coverage of it. As Figure 9 shows, our main results hold when we use DMAs as our unit of analysis rather than counties; school shootings, in other words, increase the DMA-level vote share of the Democratic Party.Footnote 23 The size of the DMA-level effects are, perhaps unsurprisingly, a bit smaller than the county-level effects discussed earlier; this makes sense given the larger size of these areas relative to counties. Our findings here, beyond indicating that our results do not depend on the use of counties as the unit of analysis, also suggest that informational exposure through the local news media (which likely gives greater, more personalized, and more durable attention to school shootings than the national media) may be a mechanism that connects school shootings to electoral outcomes.
Average Effect of a School Shooting on DMA-Level Democratic Vote Share
Note: The figure depicts the estimated average effects of school shootings, expressed in terms of percentage-point shifts, on Democratic vote share at the DMA level across different model specifications. The figure includes 95% confidence intervals. All model specifications use DMA and election fixed effects and are estimated with and without controls. “Fatal shootings” include those resulting in at least one death, “nonfatal shootings” include those that did not cause any deaths, and “any shooting” includes both types of events.

Testing Primary Assumptions
As noted earlier, the primary source of support for our main assumption—the conditional unconfounded treatment assumption—is that there is no evidence that rampage school shootings are predictable or that there is a systematic pattern defining their occurrence in particular counties at particular points, which means we can treat their occurrence as-if random. Nonetheless, because the validity of our findings relies on this assumption, we performed additional empirical tests to support it. This assumption is not directly testable, but it is possible to judge its validity in three ways.
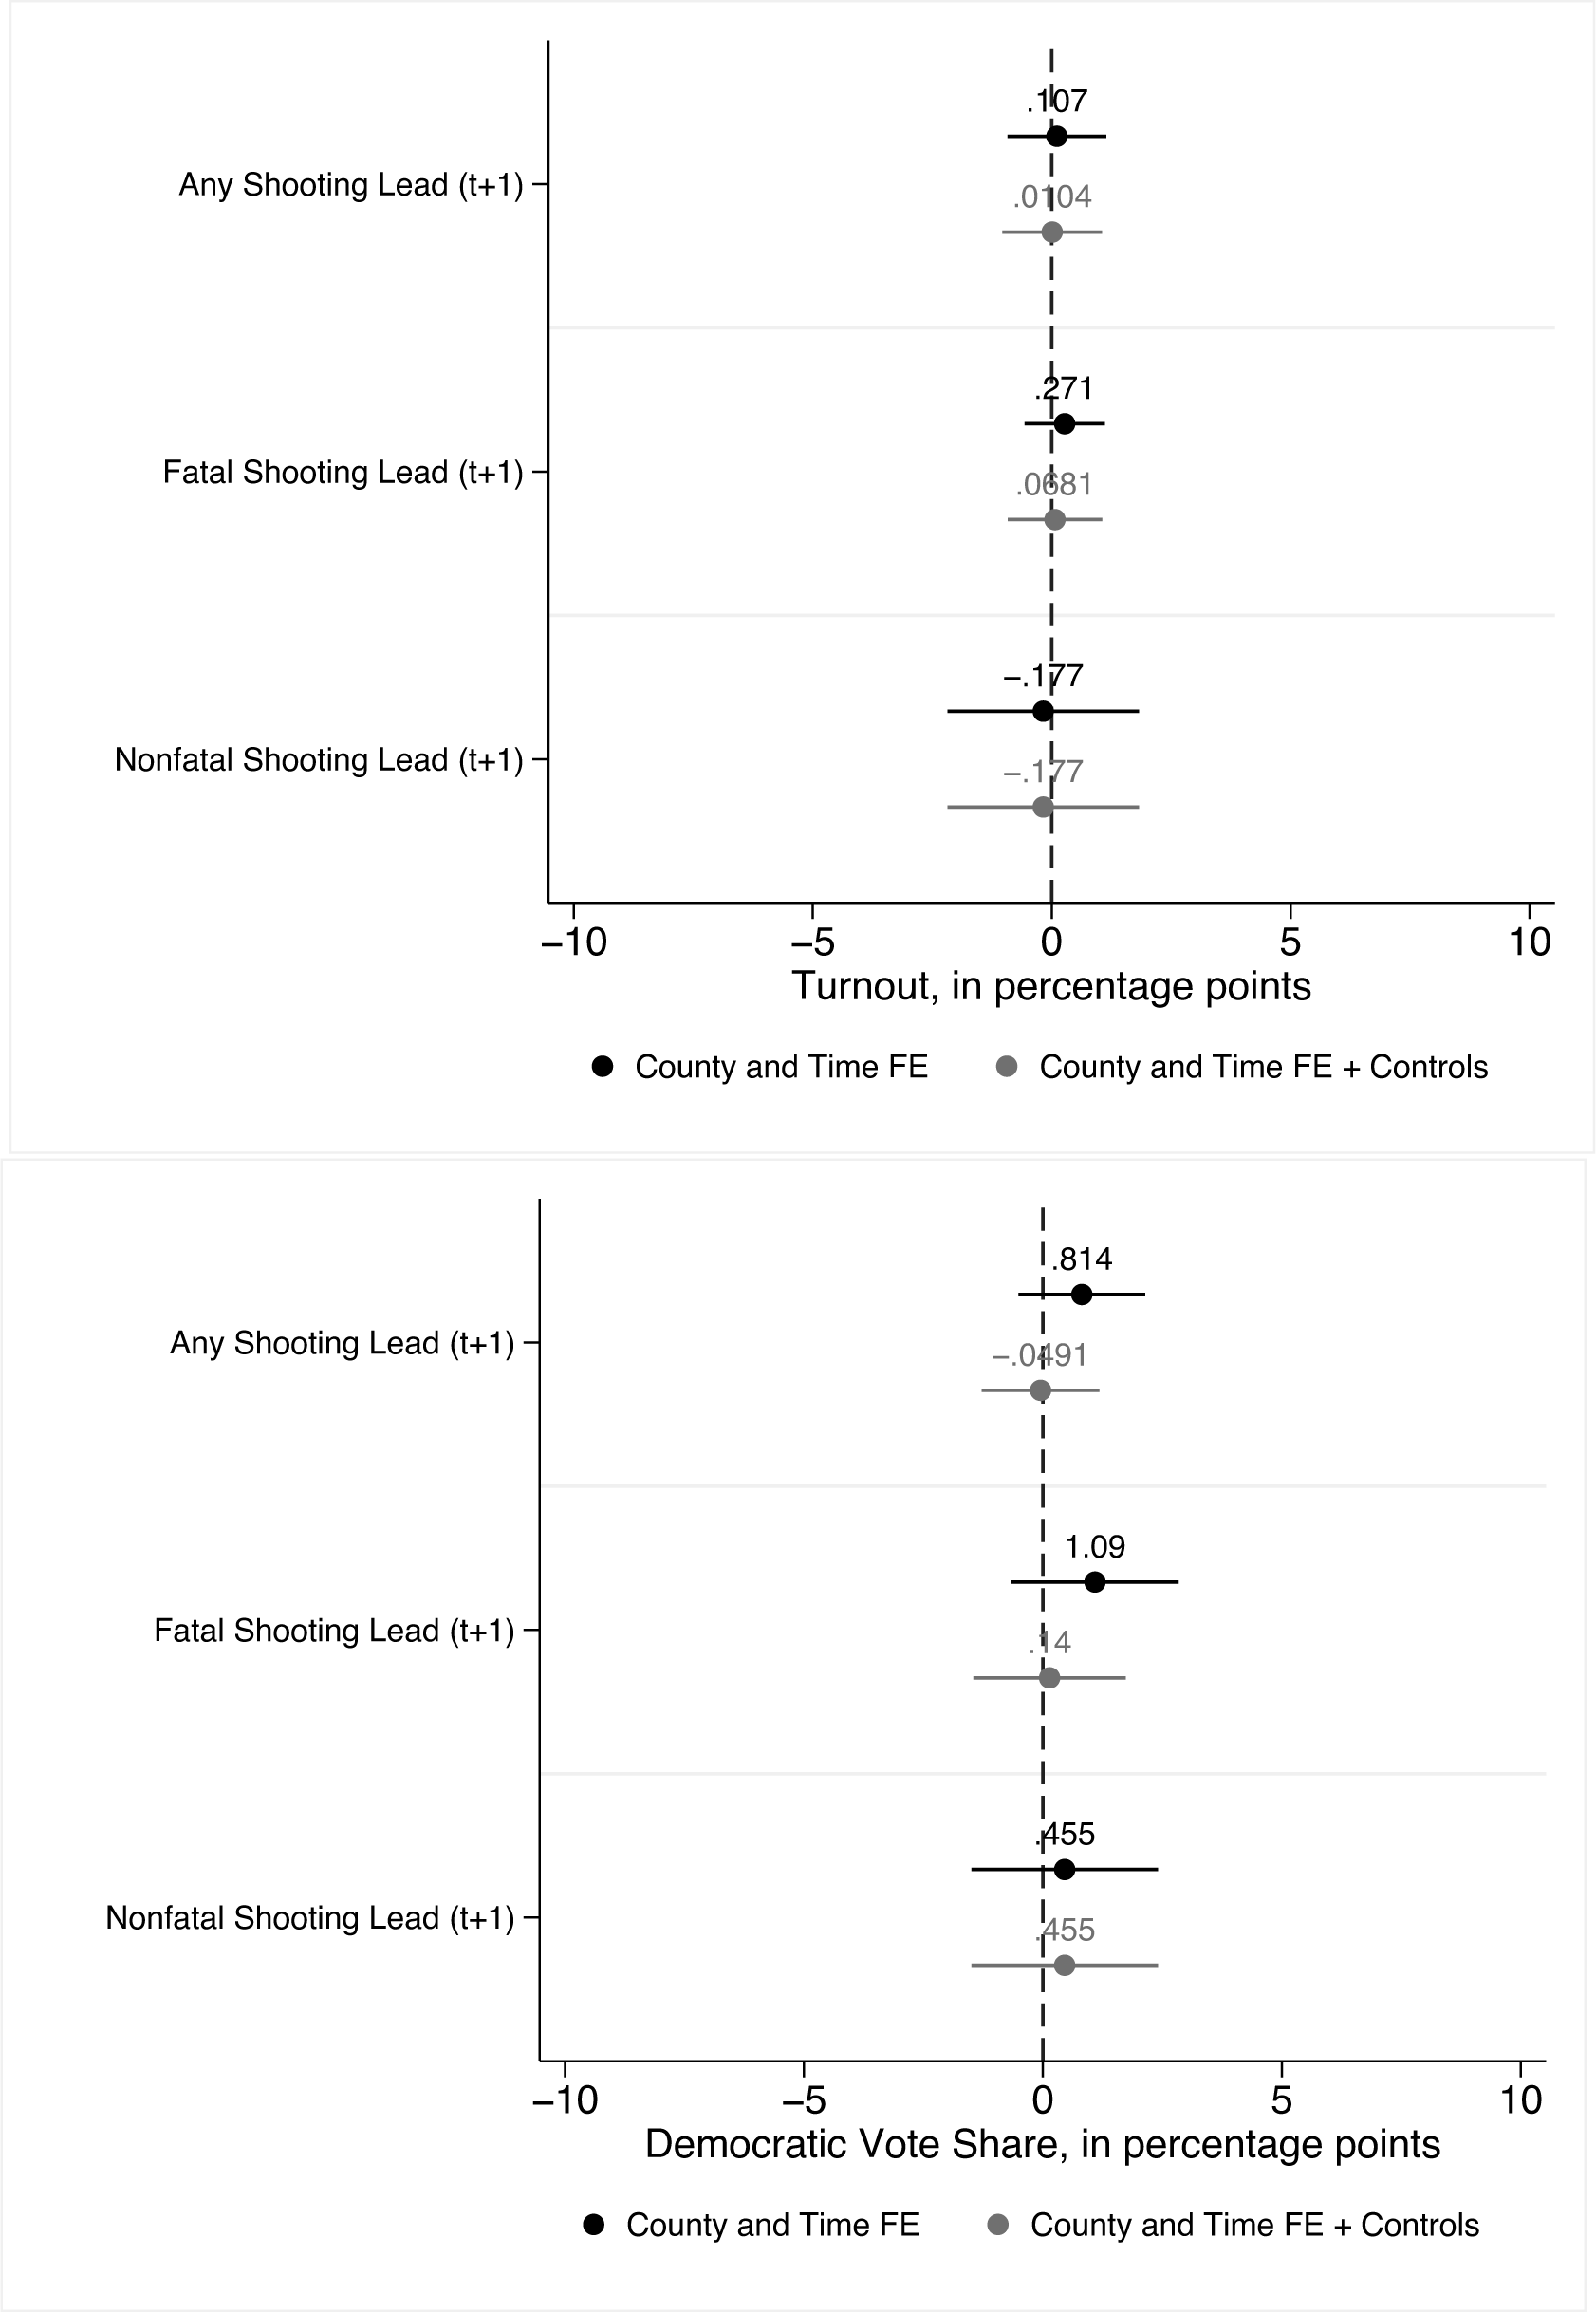
First, we looked for the presence of anticipatory effects with a placebo test using the leads of school shooting as the treatment. As Figure 10 shows, we do not find evidence of anticipatory effects as the coefficients are not statistically different from zero. This supports our main assumption.
Anticipatory Effects Tests Using Shooting Leads as Independent Variable
Note: The figures show the estimated average effect of the treatment lead (shooting t + 1) on Turnout and Democratic Vote Share with the 95% confidence intervals.

Second, we examined whether counties with and without a shooting had similar vote-share trends prior to the shooting. Figures in appendix A.4 show the pretreatment trends of partisan vote share for each electoral period. Although the unconfounded treatment assumption cannot be directly tested via graphical representation, the trends in these figures increase our confidence in our identification strategy. In their review of best practices for difference-in-differences models, Wing, Simon, and Bello-Gomez (Reference Wing, Simon and Bello-Gomez2018) argue that when pretreatment trends of the outcome behave similarly—“loosely speaking”—they are helpful but not definitive for assessing whether the unconfounded treatment assumption is met. In addition, these graphical representations of trends are better suited for cases in which the main assumption is fully unconditional parallel trends. As our assumption translates into conditional parallel trends—because we account for covariates—these graphs are less informative. When considered together, our figures suggest that preshooting Democratic vote-share trends were largely similar across treated and nontreated counties in each period. Indeed, the fact that they show such similar trends despite the caveats noted above increases our confidence in our main assumption.
Third, we also checked for covariate balance tests for our control variables. They can be considered balanced so long as the variance ratio (the ratio of variance of propensity scores in treated cases and the variance in propensity score of control cases) is between 0.5 and 2. This is the case for all of our control variables. Together, these three analyses suggest that the conditional parallel trends assumption is likely to hold at the county level.
Finally, one other potential concern is that the number of treated counties in our analysis is much smaller than the number of control cases. To assess this, we use randomization inference to make sure that our results are not a product of the small number of counties that experienced a shooting relative to the number of counties that did not (Conley and Taber Reference Conley and Taber2011; Ferman and Pinto Reference Ferman and Pinto2019). This randomization inference enables us to simulate all possible random assignments of shootings and calculate a p-value “to assess whether the actually observed realization of the statistic is ‘extreme’ and thus whether the null hypothesis has to be rejected” (Heß Reference Heß2017, 633).Table 1 shows the results of this test where T(obs) corresponds to the realization of the test statistic in the data, c is the count of how many resampled assignments produced a test statistic more extreme than T(obs), and n is the total number of resamplings. With this information, the p-value is the fraction of extreme realizations, calculated as p = c/n, and SE(p) is the standard error of that p-value estimate, based on the “sample” of n resamplings.
Randomization Inference Testing (Resampling Shootings)

Note: β corresponds to the coefficient of the model without controls, and γ corresponds to the model with county-level controls.
In Table 1, β corresponds to the effect of a rampage school shooting without controls (first model in Figure 4) and γ corresponds to the model after adding controls (second model in Figure 4). The results presented in the table suggest that our findings are not a product of the small proportion of observations that are treated in comparison with the size of the control group.
Discussion and Conclusion
School shootings shake American society to the core every time they occur. The sensitivity of this heinous form of violence has to do with its main attributes—massive violence that is mostly perpetrated by and against children—as well as with the widespread and sensationalized media coverage it receives. Several scholars have studied how, despite being uncommon, school shootings become very salient events, arguably creating a “moral panic” whereby fear of violence explodes and safety perceptions deteriorate. Yet, we do not know whether, and if so how, these violent shocks affect electoral outcomes in the United States.
Leveraging the as-if-random temporal distribution of school shootings and relying on an original dataset, we identify the causal effect of these attacks at the local level on both voter turnout and the relative vote share of the US’s two major political parties. We find that school shootings do not increase political participation at the county level. We do find, however, that these events affect the relative electoral standing of the two major political parties: In counties where at least one school shooting occurred, Democratic vote share in the next presidential election increased by a remarkable average of nearly 5 percentage points. These effects are robust to different model specifications and are highly statistically significant.
Notably, our findings differ from those of Hassell, Holbein, and Baldwin (Reference Hassell, Holbein and Baldwin2020), who—in a recently published paper on the same topic—find that school shootings produce null effects on a number of outcomes, including partisan vote share. These contrasting findings can be explained by seemingly small but nonetheless important conceptual, coding, and design differences between the two studies. Although Hassell, Holbein, and Baldwin (Reference Hassell, Holbein and Baldwin2020) do not provide a definition of school shooting, they implicitly rely on broader inclusion criteria that seem to include all shootings that take place on school grounds. Thus, although each study began with the same list of shootings, Hassell, Holbein, and Baldwin (Reference Hassell, Holbein and Baldwin2020) include in their dataset a number of incidents that—because they do not fit our definition of rampage shootings—we chose to exclude. This is an important distinction: Because nonrampage shootings—such as targeted instances of gang violence or suicides—are nonrandom, they are both less likely to trigger some of the feelings, discussed earlier in the paper, that could cause individuals to alter their political behavior and are less appropriate for causal inference. This distinction would be less important if nonrampage shootings made up a very small proportion of total school shootings, but this is not the case. Indeed, during the overlapping years in our studies (2006 to 2015), Hassell, Holbein, and Baldwin (Reference Hassell, Holbein and Baldwin2020) include 147 school shootings. This contrasts with the 56 shootings we have for that same period after excluding shootings that do not meet the criteria for rampage shootings.Footnote 24 Moreover, our dataset covers a much longer period, which enables us to paint a more complete picture of the effects rampage school shootings have had on American politics over several prior decades. Overall, we believe our findings more accurately reflect the effects of rampage school shootings—as opposed to all shootings taking place on school grounds—and our findings hold when we replicate their models with our data.
How do our results relate to our current understanding of the effects of violence on voting behavior? The null finding on turnout is notable, as a growing number of studies have found that political violence and crime either increase or decrease political participation, in the United States—as was the case after the September 11 attacks—and beyond. And the positive finding on party vote share is equally notable given what we know about the strength of partisan identification and its influence on vote choice. Our results suggest that violence should be considered an important potential determinant of partisan voter behavior. Moreover, they suggest that different types of violence may have distinct effects on political behavior—and this possibility has important implications for the growing literature on the behavioral effects of criminal and political violence. Rather than focusing on the average effect of violence on victims’ political behavior, we should theorize the distinct effects that various types of violence, occurring in different contexts, can have on individuals’ preferences, beliefs, and choices and study their implications empirically.
Further, our findings suggest that—although polarization typically makes individuals less responsive to new information—it can actually assist voters in updating their views in response to salient events that they have personally experienced. By making it clear to voters where parties stand on relevant issues, it can actually help facilitate change. Indeed, the temporal patterns in our findings—in which effects are only present during recent election cycles—suggest that elite-level partisan polarization is an important condition that shapes the extent to which violent events have electoral effects; a large and durable gap between political parties on a relevant issue may be necessary for that issue to alter the relative vote share each receives. Finally, in demonstrating that localized events can influence support for political parties that have taken divergent stances on relevant issues, our results suggest that, in the aggregate and under certain conditions, voters—rather than just blindly punishing incumbents for phenomena, such as shark attacks, that may not be under their control—punish and/or reward parties in light of policy considerations. In this view, our findings support a relatively optimistic view of the electorate’s capabilities when it comes to holding politicians accountable, suggesting that political behavior, at least under certain conditions, responds rationally to new events (Page and Shapiro Reference Page and Shapiro2010).
The increase in Democratic vote share we identify could be explained by three potential mechanisms. First, it could be caused by increased participation among Democratic voters; however, as our data show that school shootings do not affect overall levels of turnout at the county level, our vote-share finding cannot solely be a result of more Democrats showing up to vote. A second possibility is that school shootings suppress Republican turnout while simultaneously increasing Democratic turnout; that is, our null findings regarding overall turnout rates could be masking a change in the relative turnout of Democratic and Republican voters. These findings would be consistent with most studies of the effects of political violence when it comes to increased participation—but not when it comes to suppressed voting. And finally, the increased Democratic vote share we identify could be a product of some typically Republican voters instead casting their ballots for Democrats and/or a systematic shift among the relatively small proportion of voters who are truly independent toward Democrats. This finding would be consistent with the literature indicating that political violence increases support for parties offering a greater sense of protection if the increased support for Democrats comes from individuals who believe that new gun control laws would help prevent school shootings. Yet, this mechanism—especially to the extent that it involves Republicans voting for Democrats—would not be consistent with the view of Americans’ political attitudes, and, in particular, vote choice, as rigid. These results therefore raise questions about the conditions under which political attitudes can change in short periods as a response to events—a phenomenon that has received little attention in the wake of growing evidence of motivated reasoning and confirmation bias.
Finally, insofar as changes in voting are driven by concerns about gun control, the fact that school shootings affect those living in the county where the attacks occur is consistent with earlier findings indicating that political participation in relation to gun policy is greater when individuals view the issue in deeply personal terms (Goss Reference Goss2006; Lacombe Reference Lacombe2019). Related, our results are also consistent with studies of the effect of extraordinary events that, by triggering strong emotions, make citizens more inclined to look for new information and support protective policies, leaving their partisan views aside (Atkeson and Maestas Reference Atkeson and Maestas2012). Indeed, living in close proximity to these horrific events may trigger feelings that substantially increase the extent to which individuals believe gun control laws personally affect them; if so, individuals may be more motivated to make political decisions based on the gun control issue (rather than other considerations, including their partisan affiliation) than would otherwise be the case. Democrats, in other words, may have achieved issue ownership over the reduction of gun violence and, as a result, tend to receive greater support when it is made more salient in particular locations as a result of school shootings (Petrocik Reference Petrocik1996). Although gun control is typically a more important issue among the minority of Americans who oppose stricter regulations than the majority who support them, our findings suggest that this may not be the case in communities that have experienced gun violence in schools (Lacombe, Howat, and Rothschild Reference Lacombe, Howat and Rothschild2019).
Our results—and their tension with some of the existing literature—reveal how much we still need to learn not only about school shootings but also about the effects of violence on political behavior more broadly. How do we reconcile the literature on the effects of violence on political behavior with the literature on the formation of political attitudes and voting behavior? What do we make of the different effects that distinct types of violence—such as selective assassinations, terrorism, crime, and nonpolitical rampage shootings—have on political behavior? We need better theoretical approaches as well as more-refined empirical studies that take into consideration the various contexts in which violence is used as well as by whom and against which targets (Arjona, Chacon, and Garcia-Montoya Reference Arjona, Chacon and Garcia-Montoya2019; Ley Reference Ley2018). If, as a long tradition in political philosophy contends, one of the central roles of the state is to ensure the protection of its citizens, understanding these effects is essential to the study of the relationship between the ruler and the ruled, and, more generally, of politics and societal change.
Supplementary Materials
To view supplementary material for this article, please visit http://doi.org/10.1017/S0003055421001179.
Data Availability Statement
Research documentation and data that support the findings of this study are openly available at the American Political Science Review Dataverse: https://doi.org/10.7910/DVN/5TBFXL.
Acknowledgments
We are grateful for the assistance of Ho Jun Yang in the early data collection efforts of this project. For extremely helpful feedback, we thank the participants at the Applied Quantitative Methods workshop at Northwestern University. Especially, we are indebted to James Druckman, Jason Seawright, Laurel Hardbridge-Yong, Kat Albrecht, Yamil Velez, and anonymous reviewers for their generous feedback. Finally, we are grateful to Clément de Chaisemartin for helping us set up robustness checks for potential treatment heterogeneity in two-way fixed effects models.







Comments
No Comments have been published for this article.