Many different methods can be used to predict elections (Stegmaier and Norpoth Reference Stegmaier and Norpoth2021). The PollyVote averages its forecasts to demonstrate the value of combining forecasts. The PollyVote project started in 2004 and, until today, has been applied to eight major elections: five in the United States and three in Germany. On average, across the last 100 days before the five US presidential elections from 2004 to 2020, the combined PollyVote forecast was more accurate than any of its component forecasts (Graefe Reference Graefe2021). Across the two German federal elections from 2013 to 2017, the PollyVote ranked eighth of all 24 forecasts that were available for both elections (Graefe Reference Graefe2019). This article expands the PollyVote to another country, France, and provides combined forecasts of the candidates’ vote shares in the first and second rounds of the 2022 French presidential election.
FORECAST COMPOSITION
The French PollyVote follows the same basic procedure as its American and German counterparts. First, I categorize forecasts based on their underlying information into three so-called component methods: polls, expectations, and models. Second, I average forecasts within each component method. Third, I average the forecasts of the three component methods to calculate the combined PollyVote forecast.
Polls
Vote-intention polls (hereafter referred to simply as polls) dominate the media’s coverage of electoral races, and people generally tend to interpret poll numbers as forecasts. Yet, because polls ask voters for whom they intend to vote if the election were held today, they merely capture a snapshot of public opinion at the time of the survey. Unless a poll were conducted directly before the election, we should not interpret its results as forecasts of what will happen on Election Day. One reason is that public opinion can change over time, and the longer the time to election, the higher the risk for this to happen. Stated differently, the shorter the time to Election Day, the lower the polling error, as shown by Jennings and Wlezien (Reference Jennings and Wlezien2018).
Polls conducted at around the same time can provide quite different results due to methodological differences. One way to cancel out errors of individual polls is to aggregate polls, which—as with combining forecasts—generally improves accuracy. It thus is no surprise that poll aggregation has become the de facto standard for reporting poll numbers. However, people may overlook that poll aggregators cannot eliminate systematic biases inherent across surveys, which may arise—for example—because of systematic nonresponse (Gelman et al. Reference Gelman, Goel, Rivers and Rothschild2016).
At the time of writing, the PollyVote included data from Datapolitics (https://datapolitics.fr), which aggregates polls (collected by NSPPolls) by calculating a weighted average. Datapolitics thereby assigns higher weight to polls that have larger sample sizes as well as to those conducted by survey institutes that historically were more accurate.
Expectations
Expectations-based forecasts rely on people’s judgment of what will happen on Election Day. Available approaches vary with respect to whose judgment is being aggregated (e.g., experts versus laymen), how the information is gathered (e.g., simple surveys versus betting markets), and what is being forecast (e.g., vote shares versus winning probabilities).
At the time of writing, expectations-based vote-share forecasts were available using two methods: expert judgment and citizen forecasts. The expectations-based component forecast is the simple average across the expert judgment and citizen forecasts. Forecasts from betting markets—a regular entry in the US and German versions of the PollyVote—were unavailable because available markets for the French presidential election (e.g., IEM, Hypermind, and Predictit) provide only winning probabilities and no vote-share forecasts.
Expert Judgment
Although asking domain experts about what is going to happen is a popular method for making predictions, empirical evidence shows that the predictive value of expert judgment is limited. Especially when forecasting complex problems, experts’ forecasts often are no more accurate than those of laymen or simple statistical models (Tetlock Reference Tetlock2005).
Regarding the prediction of election outcomes, it nonetheless seems reasonable to assume that experts have value relative to alternative methods (e.g., polls). The reason is the availability of extensive domain knowledge, a condition under which Green, Graefe, and Armstrong (Reference Green, Graefe, Armstrong and Lovric2011) expected experts’ forecasts to be useful. For example, political scientists who study voting behavior and campaign effects should be able to assess how polling numbers may change relative to recent and future events. Similarly, pollsters have insight about response rates and know whether certain demographic groups are difficult to poll, which should help them to assess potential bias in poll numbers. In other words, we would expect experts to be able to improve on the accuracy of polls or, at least, to identify their directional error.
The limited evidence available supports the notion that expert judgment can add value for predicting election outcomes. Graefe (Reference Graefe2018) analyzed the accuracy of 452 individual expert forecasts across four US presidential elections from 2004 to 2016. Although a randomly selected expert forecast, on average, was less accurate than the RealClearPolitics (RCP) poll average from the same day, almost two thirds of the experts’ forecasts (62%) correctly predicted the RCP’s directional error. In other words, experts are somewhat better than guessing in identifying the directional error of polls. Therefore, expert judgment is likely to improve forecast accuracy when combined with polls.
Averaging forecasts from multiple experts also is beneficial. Jones and Cuzán (Reference Jones and Cuzán2013) found that the simple average of US presidential-election forecasts made by several experts outperformed polls for longer forecast horizons.
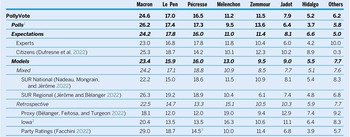
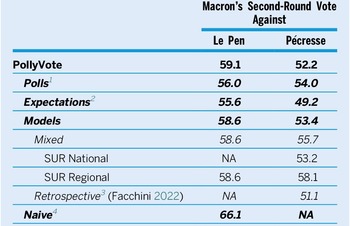
I emailed survey invitations to 11 experts (i.e., political scientists, journalists, and pollsters).Footnote 1 In the online questionnaire, experts were asked to forecast vote shares of seven candidates (and all other candidates combined) in the first round of the 2022 French presidential election. Table 1 shows simple averages of forecasts from five experts who responded to the survey conducted January 18–21, 2022. In addition, experts were asked to predict vote shares for two hypothetical second-round runoffs (i.e., Macron versus Le Pen and Macron versus Pécresse). Table 2 shows these results.
First-Round Vote-Share Forecasts (in %) of the PollyVote and Its Components

1 Source: Datapolitics.fr
2 I thank Éric Bélanger for calculating the forecast from the Iowa model.
3 Note that my calculation of the forecast for Pécresse differs from the forecast provided by Facchini (Reference Facchini2022), who predicted a vote share of 24.2%. I distributed the right-wing vote across Pécresse, Zemmour, and Dupont-Aignan, using latest poll numbers.
Data as of January 25, 2022, available at Harvard Dataverse (Graefe Reference Graefe2022).
Macron’s Second-Round Vote-Share Forecasts (in %) of the PollyVote and Its Components, Conditional on the Challenger

1 Source: politico.eu/europe-poll-of-polls/france.
2 Expectations include only expert judgment. No second-round forecasts were available from citizen forecasts at the time of writing.
3 Retrospective models include only the forecasts from party ratings model, using the average of the two second-round forecasts provided by Facchini (Reference Facchini2022). The proxy and Iowa models did not provide second-round forecasts.
4 The naïve no-change forecast used the result of the 2017 runoff between Macron and Le Pen.
Data as of January 25, 2022, available at Harvard Dataverse (Graefe Reference Graefe2022).
Citizen Forecasts
Citizen forecasts are derived from survey respondents’ answers about who they think will win an election. Prior research found that citizen forecasts often outperform alternative forecasting methods. For example, analyzing 449 months of data for British general elections from 1950 to 2017, Murr, Stegmaier, and Lewis-Beck (Reference Murr, Stegmaier and Lewis-Beck2021) found that citizen forecasts were more accurate than polls in predicting both election winners and seat shares. Graefe (Reference Graefe2014) found that across the last 100 days prior to the seven presidential elections from 1988 to 2012, citizen forecasts were more accurate than four alternative methods: polls, betting markets, models, and expert forecasts.
Despite the predictive power of citizen forecasts, public-opinion surveys rarely include vote-expectation questions and only ask for people’s vote intention. One reason may be that there are no clear guidelines on how to best obtain survey participants’ electoral expectations and translate them into a forecast. As pointed out by Graefe (Reference Graefe2016), there are many methodological questions, especially in multiparty elections.
The good news is that researchers have started to collect citizen forecasts for different types of elections. For the 2022 French presidential election, Dufresne et al. (Reference Dufresne, Jérôme, Lewis-Beck, Murr and Savoie2022) provided citizen forecasts based on data from representative surveys of 1,000 respondents. Table 1 shows the citizen forecasts derived from their survey conducted in late November 2021.
Models
The 2022 French PollyVote combines forecasts from four models, all of which provide election forecasts based on aggregate data. As shown in table 1, three models are purely retrospective, whereas two models are mixed in that they incorporate components of retrospective and prospective voting. The PollyVote first averages the forecasts within and then across these categories to calculate its model-component forecast.
Retrospective Models
The proxy model predicts a total vote share of 47.3% for all left-wing candidates, using the prime minister’s job-approval rate as a single independent variable. In the article that presents the proxy model in this symposium, Bélanger, Feitosa, and Turgeon (Reference Bélanger, Feitosa and Turgeon2022) also refer to the Iowa model, which has been used to forecast previous French elections (e.g., Lewis-Beck, Bélanger, and Fauvelle-Aymar Reference Lewis-Beck, Bélanger and Fauvelle-Aymar2008). The Iowa model is similar to the proxy model in that it also predicts the combined vote for all left-wing candidates using a measure of the incumbent’s popularity.Footnote 2 The difference is that the Iowa model includes one additional variable: the national unemployment rate as a structured measure of the state of the economy. Because both models predict the total vote shares of all left-wing (and, therefore, all right-wing) candidates, the PollyVote translates these figures to vote-share forecasts for each candidate using daily updated poll numbers.Footnote 3 A third model, presented by Facchini (Reference Facchini2022), uses party ratings to predict party-vote shares. Again, the PollyVote uses daily updated poll numbers to convert vote shares of blocs (e.g., the right-wing) to vote shares for each candidate (e.g., Pécresse, Zemmour, and Dupont-Aignan). This also is the reason why some of the numbers in table 1 differ from those provided by Facchini (Reference Facchini2022).
Mixed Models
Mixed models include both retrospective and prospective aspects of voting. Two models of that type are available: those by Jérôme and Bélanger (Reference Jérôme and Bélanger2022) and by Nadeau, Mongrain, and Jérôme (Reference Nadeau, Mongrain and Jérôme2022). Essentially, these models consist of several equations that use different predictor variables that were estimated through multiple-regression analysis. Each equation then was used to predict the vote share(s) of a specific candidate or party (e.g., the incumbent) or a bloc of parties (e.g., the Diverse Right or the Total Left).
The models share several variables, including retrospective variables, such as the level of—and change in—the unemployment rate or the incumbent’s popularity, as well as prospective variables, such as vote-intention polls. The main difference between both models is that Jérôme and Bélanger (Reference Jérôme and Bélanger2022) predicted vote shares at the regional level and then aggregated the resulting forecasts to national vote shares (i.e., SUR regional), whereas Nadeau, Mongrain, and Jérôme (Reference Nadeau, Mongrain and Jérôme2022) directly predicted national vote shares.
As with the retrospective models described previously, the two mixed models do not predict vote shares for all candidates listed in table 1. In these cases, the PollyVote again uses daily poll numbers to translate the numbers to vote shares for each candidate.
ELECTION FORECAST
Table 1 shows the candidates’ vote-share forecasts for the first round in the 2022 French presidential election, provided by the PollyVote and its various components. As of January 25, less than three months before the election, the PollyVote predicted that incumbent president Emmanuel Macron would win the first round with 24.6% of the vote.Footnote 4 According to the PollyVote, Macron’s opponent in a second-round runoff most likely would be a woman. Whether it was Far Right candidate Marine Le Pen or Valérie Pécresse, candidate of The Republicans, however, was a completely open question: their predicted vote shares were only half a percentage point apart.
Table 2 provides forecasts for these hypothetical matchups. Fewer component forecasts were available because neither the proxy nor the Iowa model provided second-round forecasts, and the SUR national model as well as the party-ratings model provided a forecast for only a Macron-versus-Pécresse runoff. Expectations-based forecasts were limited as well because citizen forecasts for the second round were not available. The combined PollyVote predicted that President Macron would be reelected regardless of who would be his opponent. In a potential runoff against Le Pen, Macron was forecast to win 59.1% of the vote. This forecast included a naïve no-change forecast using the 2017 runoff result, when Macron won two thirds of the vote against Le Pen. Adding a naïve forecast to the combination is in line with evidence-based forecasting guidelines (Armstrong, Green, and Graefe Reference Armstrong, Green and Graefe2015), and prior research showed that this approach increases the accuracy of a combined forecast (Graefe Reference Graefe2021). In comparison, the PollyVote expected a tighter race for a potential runoff between Macron and Pécresse, predicting that Macron would gain 52.2% of the vote. It is interesting that the consensus of five expert forecasts was a small advantage for Pécresse.
CONCLUSION
Combining forecasts improves accuracy. As shown in prior research, the combined PollyVote forecast is at least as—and often much more—accurate as its typical component-method forecast (Graefe Reference Graefe2019, Reference Graefe2021). This is a given, at least if we use the simple average as the method of combining. Parsimony—a desirable feature of any forecasting model that estimates relationships between variables from historical data (Lewis-Beck Reference Lewis-Beck2005)—is not a concern when averaging forecasts. Rather, it is a major advantage of the PollyVote that the method can integrate all available information, thereby adhering to recommended forecasting principles (Armstrong, Green, and Graefe Reference Armstrong, Green and Graefe2015). In addition, collecting all available forecasts across elections enables the identification of patterns in the evolution of election forecasting. For example, the compilation of US presidential-election forecasts from 2004 to 2020 showed that model-based forecasting has moved away from fundamentals-based models toward mixed models, which include both fundamental data and polling data (Graefe Reference Graefe2021). Also, it generally is not a good idea to draw conclusions about the performance of a particular method (or model) from a single election, which is why tracking the performance of election forecasts over time is important. In expanding to different countries, the PollyVote aims to further extend its forecast compilation and contribution to forecasting knowledge.
…it generally is not a good idea to draw conclusions about the performance of a particular method (or model) from a single election, which is why tracking the performance of election forecasts over time is important.
DATA AVAILABILITY STATEMENT
Research documentation and data that support the findings of this study are openly available at the PS: Political Science & Politics Harvard Dataverse at https://doi.org/10.7910/DVN/OLGXYA.
CONFLICTS OF INTEREST
The author declares that there are no ethical issues or conflicts of interest in this research.