I. INTRODUCTION
Solids exhibiting caloric effects (CE) associated with the reversible change of temperature ΔT AD or entropy ΔS CE under external field (magnetic H, electric E, mechanical stress σ, or hydrostatic pressure p) at constant entropy and temperature, respectively, attract considerable attention because of their potential possibilities for use as working bodies in thermodynamic cycles of modern and effective alternative solid-state refrigeration technologies. Over a long period of time, the main purpose of investigations was to reveal the materials-refrigerants with a giant magneto-CE (MCE) Reference Tishin and Spichkin1–Reference Wei, Chak-Tong and You-Wei3 and electro-CE (ECE). Reference Scott4–Reference Lu and Zhang6 Currently, investigators were also interested in the barocaloric effect (BCE), partially because of its versatility. Reference Strässle and Furrer7–Reference Flerov, Gorev, Tressaud and Laptash10 Indeed, such an effect can be realized in materials of distinct physical nature.
The dependences of both extensive ΔS CE and intensive ΔT AD CE on the generalized ferroic order parameter Y (magnetization, polarization, and elastic deformation) and conjugated external field X are described by the following equations: Reference Tishin and Spichkin1
 $$\Delta S = {\int {\left( {{{\partial Y} \over {\partial T}}} \right)} _X}{\mathop{\rm d}\nolimits} X\quad {\rm{,}}$$
 $$\Delta T = - {\int {{T \over {{C_X}}}\left( {{{\partial Y} \over {\partial T}}} \right)} _X}{\mathop{\rm d}\nolimits} X\quad {\rm{.}}$$
The largest value of (∂Y/∂T) X derivative is in ferroic materials (ferromagnets, ferroelectrics, and ferroelastics) in the temperature region near phase transitions close to the tricritical point. Reference Tishin and Spichkin1
Because very often ferromagnetic and ferroelectric phase transitions in monoferroic materials are followed by anomalous behavior of thermal expansion, one can elevate the ΔT AD and ΔS CE values using the external hydrostatic or uniaxial pressure in addition to magnetic or electric field. To our knowledge, in spite of such an evident fact, there are rather few attempts to study the CE of the different nature in the same material. For example, investigations of MCE and BCE were performed in Fe49Rh51 and Heusler shape memory alloys Reference Annaorazov, Nikitin, Tyurin, Asatryan and Dovletov11–Reference Castillo-Villa, Mañosa, Planes, Soto-Parra, Sānchez-Llamazares, Flores-Zūñiga and Frontera13 as well as in compounds R5Si2Ge2 (R = Tb, Gd). Reference Gschneidner, Pecharsky, Pecharsky, Ivtchenko and Levin14,Reference de Oliveira15
Single-phase multiferroic compounds consisting of two or three different ferroic subsystems are suggested now to be considered as multicaloric materials which are the most promising ones to be used as solid-state refrigerants. Reference Mikhaleva, Flerov, Gorev, Molokeev, Cherepakhin, Kartashev, Mikhashenok and Sablina16–Reference Binek and Burobina19 First, the caloric properties of such materials can be improved using simultaneously several external fields. Second, thanks to magnetoelectric, magnetoelastic, or electroelastic coupling, the lifting of distinct or integrated intensive and extensive CE can be controlled by one of three external fields.
Composites involving ferromagnetic and ferroelectric components are also interesting and useful materials to obtain integrated CE. In that case, the interaction between two phases is indirectly generated by mechanical stress appearing under external fields on the boundaries of intimately connected grains or layers.
Recently, we have studied two CE in ferroelectric PbTiO3 – PT (ECE and BCE) Reference Mikhaleva, Flerov, Gorev, Molokeev, Cherepakhin, Kartashev, Mikhashenok and Sablina16 and ferromagnetic La0.7Pb0.3MnO3 – LPM (MCE and BCE) Reference Kartashev, Mikhaleva, Gorev, Bogdanov, Cherepakhin, Sablina, Mikhashonok, Flerov and Volkov20 as well as three CE in volumetric multiferroic composites xLa0.7Pb0.3MnO3–(1 − x)PbTiO3 (x = 0.85; 0.18) (LPM–PT). Reference Mikhaleva, Flerov, Kartashev, Gorev, Cherepakhin, Sablina, Mikhashenok, Volkov and Shabanov21 It was found that ECE at ferroelectric phase transition in LPM–PT at least at low electric fields (<3 kV/cm) increases compared to this effect in pure PT. One more interesting peculiarity was connected with the increase of intensive MCE in composites at phase transition between para- and ferromagnetic phases near 340 K. The difference between ΔT AD values for LPM–PT and LPM was increased in the range of magnetic fields studied. The electric polarization in PT component changes near temperature of ferromagnetic phase transition very slowly with variation in the temperature. Reference Fesenko, Gavrilyachenko and Zarochentsev22 In such a case, in accordance with the equation Reference Vopson17
 $${\mathop{\rm d}\nolimits} T = - {T \over {{C_{p,E,H}}}}\left[ {{{\left( {{{\partial M} \over {\partial T}}} \right)}_{p,E,H}} + {\rm{IMEC}}{{\left( {{{\partial P} \over {\partial T}}} \right)}_{p,E,H}}} \right]{\mathop{\rm d}\nolimits} H\quad {\rm{,}}$$
the contribution from indirect magnetoelectric coupling (IMEC) associated with the (∂P/∂T) E,H polarization derivative to the total ΔT AD value generated by magnetic field is negligible. Taking into account this fact, it was possible to suppose that the additional contribution to the intensive CE ΔT AD in LPM–PT results from BCE under pressure generated by the elastic mechanical interaction between magnetostrictive and piezoelectric phases. Reference Mikhaleva, Flerov, Kartashev, Gorev, Cherepakhin, Sablina, Mikhashenok, Volkov and Shabanov21
In the present work, we prolonged the investigation of the nature of the magnetocaloric efficiency increase in ferromagnetic–ferroelectric material. The study of the temperature and magnetic field dependencies of magnetization was carried out on LPM ceramics and multiferroic 0.85LPM–0.15PT composite. The results were analyzed using Eq. (2) and the magnetic equation of state to compare them with experimental data on intensive MCE and heat capacity obtained by us earlier in direct measurements. Reference Mikhaleva, Flerov, Kartashev, Gorev, Cherepakhin, Sablina, Mikhashenok, Volkov and Shabanov21
II. EXPERIMENTAL
Magnetic measurements under temperature and magnetic field variation were performed on the LPM and LPM–PT samples fabricated by the standard ceramic technology and used in our previous direct studies on the intensive MCE in an adiabatic calorimeter. Reference Mikhaleva, Flerov, Kartashev, Gorev, Cherepakhin, Sablina, Mikhashenok, Volkov and Shabanov21 The LPM component was prepared by grinding of single crystals studied earlier by us. Reference Kartashev, Mikhaleva, Gorev, Bogdanov, Cherepakhin, Sablina, Mikhashonok, Flerov and Volkov20 It was very important because we were able to see the effect of the sample state on the physical properties. The sintering of the samples under study at rather low temperature (800 °C) allowed us to avoid the formation of solid solutions and the interdiffusion processes in composite. The x-ray characterization proved that diffraction peaks observed in composite material correspond to the sum of rhombohedral LPM and tetragonal perovskite PT phases. No foreign phases were found.
Examination of the samples using a scanning electron microscope showed that the largest amount of grains in LPM and LPM–PT ceramics has size below 10 μm. Reference Mikhaleva, Flerov, Kartashev, Gorev, Cherepakhin, Sablina, Mikhashenok, Volkov and Shabanov21 The relative density of both ceramic samples was about 90%.
The magnetization measurements were carried out from 3 to 370 K under fields in the range of 1–15 kOe using a commercial quantum design physical properties measurement system (PPMS).
III. RESULTS AND DISCUSSION
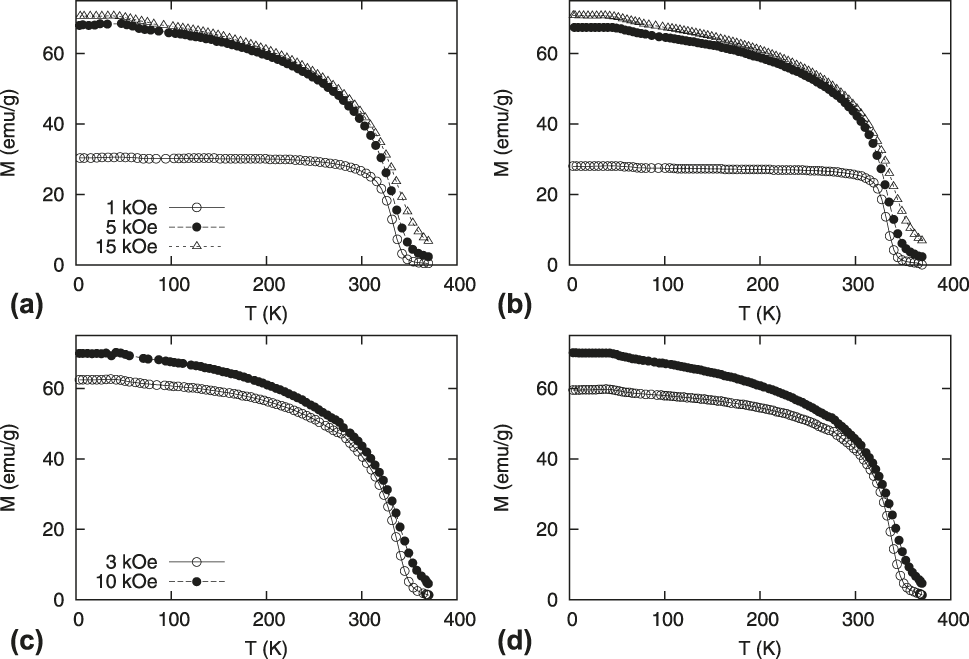
The M(T) data for both samples were collected on cooling (H = 1, 5, 15 kOe) [Figs. 1(a) and 1(b)] and heating (H = 3, 10 kOe) [Figs. 1(c) and 1(d)]. The magnetization of the LPM–PT composite is presented as converted for the pure LPM component. Figure 1 shows that apart from strong increase of magnetization in the region of phase transition, a small step-wise anomaly was detected from the M(T) curves at all fields in the range of 40–70 K. The same low temperature peculiarity of magnetization behavior was also observed in the LPM single crystal as well as in the (La1–y Eu y )0.7Pb0.3MnO3 and La0.55Bi0.15Ca0.3MnO3 solid solutions. Reference Volkov, Petrakovskii, Boeni, Clementyev, Patrin, Sablina, Velikanov and Vasiliev23,Reference Gutiérrez, Fernández, Barandiarán, Orúe and Righi24 However, no anomalous heat capacity behavior was found in a corresponding temperature range. Reference Kartashev, Mikhaleva, Gorev, Bogdanov, Cherepakhin, Sablina, Mikhashonok, Flerov and Volkov20,Reference Gutiérrez, Fernández, Barandiarán, Orúe and Righi24
Temperature dependences of magnetization measured on cooling (a, b) and on heating (c, d) of LPM (a, c) and LPM–PT (b, d).

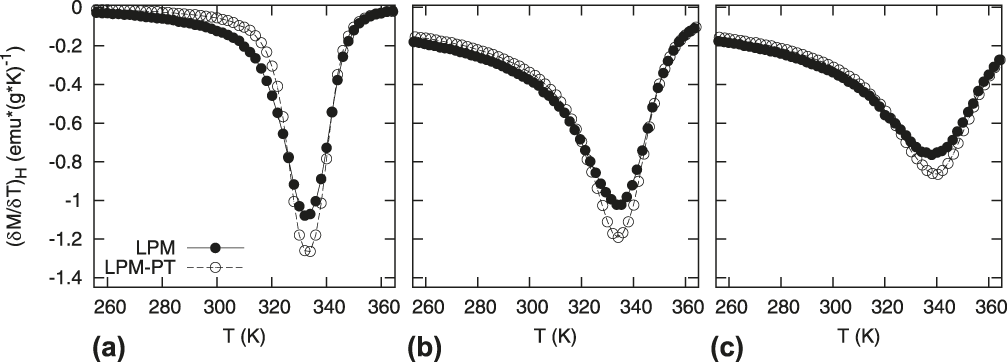
The saturated M value of the LPM–PT composite at H = 1 kOe is slightly less than that of LPM ceramics. This difference decreases with increase in the magnetic field and almost disappears at 5 kOe (Fig. 1). On the other hand, the minimum value of the (∂M/∂T) H derivative for LPM–PT is less than the same parameter for LPM, for instance for H = 1, 5, and 15 kOe, as can be seen in Fig. 2. The faster change in magnetization with temperature in LPM–PT means that the second-order phase transition observed in LPM ceramics Reference Mikhaleva, Flerov, Kartashev, Gorev, Cherepakhin, Sablina, Mikhashenok, Volkov and Shabanov21 is shifted to the tricritical point in composite. It is necessary to point out that the elevating field strength from 1 to 15 kOe, on the one hand, decreases the modulus (∂M/∂T) H values and, on the other, does not change significantly the relationship between these derivatives at the minimum point for LPM–PT and LPM, namely, from 1.18 to 1.13. Hence, the magnetic field does not affect strongly on the closeness of phase transitions to the tricritical point in these materials.
Temperature dependences of (∂M/∂T) H for LPM and LPM–PT at different magnetic fields: 1 kOe (a), 5 kOe (b), and 15 kOe (c).

From our point of view, the reason for the large modulus value of (∂M/∂T) H in LPM–PT compared to LPM is most likely associated with the mechanical stress appearing on the boundary between ferroelectric and magnetic grains in the composite. There are at least two possible sources of pressure generation. They are connected with a magnetostrictive effect in LPM phase and/or with large difference in thermal expansion ΔV/V of LPM and PT components in composite in the phase transition region in LPM. Reference Mikhaleva, Flerov, Gorev, Molokeev, Cherepakhin, Kartashev, Mikhashenok and Sablina16,Reference Kartashev, Mikhaleva, Gorev, Bogdanov, Cherepakhin, Sablina, Mikhashonok, Flerov and Volkov20 Argument in support of the latter hypothesis can be obtained from the comparison of the unit cell volumes of manganites La0.7Pb0.3MnO3 (59.4 Å3) and La0.69Ca0.31MnO3 (54.7 Å3). Reference Volkov, Petrakovskii, Boeni, Clementyev, Patrin, Sablina, Velikanov and Vasiliev23,Reference Sun, Kamarad, Arnold, Kou and Cheng25 The homovalent Ca2+ → Pb2+ substitution is followed by both the chemical pressure increase and the change of the phase transition from the second-order to the first one. One more interesting example of phase transition order change one can see analyzing the results of magnetization measurements in the series of solid solutions La1–x Pb x MnO3 (x = 0.1; 02; 03). Reference Min, Kim, Yu, Suh and Lee26 The heterovalent Pb2+ → La3+ substitution is accompanied by the unit cell volume increase (58.1 Å → 59.4 Å) with an increase in the Pb concentration as well as by the shift of the second-order phase transition to the tricritical point.
The information about volume magnetostriction in manganites was obtained by analysis of the M(H) dependencies at p = 0 and under pressure in related manganites La0.69Ca0.31MnO3 and La0.8Sr0.2MnO3. Reference Sun, Kamarad, Arnold, Kou and Cheng25,Reference Rocco, Silva, Carvalho, Coelho, Andreeta and Gama27 From the expression of the Gibbs free energy,
 $${\mathop{\rm d}\nolimits} \Phi = - S{\mathop{\rm d}\nolimits} T + v{\mathop{\rm d}\nolimits} p - M{\mathop{\rm d}\nolimits} H\quad {\rm{.}}$$
one can obtain differential equation for magnetostriction
 $${\left( {{{\partial v} \mathord{\left/ {\vphantom {{\partial v} {\partial H}}} \right. \kern-\nulldelimiterspace} {\partial H}}} \right)_{p,T}} = - {\left( {{{\partial M} \mathord{\left/ {\vphantom {{\partial M} {\partial p}}} \right. \kern-\nulldelimiterspace} {\partial p}}} \right)_{H,T}}\quad {\rm{.}}$$
Because the phase transition temperature increases under pressure in La0.69Ca0.31MnO3 and La0.8Sr0.2MnO3, Reference Sun, Kamarad, Arnold, Kou and Cheng25,Reference Rocco, Silva, Carvalho, Coelho, Andreeta and Gama27 the (∂M/∂p) H,T derivative is positive and, in accordance with (5), the magnetic field increase is accompanied by the volume decrease. We have found that at ΔH = 30 kOe and Δp = 1.1 GPa, the relative volume change ΔV/V near phase transition point in La0.69Ca0.31MnO3 is less than 4 × 10⁻⁴.
On the other hand, the positive thermal deformation ΔV/V in LPM, determined by us, Reference Kartashev, Mikhaleva, Gorev, Bogdanov, Cherepakhin, Sablina, Mikhashonok, Flerov and Volkov20 is about an order of magnitude higher (∼6 × 10⁻³) in the ferromagnetic phase transition region than in PT component ΔV/V ≈ 10−3. Reference Mikhaleva, Flerov, Gorev, Molokeev, Cherepakhin, Kartashev, Mikhashenok and Sablina16 Large difference in thermal expansion is the reason for the appearance of elastic mechanical interaction between LPM and PT components at temperature change of composite leading to pressure generation. Because composites are inhomogeneous materials, the pressure appeared is most likely to be not hydrostatic. Such a hypothesis is supported by the experimental studies of single-phase manganites, Reference Sun, Kamarad, Arnold, Kou and Cheng25,Reference Rocco, Silva, Carvalho, Coelho, Andreeta and Gama27 where no strong effect of hydrostatic pressure on magnetization behavior in single-phase La0.69Ca0.31MnO3 and La0.8Sr0.2MnO3 compounds was observed.
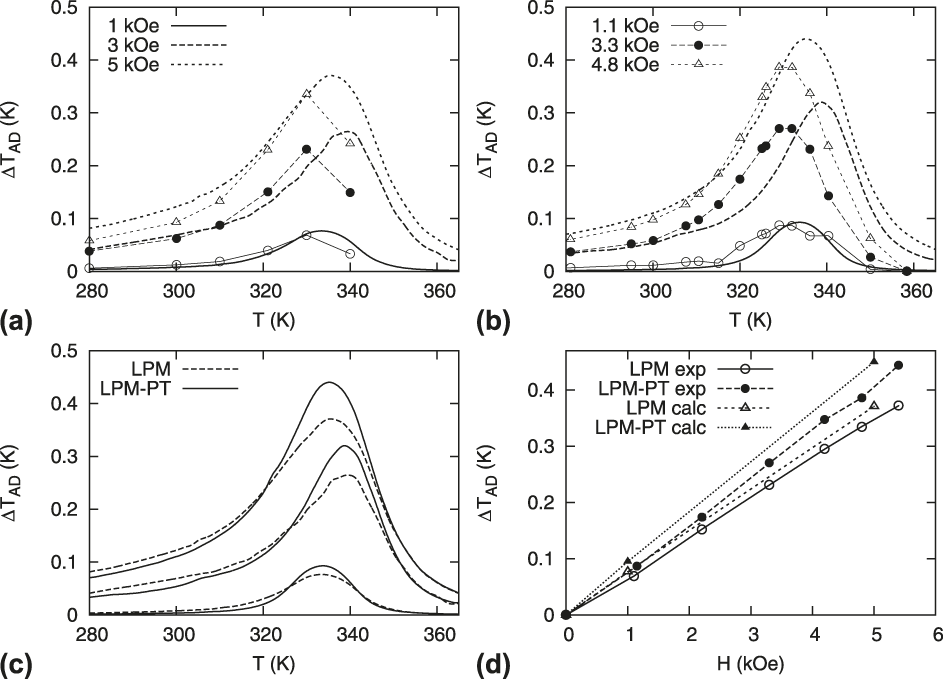
In accordance with (1) and (2), the difference between the (∂M/∂T) H values close to phase transition point in LPM and LPM–PT leads to different MCE in both materials. The information on intensive MCE ΔT AD was obtained by analysis of the M(T) H=const dependences using (2) and the heat capacity data studied experimentally by us earlier. Reference Kartashev, Mikhaleva, Gorev, Bogdanov, Cherepakhin, Sablina, Mikhashonok, Flerov and Volkov20,Reference Mikhaleva, Flerov, Kartashev, Gorev, Cherepakhin, Sablina, Mikhashenok, Volkov and Shabanov21 Figures 3(a) and 3(b) show that the calculated intensive MCE in both materials exceeds ΔT AD values obtained in direct measurements by an adiabatic calorimeter. Reference Mikhaleva, Flerov, Kartashev, Gorev, Cherepakhin, Sablina, Mikhashenok, Volkov and Shabanov21 Taking into account that experimental and calculated ΔT AD were determined at a little bit of different fields, the difference between both ΔT AD values may be considered as the modest one. Moreover, the detailed analysis of different methods of the MCE determination Reference Pecharsky and Gschneidner28 showed that the combined relative error in the MCE values calculated using the M(T,H) data can reach 10%, as it was observed, for example, for La0.55Bi0.15Ca0.3MnO3. Reference Gutiérrez, Fernández, Barandiarán, Orúe and Righi24
Temperature dependences of measured (dots) and calculated (lines) ΔT AD for LPM (a) and LPM–PT (b). Comparison of calculated ΔT AD for LPM and LPM–PT (c). Field dependences of calculated (calc) and measured (exp) ΔT AD max for LPM and LPM–PT (d).

Figure 3(c) shows that calculated intensive MCE in composite exceeds that in pure LPM at all fields studied, as it was found also in direct measurements. With reference to Fig. 3(d), it can be seen that the differences between the maximum values of ΔT AD max calculated as well as measured for LPM and LPM–PT are close to each other. In line with these results, one can think that the pressure generated by elastic mechanical interaction between ferromagnetic and ferroelectric components leads only to the shift of phase transition to the tricritical point. To make sure that this is not the case, we estimated the integrated caloric parameters called as relative cooling power (RCP) Reference Tishin and Spichkin1
 $${\rm{RCP}}(T) = \Delta T_{{\rm{AD}}}^{{\rm{max}}} \times \delta {T_{{\rm{FWHM}}}}\quad {\rm{,}}$$
 $${\rm{RCP}}(S) = - \delta S_{{\rm{CE}}}^{{\rm{max}}} \times \delta {T_{{\rm{FWHM}}}}\quad {\rm{.}}$$
Here, δT FWHM is the full-width at the half maximum of the ΔT AD(T) and ΔS MCE(T) curves.
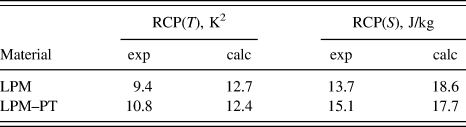
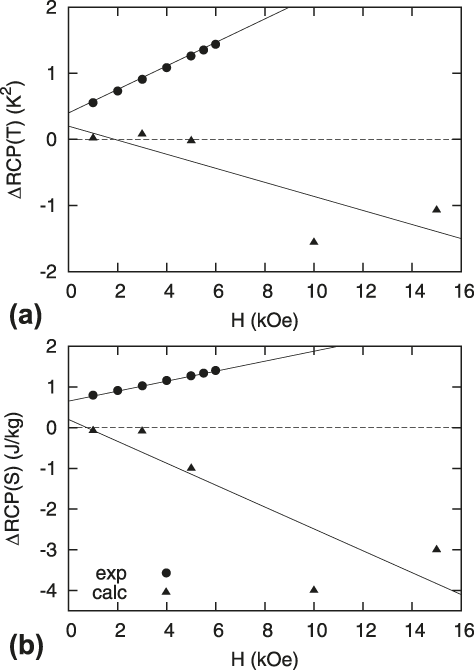
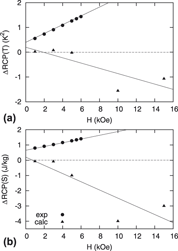
In Table I, the RCP(T) and RCP(S) values determined at H = 5 kOe using experimental data on ΔT AD MCE(T,H) and M(T,H) are presented for LPM and LPM–PT. One can see that both values evaluated by analysis of magnetization (calc) exceed those obtained from experimental intensive MCE (exp). It was also found that “experimental” values of RCP(T) and RCP(S) are higher in composite compared with LPM, whereas for “calculated” values there is opposite situation. Taking into account the discussion on the error of MCE evaluation from magnetization measurements, Reference Pecharsky and Gschneidner28 it is better to consider the field dependence of the difference between RCP values for composite and manganite ΔRCP = RCPLPM−PT − RCPLPM. As seen from Fig. 4, the field increase is followed by decrease of both ΔRCPcalc values obtained from magnetization data. On the other hand, the ΔRCPexp parameters increase with magnetic field, and consequently, pressure increase. We think that this result is a strong evidence of the BCE presence in composite under magnetic field which cannot be detected in M(T,H) measurements. Thus, the total caloric effect in LPM–PT can be considered as the sum of MCE and BCE generated by intrinsic pressure appeared under magnetic field in composite.
Comparison of RCP(T) and RCP(S) for LPM and LPM–PT at H = 5 kOe. exp – data obtained analyzing ΔT AD(H,T); calc – results of M(T,H) analysis.

Field dependences of differences between measured and calculated RCP(T) (a) as well as RCP(S) (b) for LPM–PT and LPM.

We carried out also measurements of ΔT AD using simultaneously magnetic (5 kOe) and electric (2 kV/cm) fields, to make sure that contribution of ECE or piezoelectric effect in PT component initiated by pressure resulted from thermal expansion and magnetostrictive effects discussed above is absent. Experiments were performed in an adiabatic calorimeter. No any detectable difference between the values of ΔT AD(H) and ΔT AD(H,E) was observed.
It is interesting to consider the changes of some peculiar temperatures under magnetic field in composite compared to those in LPM ceramics. Very often, the inflection point in the M–T curve, i.e., the temperature associated with the minimum value of the (∂M/∂T) H derivative, is defined as the magnetic transformation temperature T 0 (Curie temperature). Reference Volkov, Petrakovskii, Boeni, Clementyev, Patrin, Sablina, Velikanov and Vasiliev23,Reference Gutiérrez, Fernández, Barandiarán, Orúe and Righi24 But as seen from (1) and (2), it is true only for temperature associated with the maximum values of extensive and intensive CE. In accordance with the thermodynamic theory, Reference Alexandrov and Flerov29 a more correct T 0 is connected with the minimum value of the (∂M 2/∂T) H derivative. Indeed, the entropy ΔS of the phase transition is proportional to the square of the order parameter (magnetization M in our case), Reference Alexandrov and Flerov29
 $$- \Delta S{\rm{\ }} = \left( {{{\partial A} \mathord{\left/ {\vphantom {{\partial A} {\partial T}}} \right. \kern-\nulldelimiterspace} {\partial T}}} \right){M^2} = {A_T}{M^2}\quad {\rm{,}}$$
where A = A T (T − T 0) is one of the coefficients of thermodynamic potential,
 $$\Phi = {\Phi _0} + \Delta \Phi = A{M^2} + B{M^4} - MH\quad {\rm{.}}$$
So the inflection points of the M 2(T) and the excess entropy associated with the maximum value of the heat capacity are coincided.
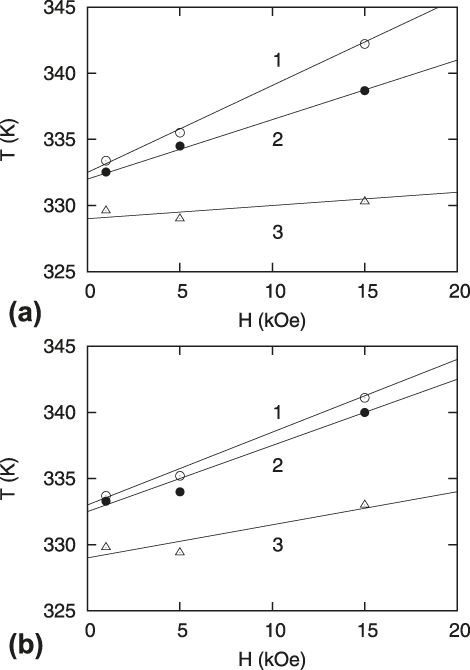
In Fig. 5, the field behavior of two temperatures, considered from different points of view as the phase transition temperatures, and temperature associated with the maximum ΔT
AD
max value for LPM and LPM–PT is presented. The tendency of change in peculiar temperatures is the same for both samples, i.e., all temperatures increase with elevation in the field. The values of
 ${{{{{\mathop{\rm d}\nolimits} T_0^{\left( {{{{\mathop{\rm d}\nolimits} M} \mathord{\left/ {\vphantom {{{\mathop{\rm d}\nolimits} M} {{\mathop{\rm d}\nolimits} T}}} \right. \kern-\nulldelimiterspace} {{\mathop{\rm d}\nolimits} T}}} \right)} }/ \mathord{\left {\vphantom {{{\mathop{\rm d}\nolimits} T_0^{\left( {{{{\mathop{\rm d}\nolimits} M} \mathord{\left/ {\vphantom {{{\mathop{\rm d}\nolimits} M} {{\mathop{\rm d}\nolimits} T}}} \right. \kern-\nulldelimiterspace} {{\mathop{\rm d}\nolimits} T}}} \right)} } {{\mathop{\rm d}\nolimits} H\;{\rm{and}}{\mathop{\rm d}\nolimits} T}}} \right. \kern-\nulldelimiterspace} {{\mathop{\rm d}\nolimits} H\;{\rm{and}}{\mathop{\rm d}\nolimits} T}}^{\left( {\Delta T_{{\rm{AD}}}^{\max } } \right)} } /\mathord{\left {\vphantom {{{{{\mathop{\rm d}\nolimits} T_0^{\left( {{{{\mathop{\rm d}\nolimits} M} \mathord{\left/ {\vphantom {{{\mathop{\rm d}\nolimits} M} {{\mathop{\rm d}\nolimits} T}}} \right. \kern-\nulldelimiterspace} {{\mathop{\rm d}\nolimits} T}}} \right)} } \mathord{\left/ {\vphantom {{{\mathop{\rm d}\nolimits} T_0^{\left( {{{{\mathop{\rm d}\nolimits} M} \mathord{\left/ {\vphantom {{{\mathop{\rm d}\nolimits} M} {{\mathop{\rm d}\nolimits} T}}} \right. \kern-\nulldelimiterspace} {{\mathop{\rm d}\nolimits} T}}} \right)} } {{\mathop{\rm d}\nolimits} H\;{\rm{and}}{\mathop{\rm d}\nolimits} T}}} \right. \kern-\nulldelimiterspace} {{\mathop{\rm d}\nolimits} H\;{\rm{and}}{\mathop{\rm d}\nolimits} T}}^{\left( {\Delta T_{{\rm{AD}}}^{\max } } \right)} } {{\mathop{\rm d}\nolimits} H}}} \right. \kern-\nulldelimiterspace} {{\mathop{\rm d}\nolimits} H}}\left( {{{\rm{K}} \mathord{\left/ {\vphantom {{\rm{K}} {{\rm{kOe}}}}} \right. \kern-\nulldelimiterspace} {{\rm{kOe}}}}} \right)$
are rather close to LPM (0.63 and 0.45) and LPM–PT (0.54 and 0.51). At the same time, the phase transition temperature change in both materials under magnetic field
 ${{{\mathop{\rm d}\nolimits} T_0^{\left( {{{{\mathop{\rm d}\nolimits} M^2 } \mathord{\left/ {\vphantom {{{\mathop{\rm d}\nolimits} M^2 } {{\mathop{\rm d}\nolimits} T}}} \right. \kern-\nulldelimiterspace} {{\mathop{\rm d}\nolimits} T}}} \right)} } /\mathord{\left {\vphantom {{{\mathop{\rm d}\nolimits} T_0^{\left( {{{{\mathop{\rm d}\nolimits} M^2 } \mathord{\left/ {\vphantom {{{\mathop{\rm d}\nolimits} M^2 } {{\mathop{\rm d}\nolimits} T}}} \right. \kern-\nulldelimiterspace} {{\mathop{\rm d}\nolimits} T}}} \right)} } {{\mathop{\rm d}\nolimits} H\left( {{{\rm{K}} \mathord{\left/ {\vphantom {{\rm{K}} {{\rm{kOe}}}}} \right. \kern-\nulldelimiterspace} {{\rm{kOe}}}}} \right)}}} \right. \kern-\nulldelimiterspace} {{\mathop{\rm d}\nolimits} H\left( {{{\rm{K}} \mathord{\left/ {\vphantom {{\rm{K}} {{\rm{kOe}}}}} \right. \kern-\nulldelimiterspace} {{\rm{kOe}}}}} \right)}}$
is characterized by rather strong difference 0.07–LPM and 0.25–LPM–PT. From our point of view, the
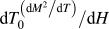 ${{{\mathop{\rm d}\nolimits} T_0^{\left( {{{{\mathop{\rm d}\nolimits} M^2 } \mathord{\left/ {\vphantom {{{\mathop{\rm d}\nolimits} M^2 } {{\mathop{\rm d}\nolimits} T}}} \right. \kern-\nulldelimiterspace} {{\mathop{\rm d}\nolimits} T}}} \right)} } /\mathord{\left {\vphantom {{{\mathop{\rm d}\nolimits} T_0^{\left( {{{{\mathop{\rm d}\nolimits} M^2 } \mathord{\left/ {\vphantom {{{\mathop{\rm d}\nolimits} M^2 } {{\mathop{\rm d}\nolimits} T}}} \right. \kern-\nulldelimiterspace} {{\mathop{\rm d}\nolimits} T}}} \right)} } {{\mathop{\rm d}\nolimits} H}}} \right. \kern-\nulldelimiterspace} {{\mathop{\rm d}\nolimits} H}}$
value in composite can be considered as the sum of the real T
0 shift under magnetic field characteristic for LPM and additional shift under pressure discussed above.
Field dependences of peculiar temperatures for LPM (a) and LPM–PT (b). 1 – Temperature of the maximum value of ΔT AD max; 2, 3 – Temperatures of the minimum values of (∂M/∂T) H and (∂M 2/∂T) H , respectively.

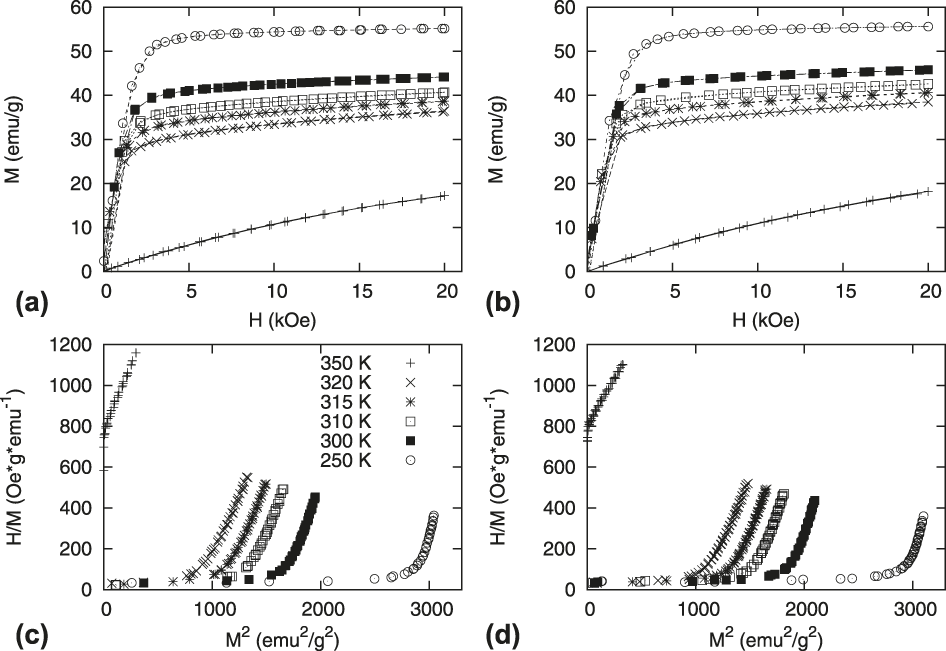
Isothermal M–H curves were measured at various temperatures in the vicinity of ferromagnetic phase transition in LPM and LPM–PT [Figs. 6(a) and 6(b)]. On the ground of these data and using (2), we evaluated ΔT AD values in materials under study. A good agreement was found between the intensive MCE obtained from the analysis of M(T) H=const and M(H) T=const dependences.
Field dependences of isothermal magnetization at different temperatures for LPM (a) and LPM–PT (b). H/M versus M 2 curves of isotherms for LPM (c) and LPM–PT (d).

The M(H) data were also analyzed in the framework of magnetic equation of state obtained from (9) at the equilibrium condition ∂Φ/∂M = 0
 $${H \mathord{\left/ {\vphantom {H M}} \right. \kern-\nulldelimiterspace} M} = 2A + 4B{M^2}\quad {\rm{.}}$$
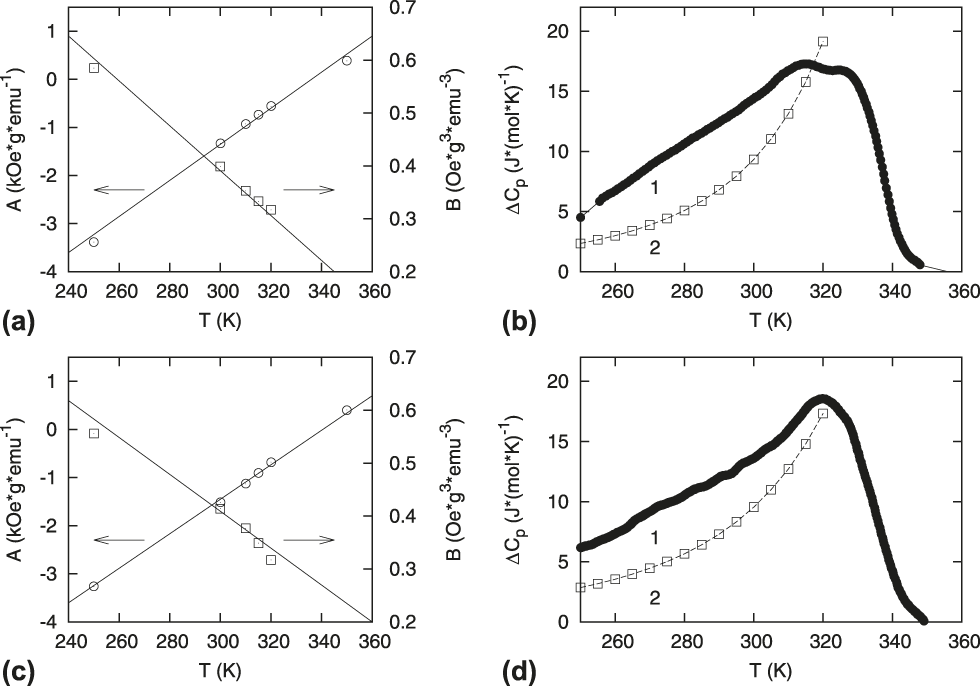
A positive slope of the H/M versus M 2 curves in the complete M 2 range [Figs. 6(c) and 6(d)] coincides with a second-order phase transition in both LPM and LPM–PT. The H/M(M 2) dependencies for LPM and LPM–PT are linear. The linear parts of these curves were fitted with a linear least-squares program. This allowed us to determine the temperature behavior of the A and B coefficients in (10). As seen from Figs. 7(a) and 7(c), both parameters depend on temperature almost linearly. Thus, the A T coefficient (erg cm−3 K−1) is really constant in accordance with the thermodynamic theory Reference Pecharsky and Gschneidner28 and is equal to 38.2 (LPM) and 36.8 (LPM–PT). On the other hand, the B coefficient changes below a phase transition point rather strong and can be presented as a linear function of temperature B = B T (T − T*) with B T (erg g cm−6 K−1) equal to −3.9 × 10⁻³ and −3.2 × 10⁻³ for LPM and LPM–PT, respectively. The T* temperature, where B = 0, is 402 K for LPM and 423 K for LPM–PT. The difference in B T values for composite and LPM ceramics is connected with different closeness of phase transition to the tricritical point discussed above.
A and B coefficients versus temperature for LPM (a) and LPM–PT (c). Temperature behavior of excess heat capacity for LPM (b) and LPM–PT (d) measured (1) and calculated (2) using Eq. (12).

Information on the temperature of the second-order phase transition can be obtained from the condition A T (T − T 0) = 0. The T 0 values for both LPM and LPM–PT were found to be equal to 336.2 and 338.7 K, respectively. On the one hand, these temperatures are higher than peculiar temperatures considered above (Fig. 5). On the other, they coincide rather well with temperatures of the maximum values of derivative (dΔC p /dT): 337.9 ± 1.5 K (LPM) and 337.5 ± 1.5 K (LPM–PT). The latter temperatures can be considered as the temperatures of the heat capacity jump smeared in ceramic samples.
Expressions for excess entropy as well as heat capacity can be obtained by analysis of thermodynamic potential (9) with two temperature-dependent coefficients, A and B
 $$- \Delta S = {A_T}{M^2} + {B_T}{M^4}\quad {\rm{,}}$$
 $$\Delta {C_p} = - T\left( {{{A_T^2} \mathord{\left/ {\vphantom {{A_T^2} {2{B_T}}}} \right. \kern-\nulldelimiterspace} {2{B_T}}}} \right)\left[ {{{{{\left( {{T^*} - {T_0}} \right)}^2}} \mathord{\left/ {\vphantom {{{{\left( {{T^*} - {T_0}} \right)}^2}} {{{\left( {T - {T^*}} \right)}^3}}}} \right. \kern-\nulldelimiterspace} {{{\left( {T - {T^*}} \right)}^3}}}} \right]\quad {\rm{.}}$$
Figures 7(b) and 7(d) demonstrate that the ΔC p value is strongly temperature dependent and in ferromagnetic phase is lower compared to the value determined from experimental data on C p (T). The different behavior of experimental and calculated excess heat capacity is not strange and can be explained taking into account that Eqs. (11) and (12) are valid for single crystals and calorimetric experiments were performed on ceramic samples. As it was discussed above, phase transitions in ceramic materials are smeared.
IV. CONCLUSION
The study of the temperature and magnetic field dependencies of magnetization was carried out on LPM ceramics and 0.85LPM–0.15PT composite.
It was found that the second-order transformation between para- and ferromagnetic phases in LPM shifts to the tricritical point in LPM–PT composite which leads to the increase of intensive CE. Such an effect and the results of comparison of the RCP at this phase transition determined from the data obtained by the direct and indirect measurements allow us to suppose the important role of intrinsic pressure in composite resulted from elastic interaction between grains of LPM and PT components. Simultaneous measurements on composite under magnetic and electric fields did not show any additional temperature change associated with ECE or IMEC.
The magnetic equation of state was analyzed to determine the coefficients of the thermodynamic potential. A good agreement between the calculated and experimentally measured Reference Mikhaleva, Flerov, Kartashev, Gorev, Cherepakhin, Sablina, Mikhashenok, Volkov and Shabanov21 anomalous heat capacity was found.
The investigations performed show that volumetric ferroelectric–ferromagnetic composites can be considered as multiferroic materials promising not only to realize multicaloric effects but also to produce additional temperature (or entropy) change because of intrinsic pressure.
ACKNOWLEDGMENT
This work was supported by Council on Grants from the President of the Russian Federation for Support of Leading Scientific Schools (Grant No. NSh-924.2014.2).