INTRODUCTION
Landscape degradation is a ubiquitous process resulting from the gradual downslope mobilization of surficial regolith. The rate of the downwasting depends on a variety of local biotic and abiotic factors (Perron, Reference Perron2017). Research into fundamental expressions of the process have often relied on a single constant, topographic diffusivity (K), coupled with the local slope to account for all the active factors in a given region (Tucker and Hancock, Reference Tucker and Hancock2010). K is often assumed to be a constant over long or undefined time scales. Yet local factors are known to exert temporal variability on the rates of surface processes.
To assess where temporal variations in rates of surface processes might occur, expanded analyses of landscape degradation with consistent coverage across the globe and temporally back in time are needed. To do this, we reasoned that climate plays a large part in the amalgamated factors that make up the topographic diffusivity. In addition, the climate or, more specifically, the air temperature, is available both across the globe and through a global climate model for the past 21 ka. It is also well documented that the global climate has fluctuated, most distinctly, during glacial to interglacial transitions. Therefore, to compare global variations of temporally variable degradation, we generate a correlative relationship between a current global data set of diffusivities and temporally variable air temperatures from a global paleoclimate model, a transient global climate model (GCM) that produced time-slices from the Last Glacial Maximum (LGM) to the present. The correlative relationship was applied as a transfer function through globally gridded paleoclimate temperature data to model past diffusivities since the LGM for all the land areas at 500 yr temporal resolution. This approach allows regional variations in diffusivity to be determined. Such assessments are used to address questions of where on the globe the time-varying diffusivities might better reveal the true degradation through time rather than assuming that the diffusivity has been constant through time.
Sediment mobility, expressed as topographic diffusivity (K), has received a number of treatments, summarized in recent years (Oehm and Hallet, Reference Oehm and Hallet2005; Richardson et al., Reference Richardson, Perron and Schurr2019). Conventional approaches have derived K from morphological modeling of landforms of known age (Hanks, Reference Hanks, Noller, Sowers and Lettis2000) and have assumed that K captures any effect of climate that would distinguish sediment flux between landforms of similar slopes. However, indeterminacy in basic metrics for quantifying diffusivity (Martin, Reference Martin2000) has resulted, in part, from published comparisons of K that vary in temporal or spatial scales, measurement techniques of sediment flux, or modeling optimization techniques that quantify K. The result is that little is understood of how climate relates to erosion, if at all, or at what scale. Until there is a way to compare mobility of landform surfaces on a global scale where climate is known to vary in the present and in the past, the scale of variability remains unknown. A framework of known scale and past changes in climate would assist in knowing how to associate varying occurrences of climate change in the present based on the past fluctuations with correlating land-surface responses. The present study develops and applies a novel approach to comparing global variability of climate and erosion in order to develop such a framework.
Erosion rates, in general, are used for modeling landform degradation and, cumulatively, landscape evolution. They are also used in exposure dating of ancient surfaces that may have since been buried. The location of sedimentary records that archive the changes in the landscape can affect their efficacy for chronicling past processes and events (Hallet and Putkonen, Reference Hallet and Putkonen1994; Putkonen and Swanson, Reference Putkonen and Swanson2003; O'Neal, Reference O'Neal2006; Putkonen and O'Neal, Reference Putkonen and O'Neal2006; Putkonen et al., Reference Putkonen, Connolly and Orloff2008). Scientific applications also abound, because knowledge of how climate affects mobility of unconsolidated sediment is used to address the response of soil carbon budgets to climate change or mitigation of land degradation through agricultural practices (Lal, Reference Lal2004). Having a basis for comparing landscapes globally would fill gaps between local occurrences of climate and the synchronicity of responses by Earth's surface under global climate change. Such a basis would expand the kinds of questions that could be asked about time scales and extremes of climate and climate change and the global effects on fundamental Earth surface processes. However, attempts to isolate climate system components for use as climate parameters to couple with measures of degradation in the landscape have been inconclusive, as they too have been constrained by locations selected by previous studies.
Basic assumptions about controlling factors of hillslope change are used to formulate governing equations to predict topographic change through time. Topographic diffusivity (K) and changes in slope at the basin scale provide the structure to test the validity of governing law expressions for diffusion applied to hillslopes. The diffusion equation was originally formulated to apply theories of material flow, relevant for heat conduction or plastic flow, as analogies for the decrease in hillslope gradient in landscapes (Culling, Reference Culling1960). As a metric that is coupled with slope to quantify the slow gradual degradation of topography in the landscape, K is used to express the added propensity of material mobility. This propensity, in the case of a landscape, typically is considered to be the effect of surrounding climate on soil-mantled hillslopes, but it has yet to be defined conclusively in terms of climate for all landscapes. In the approach presented here, we do not attempt to explain the observations of global diffusivities by derivation from the conventional mathematical expression from heat diffusion. Instead we start with measures representative of landform mobility that reflect basic diffusion and assume that measures will have a physical explanation whose complexities have not been captured in a mathematical expression.
A simple linear sediment transport law is the core component used in constructing the diffusion expression, and water is commonly understood as the primary transport agent of unconsolidated sediment (Pruski and Nearing, Reference Pruski and Nearing2002). Precipitation, then, is typically assumed as the climatic signal in the landscape, in addition to slope, with steeper slopes mobilizing more material. Therefore, rates of rainfall define precipitation as the transport driver, and a causal relationship is established between climate and erosion. From this framework, changes in precipitation over time are expected to coincide with topographic smoothing and erosion involving bedrock weathering (Owen et al., Reference Owen, Amundson, Dietrich, Nishiizumi, Sutter and Chong2011). This framework generally includes a mountain-building time scale (Molnar and England, Reference Molnar and England1990; Willett et al., Reference Willett, Slingerland and Hovius2001; Reiners et al., Reference Reiners, Ehlers, Mitchell and Montgomery2003; Willenbring and Von Blanckenburg, Reference Willenbring and Von Blanckenburg2010; Portenga and Bierman, Reference Portenga and Bierman2011; Perron, Reference Perron2017; Richardson et al., Reference Richardson, Perron and Schurr2019). However, environments on Earth where rainfall is a direct control on erosion are not representative of all degradation in landscapes on Earth's surface or even of all types of degradation within those environments (Brown et al., Reference Brown, Brinkman, Bolton, Brown, Cold, Hollingsworth and Verbyla2020). Depending on the environment, a number of displacement factors from surface to depth can affect the degree to which slope predominates on the gravity-driven downslope movement (Heimsath et al., Reference Heimsath, Chappell, Spooner and Questiaux2002). Regional climate further affects those factors through biotic and abiotic processes (Oehm and Hallet, Reference Oehm and Hallet2005). Given the complexities in sediment dispersal and the effects of a complex climate system, knowledge gaps persist between the physical transport processes themselves and expected outcomes intended for use in modeling landform change through time.
Earth system regimes, other than rainfall intersecting steep slopes in drainage basins (Roering et al., Reference Roering, Kirchner and Dietrich1999), may exhibit hillslope degradation by other means. Hillslope degradation also may be occurring by processes other than at the scale associated with bedrock weathering and denudation conventionally assumed by landscape evolution models to predict topographic diffusivity. Soil mobility, such as exhibited by soil creep—slow gravity-driven hillslope degradation—is ubiquitous. It therefore provides another means of comparing sediment mobility in different regions and may thus provide the basis for a framework to generalize hillslope diffusion for all landscapes and for relative comparisons of diffusivity in different climates.
While gaps and uncertainties in how K might vary through time and space have been known and discussed since early in its usage (Culling, Reference Culling1965; Hanks, Reference Hanks, Noller, Sowers and Lettis2000), little progress has been made in considering potential cases in which past changes in global climate would have led to regional responses in hillslope processes and contributed to time-varying diffusion of the hillslope profile. The present study adopts a novel approach by employing a numeric description based on empirically derived data from study sites around the globe. The topographic change is targeted and isolated and defined in terms of an actual physical process, soil creep, globally ubiquitous and most like the paradigm of hillslope diffusion. Then the assigned values are related to air temperature from global climate data. Temperature is considered a benchmark for the climate system. As such, temperature can be used as a climate proxy for the past climate system at a given location. Such a metric is intended to be used as a basis for forming relative first-order spatial comparisons of where and how global climate fluctuations, past to present, are associated with corresponding changes in diffusivity.
To implement this novel framework, a global paleoclimate model and modern reanalysis climate data were employed. However, while precipitation conventionally has been assumed as a primary agent in sediment transport, precipitation records are problematic to implement in generating climate metrics that change through time globally for the following reasons: (1) they are limited to the instrumental record; (2) they have large spatial heterogeneity and (3) higher uncertainty than temperature records; and (4) mechanisms producing precipitation are not assimilated in climate models, as temperature has higher fidelity and is better representative of changes in Earth's energy budget. In fact, temperature is used as a benchmark in global climate modeling, as it relates to all other changes in the climate system, and so it is reflective of global climate changes (Legates, Reference Legates2014; Zhu et al., Reference Zhu, Emile-Geay, McKay, Hakim, Khider, Ault, Steig, Dee and Kirchner2019; Valler et al., Reference Valler, Brugnara and Bronnimann2020). This coincides with what is understood about the climate system, whose components, such as land, vegetation, ice, ocean, and atmosphere, interact and are changed by radiative forcing as a major driver (Ruddiman, Reference Ruddiman2014). In certain climates, precipitation by way of rainfall, runoff, and drainage may be a major agent interacting with the surface, while in others, snow, ice, or their melt may play more significant roles in surface mobility. The case of soil creep has been viewed in the history of geomorphology as a unique endmember that results in diffusion, in that the conditions of external forcing coincide with sediment mobility, rather than as a consequence of a transport mechanism (e.g., rockfall), which would occupy the other end of a diffusion spectrum (Culling, Reference Culling1965).Therefore, associating air temperature generated by a global paleoclimate model (which is based on the assumptions of a climate system framework) and diffusivity (from global soil creep measures) is justified, because each is modeled from or based on physical or proxy data and an accepted global climate framework. For these reasons, using data from a single diffusive process demonstrated by soil creep to compare regions globally and most directly best simulates the diffusion equation as it is being used to express the effect of climate, thus reducing the uncertainty that might be introduced by comparing results derived from data representing a variety of processes regionally unique in their responses to climate (such as glacial, fluvial, or eolian processes) and from a variety of techniques used to quantify sediment flux and diffusivity.
We associated a published data set of globally distributed current diffusivities based on soil creep with air temperatures from gridded mean annual air temperature (MAAT) given by reanalysis climate data related to site locations and generated a numerical relation. The numerical relation was then transferred through the past 21 ka using the air temperature data derived from the TraCE-21ka paleoclimate model (Collins et al., Reference Collins, Blitz, Blackmon, Bonan, Bretherton, Carton and Chang2006; He, Reference He2011). Substituting past temperatures, given by this GCM, for present temperatures, in the temperature and diffusivity model, a new global data set was generated that could be used to assess changing climate through time and associated changes in diffusivity. The present approach integrates variability through time based on 500 yr resolution climate data that drive the erosion. The results of the numerical relation, used as a transfer function, are mapped globally with spatial resolution of 3.70° latitude by 3.75° longitude and temporally with 500 yr resolution. Each spatiotemporal pixel has a diffusivity associated with local changes in climate, defined by air temperature. Comparisons with age–depth curves from published sediment cores of neighboring sedimentary sinks or offshore marine locations were used to validate the trends our maps display.
The transfer function in this study provides a means, based on empirical data and temperature data from a paleo-global climate model, to vary the climate parameter in the basic sediment transport law used in hillslope diffusion modeling. Use of time-varying diffusivities and geographic coordinates from the regions where soil creep was measured provides relative estimates of where the past climate change could have significantly impacted the regolith mobility in landscapes. The utility of such first-order estimates of diffusivity and their change through time is in illuminating regional-scale variations in erosion rates driven by global climate change. This novel approach is useful, for example, in assessing where significant differences may result between the use of a long-term average erosion rate and time-varying ones in local landscape evolution models.
METHODOLOGY AND DATA
The objective of this study is to compare and quantify the relationship between climate and diffusivity on the global scale, following a similar approach that was applied for a single location using a glacial chronology and a published climate proxy (Madoff and Putkonen, Reference Madoff and Putkonen2016). A sediment transport law was used as the basis for relating erosion with climate:

where q (m2/yr), sediment flux, is a function of Κ (m2/yr), topographic diffusion, a variable referring to the mobility of regolith or soil, which expresses the combined effect of all degradation processes on a hillslope surface that result in topographic loss or a gradual smoothing of landscapes over long time scales, and slope (dy/dx), change in elevation over change in horizontal distance. The present study relates topographic diffusivity with regional air temperature, a data product from TraCE-21ka, employed here as a climate proxy on a global scale since the LGM.
Conventionally, Κ is defined as topographic diffusivity in a hillslope diffusion model. In such a model, K expresses mobility (Culling, Reference Culling1960) or the cumulative effects of environmental factors on a hillslope that are independent of slope and is treated as a constant (Culling, Reference Culling1965; Hanks, Reference Hanks, Noller, Sowers and Lettis2000; Simpson and Schlunegger, Reference Simpson and Schlunegger2003; Skianis et al., Reference Skianis, Vaiopoulos and Evelpidou2008). The coefficient has been used for optimization in hillslope degradation modeling and, in a landscape context, is assumed to relate to regional climate (Hanks et al., Reference Hanks, Bucknam, Lajoie and Wallace1984; Nash, Reference Nash1984; Pierce and Colman, Reference Pierce and Colman1986; Hallet and Putkonen, Reference Hallet and Putkonen1994; Hanks, Reference Hanks, Noller, Sowers and Lettis2000). As such, it typically is used to represent a long-term average rate, as it has been assumed that within a constant climate, it is the slope of a landform that would distinguish its degradation rates from other hillslopes. Therefore, the coefficient is treated as a constant. Although the uncertainty of the constancy of K through time is often acknowledged (Fernandes and Dietrich, Reference Fernandes and Dietrich1997; Hanks, Reference Hanks, Noller, Sowers and Lettis2000), little progress has been made to test the potential contributions of time-varying conditions of topographic diffusivity in modeling morphological change of hillslopes. Because slope has been considered the primary time-dependent variable in hillslope degradation modeling, the role of Κ as a variable expressing, among other things, the climate, has received less attention. Therefore, it is still unclear how the erosion of land surfaces has varied through time since the LGM, a time of known global shifts in climate. The present study aims to map the regional diffusivities on all land areas through the past 21 ka based on published field-derived measures and associated air temperatures. The objective is to assess regional differences in diffusivities based on changes in climate since the LGM.
We strive to address the question of how much past changes in climate might be associated with changes in diffusivity that varies from a long-term average. This is achieved through tracking the changes in rates through time of the sediment flux of a reference transport-limited landform. The reference slopes are kept constant through time and across space in order to constrain results on the climatic factor and compare those results spatially. Also, because the focus is on connecting past climate with sediment flux, we are not modeling actual sloping landforms or their morphological change through time. Therefore, we define q as a function of temperature while keeping the slope constant. Finally, we spatially compare and contrast on a global scale the results of the temperature and diffusivity relationship and map the post-LGM climate change of the difference between the minimum and maximum diffusivities through the same time and also map how present rates compare with long-term regional averages.
Data
Transfer function
The global compilation of soil creep studies is based on 115 measures located through 13 field sites distributed from the tropics to the poles. Measures were subsequently converted to diffusivities by Oehm and Hallet (Reference Oehm and Hallet2005), and these were used as the spatially distributed data for this study. “Soil creep” here refers to the basic process of the slow gravity-driven downslope movement of unconsolidated material mantling hillslopes that is responsible for the general degradation of hillslopes on long time scales, for example, thousands to hundreds of thousands of years (Nash, Reference Nash1984; Selby, Reference Selby1993; Oehm and Hallet, Reference Oehm and Hallet2005). We relied on the published compilation to construct an empirical relationship between diffusivity and regional climate. In this context, “erosion” refers to the long-term result of the process of soil creep.
The current local air temperatures of these field sites were taken from a gridded reanalysis climate product (Willmott and Matsuura, Reference Willmott and Matsuura2001) that gives global long-term monthly mean air temperatures from 1981 to 2010. The mathematical relationship, that is, the transfer function, relates the topographic diffusivities to local mean temperatures (Fig. 1) and is expressed as

where a nonlinear function defines K as the best-fit curve relating diffusivity to T, air temperature.
Transfer function curve is shown and derived from globally distributed observations of diffusivities based on soil creep measures (Oehm and Hallet, Reference Oehm and Hallet2005) and averaged within climate ranges falling within Köppen climate classifications of latitude. Best-fit curve (Eq. 2) defining the topographic diffusivity (K) as a function of temperature (T) is shown. Standard deviations for diffusivities and temperatures are given for each point. Standard errors, illustrated by transparent blue rectangles around the average for the region, are well within the 1-sigma curves. Data from Richardson et al. (Reference Richardson, Perron and Schurr2019), compiling diffusion-like data, were added to the figure as open circles. They conform well to subtropical (ST) and midlatitude (ML) regions and were not included in the calculation.

The global soil creep data were compiled from previously published research done in areas ranging from the tropics to polar regions. The number of measurements at each field site in each region varied, as the data from each region were published as independent soil creep studies. However, in the present study, we grouped regions with similar temperatures using the Köppen climate classification and averaged diffusivities within each regrouping. Because the classification defines climate zones by ranges in temperatures dependent on Earth's energy budget (Zhu et al., Reference Zhu, Emile-Geay, McKay, Hakim, Khider, Ault, Steig, Dee and Kirchner2019), the groupings only simplified temperature ranges already present at study sites. In the regrouping, the number of sample sites (in parentheses) for each group increased from the number in the original site locations: tropics (7), midlatitudes (20), subarctic (65), and Arctic (13). The resulting transfer function curve (2) has a good correlation, with an R 2 of 0.91, and is similar to the trend generated from plotting the individual sites. Standard deviations were calculated for both temperatures and diffusivities. Standard errors were calculated for the diffusivities and were based on the number of sample sites in the climate regroupings (Fig. 1). The standard errors were significantly less than 1-sigma of the curve.
We overlay a recent compilation of diffusion-like parameters given in Richardson et al. (Reference Richardson, Perron and Schurr2019), whose field areas were limited to midlatitudes and subtropics, to the best-fit curve generated from the Oehm and Hallet (Reference Oehm and Hallet2005) data set. The overlaid data show locations relative to the data used to calculate the curve. The decision to rely solely on the Oehm and Hallet (Reference Oehm and Hallet2005) data to generate the transfer function was based on the authors’ use of field studies that included soil depth profiles and their integration with depth for the sediment flux calculations, from which diffusivities were based. The approach also provided a means for consideration and direct comparison of soil creep with shallow subsurface processes and climate zones. The diffusivities calculated by Richardson et al. (Reference Richardson, Perron and Schurr2019), instead, were based on assessments of surface transport efficiency and precipitation. That work also used a variety of techniques to calculate the diffusion parameter, the selection of which depended on lithology, time scale, or modeling optimization. Discussions in Oehm and Hallet (Reference Oehm and Hallet2005) addressed the wide range of diffusivities resulting from various modeling approaches—small-scale scarp studies (Hanks et al., Reference Hanks, Bucknam, Lajoie and Wallace1984) to large mountain-scale studies (Willett et al., Reference Willett, Slingerland and Hovius2001)—whereby scale affected the magnitude of diffusivity. In the approach used by Oehm and Hallet (Reference Oehm and Hallet2005), the highest diffusivities were found in the coldest climates. The approach also revealed a correlation between climate and depth of activation, with disturbance events extending deeper in cold climates than temperate ones. Given the contrast in objectives between the two studies and uncertainty in whether diffusivities arrived at could be compared, and because the focus of the present study was in the correlation of global climate change with diffusivity, similar to the aims of Oehm and Hallet (Reference Oehm and Hallet2005), the diffusivity data from Richardson et al. (Reference Richardson, Perron and Schurr2019) were not included in the calculation of the transfer function. While the overlaid data would have affected the final transfer function only minimally (Fig. 1), it was uncertain whether they were representing the process in the same way, as they were based on measures of diffusion-like mobility arrived at differently than the targeted data set. Data points from Antarctica field sites were plotted separately, as they are in a region still covered by an ice sheet where the rates and soil processes are not comparable to current soil creep rates in regions where the ice sheet had receded (Hallet et al., Reference Hallet, Putkonen, Sletten, Potter, Gillespie, Porter and Atwater2004).
GCM temperature time-slice maps
Past temperature data are derived from TraCE-21ka, a transient simulation of the Community Climate System Model 3 (CCSM3), a GCM that couples atmosphere–ocean–sea and land–ice for the past 21 ka through 1990 AD and permits examination of feedbacks between climate and land (Collins et al., Reference Collins, Blitz, Blackmon, Bonan, Bretherton, Carton and Chang2006; Otto-Bliesner et al., Reference Otto-Bliesner, Brady, Clauzet, Tomas, Levis and Kothavala2006; Yeager et al., Reference Yeager, Shields, Large and Hack2006). The time blocks generated from TraCE-21ka, therefore, represent the climate system since the LGM. The model generates numerous data sets representing conditions within the time blocks. One of the data sets, given in the TREFHT file generated from TraCE-21ka, shows mean monthly air temperatures at 2 m height above the land surface. Because the model incorporates an ice-sheet model (Peltier, Reference Peltier2004), only exposed land surfaces are accounted for through time in our calculations. For the purposes of this study, coordinates from the ice-sheet model were used to block out land areas covered by ice, and time intervals were selected to optimize the resolutions of the two models. To do this, we averaged the monthly temperatures into time blocks that averaged 500 yr for the past 21 ka. The spatial resolution of the model grid was based on the climate model, which is 3.70° latitude and 3.75° longitude. Time blocks were generated as matrices in MATLAB and were used to generate global maps, also with MATLAB.
Ice-sheet model
During the past 21 ka, the global climate has undergone a period from a maximum glacial to an interglacial and, therefore, in the past much larger areas were covered by continental ice sheets and alpine glaciers than today. We applied a time-dependent ice-sheet mask to those locations in our global grid that would have been covered by ice at a given time. The ice sheet was based on the ice-sheet model ICE 5-G (Peltier, Reference Peltier2004), which had been employed in the development of TraCE-21ka (He, Reference He2011) to locate ice-sheet margins. In addition to varying climate, the varying extent of an ice sheet or glacier affects the times when subaerial erosion starts in the grid cells of the time slices. The ice mask was given in gridded files of 500 yr time steps that we matched to interval times in the climate model time blocks. Because we were only interested in ice-free land areas, we used the ice mask to indicate whether or not the ground surface was exposed or covered by ice for the given location and time period. The areas containing the ice sheet were not included in the calculations to generate time-dependent diffusivity maps.
Land surfaces and shallow hydrology also have been shown to have varied in response and timing to ice-sheet retreat (Milner et al., Reference Milner, Khamis, Battin, Brittain, Barrand, Füreder and Cauvy-Fraunié2017; Flowers, Reference Flowers2018; Bradwell et al., Reference Bradwell, Small, Fabel, Smedley, Clark, Saher and Louise Callard2019). While hydrological processes resulting from glacier melt, such as meltwater streams, can enhance soil mobility, others, such as the formation of lakes from flooding, may have occupied areas as well. These areas were not masked, because, even though they are assumed to have been common, their occurrence also has been reported to be highly variable over relatively small spatial scales and short temporal scales (Beierle et al., Reference Beierle, Smith and Hills2003; Lewis and Teller, Reference Lewis and Teller2007; Wiedmer et al., Reference Wiedmer, Montgomery, Gillespie and Greenberg2010; MacGregor et al., Reference MacGregor, Riihimaki, Myrbo, Shapley and Jankowski2011; Stansell et al., Reference Stansell, Rodbell, Abbott and Mark2013). An assessment of these smaller-scale processes was beyond the scope of this study.
Space-for-time substitution
Time-slice maps, similar to the products of the CLIMAP Project (McIntyre et al., Reference McIntyre, Moore, Andersen, Balsam, Bé, Brunner and Cooley1976), are generated and used in this study to calculate sediment flux from the transfer function based on air temperature as an independent variable and diffusivity as a dependent variable. However, the relationship is not intended to be causal in this case. To implement the transfer function for the intended purpose, we substituted globally gridded air temperatures derived from TraCE-21ka, a transient paleoclimate model, for the temperature variable in the transfer function. The function described earlier, therefore, transferred the correlative relationship between temperature and diffusivities back through time for 21 ka to derive paleo-diffusivities for each ice-free map pixel. For the purpose of this study, the approach provided a spatially consistent way to quantify the relationship between climate and erosion expressed as diffusivity. Each map is based on a 3D matrix (two spatial dimensions and one temporal dimension) to quantify how the erosion changed through time spatially. The resulting matrices are used to compare regional variations in diffusivity with spatial resolution of 3.70° latitude by 3.75° longitude.
The gridded geographic space represents estimates that cannot reflect actual sediment flux rates, because the function was based on a constant hillslope that does not correspond to any specific landform in the mapped areas. Therefore the estimates reflect relative sediment fluxes given the relation between diffusivity and temperature only. We do not theorize about the mechanisms tying together temperature with mobility in this study. However, temperature has been considered a fundamental soil-forming factor tying climate to factors that influence soil mobility and stability (Birkeland, Reference Birkeland1999) and climate change to variable soil responses, depending on regional climate (Bull, Reference Bull1991). We simply correlate regolith mobility in a broad sense with air temperature, already used as a benchmark for the climate system by the climate model, and assume that co-occurring factors as a result of a climate system allow consideration of soil mobility in a given region. In this framework, transport rates are correlated with corresponding changes in climate at a 500 yr time scale for 21 ka.
Spatiotemporal analyses
More than 40 global data grids of the regional diffusivities were generated. Each constituted a spatiotemporal block spanning an average of 500 yr of temperature averaged over the time block through 21 ka. With the relative sediment flux (q) calculated for each pixel, we mapped the results to spatially illustrate the paleo-erosion rates, then we analyzed the temporal variability of the rates and generated quantitative comparisons globally and through time. The following comparative analyses were illustrated through global maps showing the indicated value for each pixel: (1) the average diffusivity through 21 ka, (2) the time of the maximum diffusivity at a given node, (3) the temperature associated with the maximum diffusivity, (4) the difference between the highest and lowest diffusivities, and (5) the comparison of the long-term average diffusivity with the average over the last 500 yr.
The average diffusivity for each pixel, through time and across space, was calculated and mapped to compare patterns in changing diffusivity across space. Times when diffusivity peaked for each pixel were mapped to compare global locations as they might have responded to changes in climate for the past 21 ka. Comparisons between the long-term average and the current diffusivities illustrate where there is significant difference between current diffusivity and the long-term average. The difference between maximum and minimum relative erosion shows where the changes in erosion have varied the most and the areas that have experienced negligent or no change in erosion. Such comparisons were considered to be reasonable starting points for using the spatial patterns generated by the 3D data to address the questions of where past climate change since the LGM may be shown to correlate with changes in diffusivity leading to erosion rates, how much the magnitude of those changes varied through time, and how much current erosion rates in the current climate might be considered to differ from long-term average erosion rates.
Correlation of sedimentary records with models
Over long periods of time the diffusivities closely reflect the erosion rates. Therefore, in this study, we compared the relative variations of diffusivities through time to the sediment accumulation rates of sediment cores from corresponding sink areas. The core data serve as physical evidence of the actual erosion in a given watershed and, therefore, were used to validate the erosion model. We assessed the mapped trends of the 21 ka erosion rates, using a single representative slope, with sediment accumulation rates from published records of corresponding offshore and lacustrine sediment cores. This approach is based on the assumption that the cores represent physical sink regions of corresponding mapped source areas, and thus it should follow that terrestrial regolith that is eroded on land areas will eventually be transported through rivers and be deposited in the sea or in lakes. Given that the changes in climate were occurring on a global scale, it is expected that on a long time scale of thousands of years, relative changes in sediment accumulation rates reflect corresponding relative changes in erosion rates in source areas. If these assumptions hold true, then it is reasonable to expect some correspondence in timing between changes in erosion rates at a source area and the record of sediment accumulation rates in a sink area, albeit with possible lag times.
Sediment core data were selected based on (1) the availability of published data representing sediment accumulation rates of offshore deposits for 21 ka as close to the mapped region and time range as possible and (2) a spatially representative and broad distribution of sediment cores in both high and low latitudes. Northern Hemisphere regions were deemed especially important, as they exhibited the highest variability in erosion rates when compared with tropical regions. Tropical sources, such as the Ganges and Amazon watersheds, were important, as they contribute to the major river systems deriving sediment from major mountain ranges. The published core data from the following areas (Table 1) were selected to reflect these critical areas, and they were compared with modeled erosion rates averaged in watershed source areas: Amazon River basin (Zhang et al., Reference Zhang, Chiessi, Mulitza, Zabel, Trindade, Hollanda, Dantas, Govin, Tiedemann and Wefer2015), the Ganges River into the Bay of Bengal (Prajith et al., Reference Prajith, Tyagi and John Kurian2018) in the tropics, Lake Schrader in the western Arctic (Benson et al., Reference Benson, Kaufman, McKay, Schiefer and Fortin2019) in the Brooks Range in northern Alaska and also by the Lone Spruce Pond sediment core (Kaufman et al., Reference Kaufman, Axford, Anderson, Lamoureux, Schindler, Walker and Werner2012) in the Ahklun Range in southwestern Alaska. The eastern Arctic is represented by northern Siberian offshore deposits in the south Laptev Sea sourced from Lena River drainage (Bauch et al., Reference Bauch, Kassens, Erlenkeuser, Grootes and Thiede1999) and offshore deposits in south Kara Sea sourced from the lower Yenisei River drainage (Stein et al., Reference Stein, Niessen, Dittmers, Levitan, Schoster, Simstich, Steinke and Stepanets2002).
Sediment cores, published sources, and related source areas; correlation coefficients of the modelled erosion rates and sediment accumulation rates calculated from published age–depth core curves.a

a Correlation coefficients are tabulated for each figure showing model and sediment core comparisons and related source areas with locations of sink areas and their published references from which sediment accumulation rates were calculated. AR, Amazon River; GR, Ganges River; LR, Lena River; YR, Yenisei River.
We compared the relative magnitudes of change through time between an average of the modeled continental-scale source region and the published benthic sediment accumulation rates proximal to the outlet. A comparison of trends between the erosion rates of the model and sediment accumulation rates of the core data suited the objectives of the time-varying regional comparative focus and resolution of this study. The calculations of absolute basin volumes were beyond the scope of this research. To accomplish this relative comparison, each regional data set was scaled to its maximum value, and these scaled model and core values were plotted in the same figure on their own y-axis. For the present study, the interest was in correlation of trends between modeled erosion rates and sediment accumulation rates of the cores. Therefore, we did not speculate on the causes of particular trends or the timings of their changes. We calculated a Pearson correlation coefficient to quantify the fit between regional diffusivity models and accumulation rates of corresponding sink areas.
RESULTS
The objective of this study is to map the diffusivities through time for all land areas for the past 21 ka. As this period of time is marked by the profound global climate change from glacial to interglacial climate, the expectation is that the erosion rates were also shifting through time. Through analysis of published diffusivities and corresponding local air temperatures, a transfer function was generated and applied globally through the past 21 ka with local paleo-temperature data from simulations of a transient global paleoclimate model. Resulting data of past time-slice maps were used to generate new maps showing the results of analyses. These resultant maps were used to assess the variations in diffusivity within a given region through time and space that coincided with changes in climate. The transfer function (Fig. 1, Eq. 2), expressing the diffusivity parameter Κ as a function of temperature, was used to calculate reference erosion rates for each time period for each node of the land model. Each local area was defined by latitude and longitude coordinates originating from the TraCE-21ka paleoclimate model. Every pixel in each time slice contains the reference diffusivity dependent on MAAT averaged over 500 yr intervals through the past 21 ka.
Long-term average diffusivities
The map showing long-term average diffusivities (Fig. 2) displays relative increases from the tropics to the Arctic in the results from the means through time. This reflects the increase in long-term average erosion coinciding with a general decrease in regional temperatures. In addition, areas of high altitude (e.g., the Tibetan Plateau and alpine regions) also display increased erosion rates relative to their surroundings. Within the Arctic, the largest contrast in diffusivities occurs between those regions covered by the LGM ice sheet or bordering it and those areas outside it.
Map of average diffusivities through time of all time intervals across space for each pixel. Overall, higher average diffusivity coincides with colder average temperatures, such as within the Arctic and high altitudes, such as the Tibetan Plateau.

Times and relative temperatures of peak erosion rates
Use of a paleoclimate model together with the space-for-time transfer of the association of temperature with diffusivity permitted the retrieval of temporal associations, such as the timing of peak of erosion since 21 ka (Fig. 3). A comparison of the maps for the long-term average diffusivities with times of peak erosion (Figs. 2 and 3), shows that the Arctic exhibits the highest diffusivities at the start of deglaciation, which was transient through the regions covered by the last ice sheet 16–8 ka. In contrast, tropical regions display the relatively highest diffusivities near the start of the LGM, when global temperatures were lowest (Fig. 4). Western and eastern Siberia display a difference in timing of peak diffusivity. Areas with relative proximities to melting ice-sheet boundaries, such as the Canadian and European Arctic, display greater variability in timing of peak diffusivities. In contrast, the eastern Arctic, which lacked the continental-scale ice sheet during the LGM, displayed the coldest average temperatures since the start of the LGM. This coincides with results displaying higher long-term average diffusivities than those displayed in the western Arctic, which had extensive ice sheets persisting long after the LGM.
Map of times of highest diffusivities since 21 ka across space. The map is strongly controlled by the deglaciation history of the Arctic areas. The western Arctic exhibits the most transience and shows the latest maximum erosion rates, occurring closest to the present time. The rest of the land areas that were not covered by ice sheets display times of highest erosion when the air was generally the coldest within the past 21 ka, which generally occurred soon after the last glacial maximum (LGM).

Map of temperatures at times of highest diffusivity over 21 ka for each pixel. Greater variability in temperatures is evident within Arctic areas than what is seen in the tropics. The large variability is due to the large differences in timing when the various parts of the Arctic were deglaciated. Temperatures (500 yr MAATs) of peak erosion time differ regionally and are defined by the transfer function. In areas that have been continuously ice covered for the past 21 ka (Greenland and Antarctica) the coldest modeled temperatures have no relation to erosion.

Relative erosion rate spatial comparisons
For a given location, the range between the highest and lowest erosion rates in the time series is largely dictated by the timing of the deglaciation at that location (Fig. 5). The ratio between long-term average diffusivities and present-time diffusivities (Fig. 6) is plotted on a relative scale (0–1) where the long-term averages are divided by the present-time diffusivities. Here, “present-time” refers to the last time step from TraCE-21 ka, and the long-term average is the average diffusivity since the LGM. The ratios (Fig. 6) illustrate how much diffusivities in the present time differ from the long-term average diffusivities. The results show that the degree of variance between a long-term average and recent diffusivities varies by region and is strongly controlled by the spatial and temporal differences of the deglaciation.
Map of maximum to minimum difference in diffusivity for a given pixel. Largest intraregional differences occur in the Arctic, except for Alaska. For the rest of the regions, spatial distribution of the difference varies by proximity to the last ice sheet or cold temperatures at high altitudes, e.g., the Tibetan Plateau.

Map displaying relative comparison of long-term average diffusivities with present time diffusivities (long-term/present). Values > 1 indicate higher long-term averages compared with the present. Much of the lower latitudes shows values close to 1, which indicates that there was little change in climate over time. The Arctic overall displays the greatest variance from the present. The differences appear controlled mostly by proximity to the last ice sheets, the length of time since their melting, and local temperatures when subaerial exposure started.

The Canadian and northern European Arctic display the highest diffusivities at the present time, because the continental ice sheets melted relatively late in the western Arctic. At that time, the local temperatures were already significantly warmer. However, the eastern Arctic was never covered by a continental ice sheet, and therefore the terrain was exposed to the cold of the LGM and thus experienced high diffusivities early on. Therefore, the maximum diffusivity was occurring in the western Arctic closer to the present time than when maximum diffusivity occurred in the eastern Arctic. Hence, the long-term average diffusivities in the eastern Arctic are higher than the present diffusivities. The longer the subaerial exposure was in cold regions, the wider the range between the maximum and minimum temperatures was. The map also displays tropical and subtropical regions as having the smallest range between long-term averages and present erosion, as they have had the overall lowest diffusivities through time. In addition, the erosion rates in the tropics have remained nearly constant since the LGM.
Sediment cores compared with modeled erosion rates
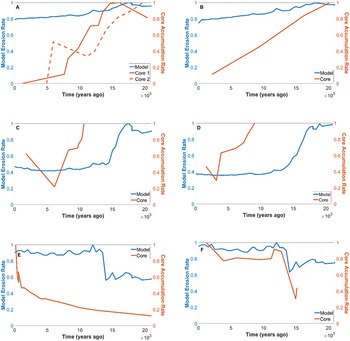
In an attempt to validate and verify our model results with corresponding physical processes, published core data from sediment sinks that correspond to the largest watersheds in various parts of the globe were collected. We scaled both models and published core data to the largest values in each data set and subsampled them at the same time intervals (500 yr) (Fig. 7). All of the comparisons between the model and core data generated moderate to high correlation coefficients. The correlations between the model and the cores in all the data sets are shown in Table 1, and they range from 0.65 to 0.97 with an overall mean of 0.83. Cases of time-lag offsets between core and model data that reduced correlation are expected with sediment cores, as numerous factors are known to offset the timing of sediment accumulation in sink areas and reduce correspondence with source region erosion rates. However, the moderate to high mean correlation values lend physical support to the trends of the model results overall and the time scale used to generate them.
Offshore sedimentation and model erosion through time. Both are scaled to their respective maximum values. Scales of y-axes range from 0 to 1. Modeled erosion rates are given by spatially averaged nodes. (A) Amazon watershed compared with sediment core accumulation rates in offshore sink area, core site located 750 km SE of Amazon River delta (core 1) and 667 km NE of Amazon River delta (core 2) (Zhang et al., Reference Zhang, Chiessi, Mulitza, Zabel, Trindade, Hollanda, Dantas, Govin, Tiedemann and Wefer2015). (B) Ganges River watershed compared with sediment core accumulation rates in offshore sink area, 1500 km south of the Ganges delta, in the Bay of Bengal (Prajith et al., Reference Prajith, Tyagi and John Kurian2018). (C) Lena River watershed, northeast Siberia, compared with sediment core accumulation rates in offshore sink area, 400 km northwest of the Lena delta, in the south Laptev Sea (Bauch et al., Reference Bauch, Kassens, Erlenkeuser, Grootes and Thiede1999). (D) Yenisei River watershed, northwest Siberia, compared with sediment core accumulation rates in offshore sink area at the mouth of the Yenisei River meeting the south Kara Sea (Stein et al., Reference Stein, Niessen, Dittmers, Levitan, Schoster, Simstich, Steinke and Stepanets2002). (E) Rectangular area 225 km by 170 km surrounding the lake in Ahklun Range, southwest Alaska, compared with sediment accumulation rates of Lone Spruce Pond sediment core (Kaufman et al., Reference Kaufman, Axford, Anderson, Lamoureux, Schindler, Walker and Werner2012). (F) Rectangular area 41 km by 167 km surrounding Lake Schrader, northeast Brooks Range, north Alaska, compared with Lake Schrader sediment core (Benson et al., Reference Benson, Kaufman, McKay, Schiefer and Fortin2019).

DISCUSSION
Results of this study show the variation of regional diffusivities through time for the past 21 ka. The empirical observations between current diffusivity, air temperature, and paleoclimate over the past 21 ka provide a physical basis for considering spatial variabilities in erosion. Such global spatial patterns provide a means for addressing, for example, where regolith mobility may be the relative highest, compared to other regions, since the LGM or which areas have experienced the largest variation in erosion rates. The standard error for each location was significantly below 1 SD from the transfer function curve, and correlation coefficients for sediment accumulation rates from sink-area sediment cores corresponding to source region model relative erosion rates were moderate to high. Therefore, the approach taken, which has been demonstrated to be well justified, has been validated, and the results reflect the physical conditions.
In conventional approaches, K remains undefined, except as a mathematical function in hillslope modeling, which is held constant in order to test other influences on erosion, such as lithology (DiBiase and Whipple, Reference DiBiase and Whipple2011) or precipitation (Godard et al., Reference Godard, Tucker, Burch Fisher, Burbank and Bookhagen2013; Richardson et al., Reference Richardson, Perron and Schurr2019), in a landscape evolution model. Such approaches, however, ignore potential contributions of changes in the climate system to landscape variations on a regional scale. In contrast, the present study introduces a novel approach that employs as a framework a globally occurring process and a global climate benchmark. Together, soil creep and air temperature are used to quantify a relationship to gauge relative changes in soil mobility coinciding with known changes in climate.
The approach employed showed the relative differences the history of past climate might have had on erosion rates since the LGM. This can serve as a guide for understanding which factors in a changing climate become the drivers of erosion in certain regions and when.
The maps are based on application of a sediment transport law to express soil mobility in terms of climate. Due to the assumptions related to the use of space-for-time substitution in the modeling and the spatial resolution of the resulting erosion maps, less weight was placed on changes and values of a given individual pixel than on the values mapped in robust regional trends. The spatial patterns resulting from the nonlinear relationship between a climate benchmark and potential driver (air temperature) and the resulting diffusivities imply that climate and erosion are not spatially or temporally predictable. Therefore, in certain regions, use of a constant diffusivity could generate results inconsistent with variability caused by changing climate.
Delineations of spatial patterns of how different regions responded to changes in climate do provide actual locations that can be tested, measured, and compared with respect to models that might incorporate more nuanced representation of the geology, topography, and biome. Sediment accumulation rates from age–depth curves support the general trends of the mapped erosion rates from related source regions. Their trends accord with average erosion rates of the contributing watersheds. Even though areas not included by the ice-sheet masking may be sources of glacially deposited sediment, the averages accorded well to produce similarity in trends between sediment cores and corresponding regional degradation. The correlating trends therefore support the broad relationship established in this study between climate and diffusivity and the applicability of this scheme to study the regional erosion rates since the LGM. In general, the trend of decreasing temperatures from the tropics to the Arctic is a proxy for climate that corresponds to higher diffusivities leading to higher erosion rates and their increased regional variability. Given this broad agreement and applicability, results of this study have strong potential for use as a guide to target regions of higher spatial resolution for further study.
The purpose of the plots that compare the modeled erosion and the sediment accumulation was to provide a simple way to visualize temporal synchronicity and direction of changes. Only the temporality and general directions of increases or decreases were the targets for comparisons, not volumes of material or numerical rate changes. Many factors can contribute to lags in synchronicity between erosion and accumulation from source to sink. The focus of this study was not to correlate sediment provenance, as many studies have. The timing of erosion in the Himalayas to assess the force of drivers versus changes in sea level (Prajith et al., Reference Prajith, Tyagi and John Kurian2018; Reilly et al., Reference Reilly, Bergmann, Weber, Stoner, Selkin, Meynadier, Schwenk, Spiess and France-Lanord2020) is one of many such examples. The use of the published sediment core accumulation rates for model diffusion validation is novel in the present study. The global changes in climate, here assumed to be reflected in by changes in temperature, and the use of the transfer function are what the timing and directional trends in the sediment core are being used to validate. The sediment cores are not being used in the present study to correlate masses of material through time, only relative increases and decreases. Each was scaled to its given maximum value so that the timing of those relative increases and decreases could be compared between sets of the modeled erosion rates and sediment core accumulation rates. Therefore, the magnitudes of increases and decreases are not the targets of interest. The correlation coefficients, on the other hand, mathematically quantify the correlations. Used together, the visualizations and the coefficients indicate how well the models correlate with the expected sediment core accumulation trends, and they reveal time ranges that may be useful targets for further study.
Comparative inspection of source area watersheds at higher spatial resolution would be needed to speculate on the differences in trends and correlations between models and cores. The present method and the strong correlations through time between source region model diffusivities and time-varying accumulation rates of sink-area sediment cores provide support for future investigations that seek to explore features of the climate system together with associated hillslope diffusivities and core section chemistry and biota for designated time ranges.
CONCLUSIONS
The primary objective of this study was to quantitatively assess the relative changes in erosion rates on all land areas through glacial–interglacial climate transition since the LGM to present. Given the evidence of known past changes in climate since the LGM, the objectives were to define known recent measures in soil mobility in terms of their associated climate zones and transfer those measures back through time using modeled past air temperatures. A transfer function based on a globally observed soil mobility and corresponding air temperatures yielded a good fit. Through application of the paleo-global climate model, TraCE-21ka, and use of a space-for-time substitution, past diffusivities through 21 ka were quantified and mapped for all land areas. More than 40 time-slice maps were used to analyze the global variability of diffusivity and relative erosion through time.
Time-slice maps were generated and used in quantifying the relative spatial and temporal patterns in erosion. Pixel resolution of 3.70° latitude by 3.75° longitude permitted global-scale comparisons of regional changes through time. The following large-scale patterns were detected:
1. At the glacial to interglacial time scale, the average erosion rates have been the largest in Arctic and alpine regions and lowest in the tropics. The Arctic overall exhibited the largest spatial variability in diffusivities. Little to no change in diffusivities occurred in tropical and subtropical regions.
2. Variability in diffusivity between the western Arctic, which was covered by an ice sheet, and the eastern Arctic, which was largely ice free, is displayed through the map comparing the long-term average and present diffusivities. The glacial and climate history of the region coincides with a difference in land-surface response to climate change resulting from the long exposure of the land surface to cold temperatures in the eastern Arctic and to an ice sheet covering the land in the western Arctic. Yet, throughout the Arctic, the difference between the highest and lowest erosion in a given location is higher than in lower latitudes, which is consistent with the climate varying little in the tropics since the LGM.
Moderate to high correlation between modeled erosion rates through time in representative watersheds with sediment accumulation in adjacent sinks, on the same time scales, strongly supports these findings. While we only provide relative metrics of erosion, results of the spatial comparisons provide a global framework to assess variabilities in the relation of climate to diffusivity and, potentially, erosion rates through time. This is accomplished by (1) quantifying interregional variations in diffusivities and (2) providing geographic insights, for example, of where to target future investigations of past or future climate change and the corresponding changes in diffusivities.
Acknowledgments
The authors thank senior editor Lewis Owen, associate editor Jason Dortch, and two anonymous reviewers for helpful feedback that improved the quality and clarity of the article. The authors declare they have no conflicts of interest.