I. INTRODUCTION
In microelectronics manufacturing, soldering is often made between Sn-containing alloys and Cu interconnection pads. The metallurgical reactions lead to the formation of layered Cu6Sn5 and Cu3Sn intermetallic compounds (IMCs) on the pad/solder interface. The Cu3Sn layer is usually thin right after soldering, on the order of nm,Reference Shang, Liu, Li and Shang1, Reference Shang, Liu, Pang, Li and Shang2 but both IMCs grow by solid state reactive diffusion upon further thermal exposure. Microscopic voids are often observed inside the Cu3Sn IMC and at the Cu/Cu3Sn interface after isothermal aging tests. Severe adverse effects of such voiding on solder joint reliability in impact tests of BGA (ball grid array) assemblies were first presented by Zeng et al.Reference Chui, Zeng, Stierman, Edward and Ano3, Reference Zeng, Stierman, Chui, Edward, Ano and Tu4 Since then, several groups have confirmed that voiding in Cu3Sn may indeed lead to significant degradation of solder joint reliability in board-level impact tests.Reference Mattila and Kivilahti5–Reference Yu and Kim7 Void-induced brittle failure at the solder/pad interface was also found to occur in mechanical shear and pull tests of solder bumps.Reference Zeng, Stierman, Chui, Edward, Ano and Tu4, Reference Anderson and Harringa8 In addition, Cu3Sn voiding was reported in flip-chip joints on electroplated Cu UBM (under bump metallization) or Cu pillars, during extended current stressing at elevated temperatures.Reference Chao, Chae, Zhang, Lu, Ding, Im and Ho9–Reference Lai, Chiu and Chen12 The growth of IMCs and voids were seen to be greatly affected by electromigration induced by current densities on the order of 103–104 A/cm2.
The voiding phenomenon is often referred to as Kirkendall voiding or diffusion porosity. It is commonly believed that voids arise from the agglomeration of excess vacancies, as a result of the intrinsic diffusivity difference between the two diffusion species, Cu and Sn. In reactive interdiffusion systems, reaction product formation at the interfaces is accompanied by a divergence of vacancy fluxes, so the interphase interfaces must act as sources or sinks for vacancy fluxes.Reference Pieraggi, Rapp, van Loo and Hirth13 However, one intriguing observation is that the Kirkendall voiding does not always occur in Cu-Sn binary diffusion couples. A high voiding level in Cu3Sn has so far only been observed on electroplated Cu interconnect pads. On high purity wrought Cu samples, such as oxygen free high conductivity (OFHC) Cu, solder joints showed negligible voiding under the same aging conditions.Reference Yang, Messler and Felton14–Reference Wang, Lin and Kao18 These experimental observations suggest that the diffusion flux imbalance in Cu3Sn by itself is not enough to lead to high levels of voiding.
Minor solder alloy additives (≤0.5 wt%) have been assessed in terms of their ability to counteract voiding by either replacing or reducing the interfacial Cu3Sn layer.Reference Kondos, Borgesen and Yin19–Reference Kim, Yu and Kim25 Among them, Zn doping was shown to effectively eliminate the voiding phenomenon, while Sb and Ni doping of the solder appeared to retard the time evolution of the void growth. However, such additives could lead to drastic changes of the interfacial metallurgy, as well as changes of the solder joint microstructure. Systematic studies of mechanical properties, wetting behavior, and reliability performance would therefore be necessary to qualify solder alloys with those additives in a broader context.
Otherwise, proactive and preventative remedies, based on a fundamental understanding of the underlying root cause of voiding in Cu3Sn, are needed. So far, it has not been clear what properties of the electroplated Cu are responsible for the voiding. Yang et al.Reference Yang, Messler and Felton14 speculated that codeposited hydrogen might agglomerate into voids during thermal aging. Laurila et al.Reference Laurila, Vuorinen and Kivilahti15 conjectured that the voiding phenomenon was caused by organic and inorganic impurities incorporated in electroplated Cu films. Yu and KimReference Yu and Kim7, Reference Kim, Yu and Kim25 attributed the voiding to residual sulfur from an organic plating additive, based on the AES (auger electron spectroscopy) findings of sulfur segregation to the Cu3Sn/Cu interface and void surfaces. The studies so far have not suggested any way to reduce the voiding level other than adding dopants to the solder alloy. Most of the researchers attributed the voiding phenomenon to the Kirkendall effect, which is caused by diffusion flux imbalance in inert diffusion couples.
In the present work, commercial Cu samples plated by industrial electroplating baths were first surveyed for their void propensity. This was found to vary dramatically from sample to sample. A preannealing treatment was shown to reduce the propensity for subsequent Cu3Sn voiding level significantly. The simultaneous evolution of pores within the Cu, together with variations in Cu grain growth, offered evidence of a direct correlation of voiding behavior to organic impurities in the Cu samples, as conjectured by Laurila et al.Reference Laurila, Vuorinen and Kivilahti15 In contrast to Yu and KimReference Yu and Kim7, Reference Kim, Yu and Kim25 we do, however, argue that impurities other than sulfur must be involved. Finally, instead of the Kirkendall voiding mechanism, alternative mechanisms were proposed based on the experimental observations, and further based on the analysis of the Cu-Sn reactive diffusion system.
II. EXPERIMENTAL
A. Materials
One hundred and three Cu samples from a range of sources were divided into three groups based on their manufacturing processes. Group 1 was composed of 56 printed circuit boards (PCBs) with electroplated Cu pads (labeled as PCB-xx). Most of the samples (50+) were functional products supplied by various industrial sources. The samples provided a good cross section of electroplated Cu structures currently being used in the microelectronics industry for interconnection. The rest of the samples were test boards for solder joint reliability evaluation. PCB Cu pads are usually electroplated in acid Cu plating baths containing Cu sulfate (CuSO4), sulfuric acid (H2SO4), chloride ions (Cl–), and proprietary organic additives. The additives are used to achieve desired Cu grain structures and properties, for example, bright appearance, fine grain, and good ductility. State-of-the-art Cu electroplating often faces the challenge of plating high aspect ratio holes or trenches (micrometer-size or smaller) with a uniform thickness. Plating additives and processing parameters often need to be specially formulated to achieve a conformal deposition.
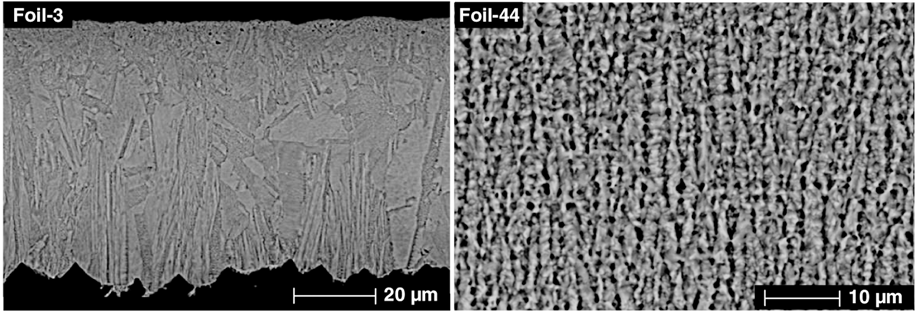
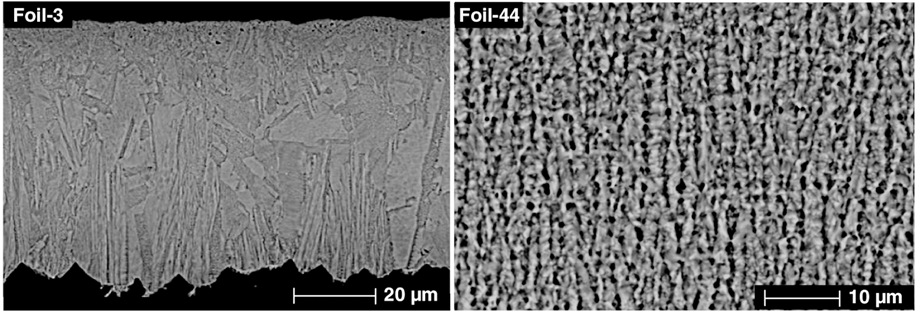
Group 2 consisted of 45 free standing Cu foils from various sources (labeled Foil-xx). Forty-three foils were so-called ED (electrodeposited) foils. The term ED is being used by the microelectronics industry to differentiate it from the Cu metallization on PCB and semiconductor devices (Group 1 samples). ED Cu foils are mostly used as inner and outer layers for multilayer PCB construction. Their thicknesses range from 15 μm to 150 μm. ED foils are typically manufactured by a roll-to-roll process. Cu is electroplated onto a rotating drum (2–3 m in diameter), which is partially submerged in a plating bath. The Cu deposition layer is then peeled off the drum continuously. ED foils are typically electroplated from acid Cu plating baths as well. However this manufacturing process has three distinct features, compared to the process used for PCB plating, (i) large planar cathode surface; (ii) less complicated plating additive chemistry; and (iii) large plating current density. The grain structure of ED foils was characterized by large columnar crystals perpendicular to the foil surfaces. Those process differences are expected to play a role in the propensities for voiding. Among the foil samples, two foils (Foil-44 and Foil-45) were electroplated by PCB plating baths onto stainless steel substrates and then peeled off. Their grain structure was similar to that of PCB samples. Cross section images in Fig. 1 show a comparison between an ED foil and a PCB foil. The cross sections were etched by a mixture of ammonium hydroxide and hydrogen peroxide to reveal the Cu grain boundaries.
Grain structure of electroplated Cu foils. Foil-3 was an electrodeposited foil and Foil-44 was electroplated by a PCB plating bath.
Group 3 was composed of two commercially available high purity wrought Cu foils from different sources (labeled HP-1 and HP-2). The foils were both 99.9999% pure (metal basis) as quantified by GDMS (glow discharge mass spectroscopy) analysis. The foils had large equiaxed grains, sometimes elongated, most likely due to cold working.
B. Soldering and thermal aging
Soldering of the Cu samples was conducted in a 10-zone reflow oven (Vitronic-Soltec XPM1030N, Stratham, NH) in a nitrogen atmosphere. The solder alloy spheres had a near eutectic composition of 95.5% Sn, 4.0% Ag, and 0.5% Cu (wt%). The size of the spheres ranged from 0.3 mm to 0.76 mm in diameter; depending on the Cu pad size on the PCBs. Spheres of 0.76 mm diameter were used for foil samples and high purity samples. A soldering flux (Kester TSF-6522) was applied on the Cu samples and the solder spheres to remove surface oxides during soldering. The time-temperature profile of the reflow process had a maximum of 260 °C and a time above eutectic liquidus (217 °C) of 60 s.
After soldering, PCB samples were isothermally aged in air at temperatures of 150 °C for 1000 h. The aging condition is commonly used as an accelerated storage test for microelectronic assemblies. The foil samples and the high purity foils were aged at 175 °C for 1000 h for the convenience of better voiding level quantification. After aging, samples were cross-sectioned and polished by standard metallographic preparation procedures. Voiding inspection was conducted using an environmental scanning electron microscope (Philips/FEI XL-40, Eindhoven, The Netherlands). SEM micrographs were taken in back scattered electron (BSE) mode to show compositional contrast.
Quantification of the voiding level was conducted by measuring the number of visible voids per unit length of the Cu/Cu3Sn interface. All the measured images had a resolution of 0.048 μm/pixel. At each aging condition, two solder bumps were imaged, covering a total length of ~500 μm. The image-processing software Scion Image (NIH, Bethesda, MD) was used for quantification.
C. High temperature annealing
Sixteen Cu foils were selected for annealing at 650 °C for 2 h before soldering, hereafter referred to as preannealing. The preannealing temperature T was chosen somewhat arbitrarily and our work to be published at a future time addresses the effects of preannealing temperatures. However, the present temperature is equivalent to 0.68 T m and often used to evaluate grain growth behavior of Cu metallization in integrated devices.Reference Chu, Hsieh, Lin and Mahalingam26, Reference Barmak, Gungo, Cabral and Haper27 Notably, the vast majority of organic species are not thermally stable at this temperature. The effects of organic impurity decomposition on the subsequent voiding behavior are believed to offer important clues as to the underlying mechanism. The selected foils had a range of voiding propensities. Among them, 13 were ED foils, two were electroplated foils (Foil-44 and Foil-45), and the last one was a high purity wrought Cu foil (HP-1). The foils were cut into 8 mm by 60 mm pieces, ultrasonically cleaned in isopropyl alcohol, dried with a nitrogen stream, and then sealed in borosilicate glass tubes, which were evacuated and backfilled three times with high purity (99.999%) Ar gas before sealing. The tubes were subsequently placed in a preheated three-zone tube furnace (Lindberg Blue M). After 2 h at 650 °C, the glass tubes were allowed to furnace-cool to a temperature less than 200 °C, and to air-cool to room temperature. The annealed foils were then soldered and thermally aged for 170 h at 175 °C, otherwise following the same procedures as above. Unannealed counterparts were processed at the same time as the controls.
D. Cu foil density measurement
Foil density measurements were conducted to evaluate the effect of preexisting plating porosity on the Kirkendall void formation. The three thickest foils from above were selected here. Samples were as-received and annealed Foil-1 (140 μm thick), Foil-44 (130 μm thick), and Foil-45 (130 μm thick). As we shall see below, as-received Foil-1 and Foil-44 were highly prone to Cu3Sn voiding, but the high temperature preannealing virtually eliminated this propensity. Foil-45 exhibited low voiding level and the preannealing had no effect on it.
Density measurements were conducted using a specific gravity bottle. This involved determining the mass difference of the water in the bottle, with and without Cu foil pieces immersed, and then calculating the corresponding water volume occupied by the foil pieces. The foil density was then calculated from the foil mass and volume. The specific gravity bottle was 10 mL in volume and the Cu foil samples each weighed 3–5 g. The foil pieces were ultrasonically cleaned in isopropyl alcohol to remove surface contamination, degassed in deionized water, and then dried in a vacuum oven at 80 °C. The analytical balance (Denver Instruments APX-100) had a readability of 0.1 mg. The accuracy of the balance was verified by a set of calibrated Troemner weights ranging from 1 to 20 g. The water mass was averaged over 8 to 12 measurements, and the water temperature was monitored by a thermocouple sensor during each measurement. The readability of the sensor was 0.1 °C.
E. Impurity level measurement by SIMS
Two sample sets were selected for SIMS (secondary ion mass spectrometry) analysis. One set was comprised of two ED foils, Foil-1 and Foil-3 (70 μm thick), with high and low propensities for Cu3Sn voiding respectively. The other set consisted of Foil-44 specimens, as-received and preannealed. SIMS analysis was conducted on a Cameca IMS-6f instrument (Gennevilliers, France) using Cs primary ions at 9.5 keV. Depth profiling was performed at 5 nm/s on a circular crater 30 μm in diameter, continuing up to 15 μm in depth. Repeating profiles, capable of detecting C, O, Cl, S, H, and other metallic elements simultaneously, and single mass monitoring of selected elements, were used.
III. RESULTS
A. General survey
Electroplated Cu pads on 56 different PCBs, 45 different electrodeposited foils, and two high purity wrought foils were compared in terms of their propensities for Cu3Sn voiding after soldering.
1. PCB Cu pads
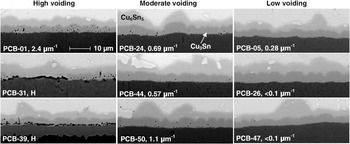
Figure 2 shows voiding examples for PCB samples after aging at 150 °C for 1000 h. For this aging condition, the Cu3Sn IMC thickness for most samples ranged from 3.0 μm to 3.5 μm. The IMC thickness for each sample was determined by measuring the Cu3Sn IMC area and dividing the area by the corresponding interface length. Three categories of low, moderate, and high voiding were defined corresponding to voiding densities of <0.5 μm−1, 0.5–1.5 μm−1, and >1.5 μm−1. Images of PCB-31 and PCB-39 were marked by “H,” as the voiding levels were too high to be quantified by void number density. At the Cu/Cu3Sn interface, some voids linked together and formed large, elongated voids or gaps. The gaps on the interface sometimes could cut off Cu diffusion from the pad and consequently lead to large variation of Cu3Sn thickness, as shown in the left half of the image for PCB-31.
SEM micrographs showing voiding behavior of selected PCB samples after thermal aging at 150 °C for 1000 h. Images are on the same scale.

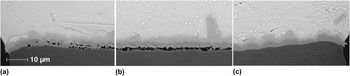
Several PCB samples showed large variations of voiding level, from pad to pad on the same PCB, or even along one single pad. Figure 3 shows an example of such variation in a solder joint on PCB-36. The Cu pads were ~800 μm in diameter. Each image in Fig. 3 covers 62 μm in width. Figure 3(a) shows the left end of the solder/pad interface. Large and elongated voids are distributed inside the Cu3Sn. Figure 3(b) shows the middle section of the pad. A continuous gap can be seen at the Cu/Cu3Sn interface, while the thickness of Cu3Sn appears to be uniform and comparable to other sections. Figure 3(c) shows a very low voiding level at the right end of the pad. Since the life of a microelectronic product is determined by the weakest link among many interconnects, a large variation in voiding level poses a serious threat to product reliability.
SEM micrographs showing voiding level variation along a Cu pad on PCB-36. (a) Left; (b) Middle; (c) Right. Images are on the same scale.

Voiding in Cu3Sn has been previously seen to have two different distribution modes, (i) uniform distribution inside the Cu3Sn layer and (ii) mostly concentrated on the Cu/Cu3Sn interface. Laurila et al.Reference Laurila, Vuorinen and Kivilahti15 noted a difference in the void distribution between Sn and SnAgCu solder on electroplated Cu. As shown in Figs. 3(a) and 3(b), however, the two distributions were observed on the same Cu pad in our case. This suggests that the Ag and Cu contents may not have been the reason for the difference observed by Laurila et al. Instead, it was most likely a manifestation of voiding level variations in the electroplated Cu.
2. Cu foils
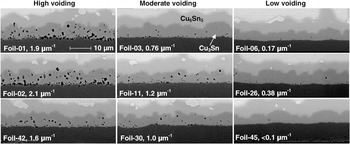
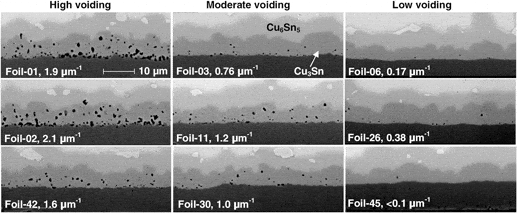
Similar to the PCB samples, the Cu foil samples exhibited a spectrum of voiding propensities. Figure 4 shows voiding examples of voiding after aging at 175 °C for 1000 h. For this aging condition, the Cu3Sn IMC thickness ranged from 4.5 to 6.3 μm. The voiding level was seen to have less spatial variation than for the PCB samples. Even with the higher aging temperature, no sample developed large gaps on the Cu/Cu3Sn interface the way several of the PCB samples did. The voids appeared to be distributed evenly inside the Cu3Sn. The void densities of 0.5 μm−1 and 1.5 μm−1 were again used to categorize the voiding behaviors.
SEM micrographs showing voiding behavior of selected foil samples after thermal aging at 175 °C for 1000 h. Images are on the same scale.

One interesting observation from Fig. 4 is that the voids near the Cu/Cu3Sn interface are comparable in size with those near the Cu3Sn/Cu6Sn5 interface. The same observation can be made from Fig. 3 for samples without gaps on the Cu/Cu3Sn interface. In other words, the void size does not vary significantly between the Cu3Sn layer formed first and the layer formed last. It has been reported that at the present aging temperatures the majority of Cu3Sn growth occurs at the Cu3Sn/Cu6Sn5 interface,Reference Shang, Liu, Pang, Li and Shang2, Reference Borgesen, Yin, Kondos, Henderson, Servis, Therriault, Wang and Srihari17, Reference Borgesen, Yin and Kondos28–Reference Vuorinen, Laurila, Mattila, Heikinheimo and Kivilahti30 so the voids near that interface must be most recent. Given the time needed for void nucleation and growth, the relatively large voids near that interface suggest that the Cu3Sn/Cu6Sn5 interface was where void nucleation occurred. Another implication is that the Cu3Sn/Cu6Sn5 interface is a vacancy source, which provides the local vacancy super-saturation needed for nucleation. Once nucleated, the new voids become active vacancy sinks and grow rapidly. The reason the void size does not vary with location, and thus with age, is that the growth largely stops once the Cu3Sn/Cu6Sn5 interface moves on and leaves the void behind.
3. High purity wrought Cu foils
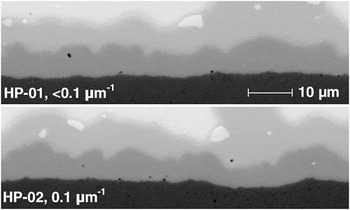
Figure 5 shows the voiding in two high purity wrought Cu samples, HP-1 and HP-2, after thermal aging for 1000 h at 175 °C. The void densities are 0.1 μm−1 or less, which are comparable to those for the PCB or foil samples with the lowest voiding propensity. It thus appears that electroplated Cu can be manufactured with a voiding propensity just as low as for high purity wrought Cu.
Voiding behavior of high purity wrought Cu samples after thermal aging at 175 °C for 1000 h.

4. Survey summary
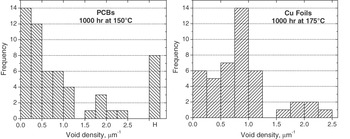
Void densities are plotted as frequency graphs in Fig. 6 for the PCB samples and the Cu foils. In the plot for the PCBs, it can be seen that 26 out of 56 samples (~46%) have a void density less than 0.5 μm−1 (low voiding). On the other hand, 14 out of 56 samples (~25%) show high voiding (more than 1.5 μm−1). Among them, eight samples (~15% of the total) show exceedingly high voiding levels or large variations, labeled H in the plot. Such voiding behavior is considered a real risk for solder joint reliability, especially when service conditions involve high temperature (>70 °C) and high mechanical loading such as impact or vibration. The Cu foils exhibit a different distribution mode. In the plot for the Cu foils, nine out of the 45 foils (20%) have a void density less than 0.5 μm−1, and six out of 45 foils (~13%) have more than 1.5 μm−1. The remaining 27 foils (~60%) have a void density in between.
Frequency plots of PCB and foil samples.

B. Voiding eliminated by preannealing
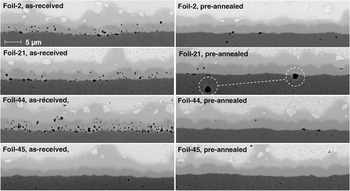
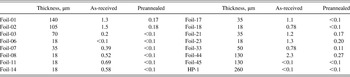
Sixteen different electrodeposited foils were assessed in terms of effects of a high temperature anneal before soldering. Preannealing at 650 °C for 2 h was seen to reduce the subsequent voiding level significantly for all the foil samples tested, except those with a minimal propensity for voiding in the first place. In the latter case the annealing did not alter the voiding behavior. Comparisons of voiding behavior with and without preannealing are shown in Fig. 7 for Foil-2, Foil-21, Foil-44, and Foil-45, after aging at 175 °C for 170 h. Table I lists the average void densities for the 16 Cu foil samples after aging with and without preannealing. Three of the samples had a void density less than 0.1 μm−1 already without preannealing. Seven exhibited higher densities without preannealing, but less than 0.1 μm−1 with preannealing. For the remaining six, preannealing reduced the void density by about an order of magnitude (to less than 0.3 μm−1, i.e., from moderate or high to low voiding).
Voiding behaviors of foil samples with and without the preannealing at 650 °C for 2 h. The aging condition was 170 h at 175 °C.

Void density of selected Cu Foils after aging at 175 °C for 170 h, μm−1.Footnote a

a Void density is defined as the number of visible voids per unit length of the Cu/Cu3Sn interface.
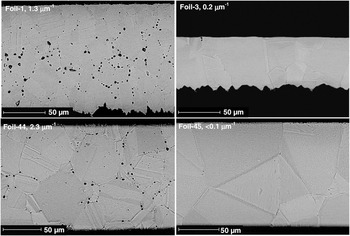
The image for the preannealed Foil-21 shows a large void at the Cu3Sn/Cu interface. Nearby, there is also a similar pore within the Cu, as shown in the white circles. Hereafter the term “pores” is used to describe the features formed within the Cu itself during preannealing, to avoid confusion with the Cu3Sn voids growing during soldering and aging. Apparently the large void at the Cu3Sn/Cu interface results from a preexisting pore (see Section III-C). The image for the preannealed Foil-2 also shows several small pores within the Cu. The nearby voids at the interface are of similar size.
C. Pore formation and grain growth
During preannealing, several foils developed a significant number of pores within the Cu itself, like the ones noted above (Fig. 7). Importantly, this only occurred for those foils that, in the absence of such a preannealing, showed a significant propensity for voiding within Cu3Sn. Thick foils such as Foil-1 and Foil-44 were particularly prone to this. In contrast, negligible pore formation was seen for foils with a comparable thickness but with a low propensity for Cu3Sn voiding, such as Foil-3 and Foil-45. Foil samples less than 50 μm thick did not show much pore formation, regardless of the voiding propensity. Figure 8 shows the pore formation behavior for the four samples. It should be noted that Foil-1 and Foil-3 are ED foils, while Foil-44 and Foil-45 were electroplated in PCB baths. Their as-received grain structures can be found in Fig. 1.
Pore formation and grain growth behaviors of four foil samples after preannealing at 650 °C for 2 h. The void density values here were from as-received foils after aging at 175 °C for 170 h.

When present, the pores had various sizes, up to 5–6 μm in diameter. As shown in Fig. 8 for Foil-1 and Foil-44, the pores are mostly located along Cu grain boundaries and at grain boundary triple junctions. More pores are seen in the interior of the foils than in the regions close to the free surfaces. The extent of pore formation was assessed in terms of area fraction for the two foil samples. Pore diameters in the horizontal direction were measured on two SEM pictures from each sample. The picture resolution was 0.35 μm/pixel. Approximating the pores as circular, the measured diameters were then used to calculate the total pore area fraction. This led to values of 2.9% for Foil-1 and 1.3% for Foil-44. Assuming the pore distribution to be random throughout the foil, this area fraction will be equal to the volume fraction. The calculated pore area fractions, together with the Cu density measurements in Section III-D, provide the most compelling evidence so far for the root causes of Cu3Sn voiding.
Another interesting observation was the difference in Cu grain growth behavior. Annealing at 650 °C, a homologous temperature of 0.68 invariably led to growth of Cu grains. However, as shown in Fig. 8, the more voiding-prone samples (Foil-1 and Foil-44) ended up with smaller Cu grains than foils with a lower propensity for voiding (e.g., Foil-3 and Foil-45). For the ED foils, the average grain size, as measured by the linear intercept method, was 10.4 μm for Foil-1 and 24.8 μm for Foil-3, even though the former is thicker. Normally, thicker foils tend to develop larger grains due to less pinning at the free surfaces. It appears that the grain boundary mobility is somehow reduced in Foil-1 during preannealing. For the PCB foils, the average grain size was 17.4 μm for Foil-44 and 57.6 μm for Foil-45. Finally, preannealing of the high purity foil, HP-1, showed grain growth that far exceeded any of the ED foils and PCB foils. Some grains were 2–3 times the foil thickness (260 μm). Foil samples less than 50 μm thick did not show significant correlation between void propensity and grain growth behavior.
D. Cu volume expansion during preannealing
Cu density measurements were conducted to evaluate the level of plating induced microporosity, and its potential correlation to pore formation. The density data for as-received Foil-1, Foil-44, and Foil-45 is listed in Table II. The values are slightly lower than the bulk Cu value of 8.96 g/cm3.Reference Lide31 For Foil-1 the difference is within the experimental uncertainty and cannot account for the above measured pore volume fraction of 2.9%. For Foil-44 the difference is less than 0.2% while the approximate pore volume fraction was 1.3%. Therefore, it appears that pore formation is not a result of microporosity agglomeration. Also, the low amount of preexisting microporosity does not seem to correlate to the voiding in Cu3Sn.
Cu foil density measured by specific gravity bottle, g/cm3.Footnote a

a The void density values next to the foil names were for the aging condition of 170 h at 175 °C.
In further support of this, the preannealing was found to reduce the densities of Foil-1 and Foil-44 significantly. As shown in Table II, the reduction is 2.2% and 0.9% respectively, in good agreement with the estimated pore volume fractions. On the other hand, Foil-45 did not show much change of density, which is consistent with the negligible pore formation in Fig. 8. The observed density reductions clearly reflect volume expansions during preannealing at 650 °C. We believe that this is a result of gas formation due to decomposition or gasification of organic impurities, leading to pores with internal pressures that exceed the yield stress of Cu at the preannealing temperature. More detailed discussions will be presented in Section IV-A.
E. SIMS results
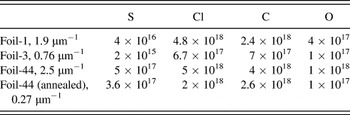
SIMS analyses were done on as-received Foil-1 versus Foil-3, and as-received Foil-44 versus preannealed Foil-44. Table III summarizes the bulk contents of S, Cl, C, and O for the four samples, averaging the depth profiles excluding a near surface region of 2–3 μm. As mentioned above, an acid Cu electroplating bath is typically composed of Cu sulfate (CuSO4), sulfuric acid (H2SO4), chloride ions (Cl–), and proprietary organic additives on the order of mM. Chloride ions are always used in the Cu electroplating bath to work synergistically with large molecular weight polyoxy-alkyl type additives (suppressors), to inhibit the Cu growth rate and texture formation. Another indispensable additive type is sulfur-containing organic compounds, often referred to as brighteners or accelerators, for enhancing the nucleation of Cu grains with random orientation. The measured impurity elements are believed to come mostly from the Cu plating additives and their breakdown products.
SIMS results on Cu foils with various voiding propensities, atom/cm3.Footnote a

a The void density values next to the foil names were for the aging condition of 170 h at 175 °C.
Compared to the high voiding Foil-1, the low voiding Foil-3 had about an order of magnitude lower S, Cl, C, and O content. Preannealing of the high voiding Foil-44 led to only moderate reductions in S, Cl, and C content, despite the drastic reduction of the voiding propensity. One interesting observation was that SIMS spectra of the annealed foil showed huge oscillations in the S, Cl, C, and O signals. The apparent C concentration would, for example, vary between 1016 and 1020 atom/cm3, with a full width half maximum (FWHM) of some peaks as large as ~2 μm. It appears that preannealing led to thermal desorption and redistribution of the impurity elements. The large oscillations are probably related to the annealing grain structure and the accumulation of impurities at grain boundaries.
IV. DISCUSSION
A. Root cause: Impurity incorporation
As shown in Section III-C, those foil samples (e.g., Foil-1 and Foil-44) that showed significant pore formation and impeded grain growth in preannealing also exhibited high voiding propensities. This trend was seen for both ED foils and PCB foils. We believe that specific organic species incorporated into the Cu foils during electroplating led to those behaviors.
The 650 °C preanneal apparently led the codeposited organic species to decompose or gasify, accumulating into pores with internal pressures that exceeded the yield stress of Cu at 650 °C. The pore formation had to work against any densification effects at the preannealing temperature. In powder metallurgy processing, sintering remains a critical step for attaining final product properties.Reference Clark32 The final stage of the sintering process involves the disappearance of pores between metal particles. In order to sustain the shrinkage of pores, the vacancies have to diffuse from the pores to outer surfaces or grain boundaries. We suggest that this explains the observation that more pores are seen in the interior of the foils than in the regions close to the outer surface (Fig. 8), and that it is the reason that thin foils with a high propensity for voiding did not develop a significant amount of pores in preannealing.
In pure metals, grain growth tends to become quantifiable at homologous temperatures above about 0.5 where the grain boundaries have significant mobility. In the case of electroplated Cu, the mode is abnormal grain growth, in which just a few grains grow to large diameters by consuming surrounding fine grains. The grain size distribution is therefore bimodal.Reference Thompson33, Reference Merchant and Merchant34 However, foils with various propensities for Cu3Sn voiding were also seen to exhibit distinctly different grain growth rates, indicating major differences in grain boundary mobility. This could be caused by two different, albeit related, factors. Firstly, once the pores start forming they can retard grain growth by attaching to the moving grain boundaries and being dragged along.Reference German35 Secondly, it has also been reported that impurity accumulation at grain boundaries can inhibit grain growth in electroplated Cu, both at room temperature and at elevated temperatures.Reference Brongersma, Kerr, Vervoort, Saerens and Maex36, Reference Hau-Riege and Thompson37 Application of organic additives in the copper plating solution leads to a reduction in as-deposited grain size to a subcritical value, which then leads to grain growth in as-deposited Cu films even at room temperature, also referred as to self-annealing. As grain growth proceeds at 650 °C, impurities are believed to be rejected by growing grains. Impurity accumulation at the moving boundaries may impede further growth when the concentration reaches a critical limit.Reference Hau-Riege and Thompson37 One way or the other, the impeded grain boundary motion in electroplated Cu seems attributable to organic impurities during Cu electroplating.
SIMS analysis in Section III-E showed a direct correlation between S, Cl, C, and O content and the propensity for voiding, but it did not identify the molecular species involved. Based on the observation of sulfur segregation on the fracture surfaces at the Cu/Cu3Sn interface after mechanical impact testing,Reference Yu and Kim7, Reference Kim, Yu and Kim25 Yu and Kim suggested a correlation between the observed voiding behavior and a sulfur-containing organic additive used for Cu electroplating. However, the additive SPS [bis-(3-sulfopropyl)-disulfide, Na2[SO3(CH2)3S]2] also contains C and O, and no observation of these elements was reported. We suggest instead that the voiding observed in the present study is associated with a complex of Cu+-PEG-Cl– adsorbed on the growing Cu surface. A previous study has shown that voiding can occur in Cu samples electroplated without any sulfur-containing additives.Reference Liu, Wang, Yin, Kondos, Parks, Borgesen, Henderson, Cotts and Dimitrov38 In that study, SIMS depth profiling showed that high-voiding samples had high levels of C, O, and Cl. PEG [polyethylene glycol, HO-(CH2-O-CH2)n-H] is typically used to work synergistically with chloride ions (Cl–) to suppress the growth of Cu grains with preferred orientation.
SIMS analyses of Foil-44 samples showed that the S, Cl, and C levels were reduced by ~50% after preanneal. However, similar to other high voiding foil samples, preannealed Foil-44 had a void density one order of magnitude lower than its as-received counterpart. It seems that the type and distribution of the organic impurities, in addition to the total amount, is also crucial to the void formation. The voiding level reduction by the 650 °C preanneal might well be a result of decomposition of the organic impurities, rather than thermal desorption.
B. Voiding mechanisms
The dominant diffusion species in Cu3Sn has mainly been identified through the study of Cu-Cu6Sn5 diffusion couples. OhReference Oh29 relied on morphological differences to distinguish the Cu3Sn grown by Sn diffusion from that by Cu diffusion. Aging at 320 °C for 317 h yielded a thickness ratio of W Sn:W Cu = 1:4, where W Sn and W Cu are the Cu3Sn thicknesses due to Sn diffusion and Cu diffusion, respectively. Based on that, the ratio of diffusion fluxes was argued to be 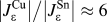 . An inert marker experiment at 400 °C by Onishi and FujibuchiReference Onishi and Fujibuchi39 suggested a slightly faster Cu3Sn growth at the Cu surface than at the Cu6Sn5 interface, that is, it appeared that the Sn flux was comparable to or larger than the Cu flux. PaulReference Paul40 conducted a similar inert marker experiment on Cu-Cu6Sn5 diffusion couples at 215 °C and came to a flux ratio of
 , but questions have been raised on the interpretation of the data.Reference Borgesen, Yin, Kondos, Henderson, Servis, Therriault, Wang and Srihari17 Systematic measurements of void evolution at temperatures between 125 °C and 175 °C suggested a value of W Cu/W Sn > 3, that is, a Cu flux exceeding the Sn flux by an order of magnitude or more.Reference Borgesen, Yin, Kondos, Henderson, Servis, Therriault, Wang and Srihari17 Overall, it is commonly believed that Cu is the dominant diffusion species in Cu3Sn in this temperature range.Reference Shang, Liu, Pang, Li and Shang2, Reference Borgesen, Yin, Kondos, Henderson, Servis, Therriault, Wang and Srihari17, Reference Vuorinen, Laurila, Mattila, Heikinheimo and Kivilahti30 There is therefore a clear driving force for void growth at the Cu/Cu3Sn interface. Vacancies either are sunk at the interface or agglomerate into voids by nucleation and subsequent growth.
Voids do, however, also appear to nucleate at the Cu3Sn/Cu6Sn5 interface and continue to grow there until they are left behind within the growing Cu3Sn layer. As discussed previouslyReference Borgesen, Yin, Kondos, Henderson, Servis, Therriault, Wang and Srihari17 this growth cannot be the result of a Kirkendall mechanism since the growth of Cu3Sn at the Cu3Sn/Cu6Sn5 interface indicates an excess, rather than a depletion, of atoms at this interface. An alternative mechanism for void growth at the interface has been proposed based on vacancy injection associated with the reactive interdiffusion processes.Reference Henderson, Borgesen, Yin and Kondos41 In short, the vacancy supersaturation in reactive systems is sustained by vacancy creation and injection processes associated with intermetallic growth at the interphase interfaces of Cu/Cu3Sn and Cu3Sn/Cu6Sn5.
In spite of driving forces for void growth, the vacancy fluxes resulting from the solid state reactive diffusion in the Cu-Sn system do not always lead to significant voiding. The nucleation of voids in a metal is usually difficult, since it requires the creation of a solid/vapor interface of considerable curvature. Once nucleated, on the other hand, even small voids may actively compete with the crystallographic sinks in the vacancy sinking process and as a consequence grow in size.
There are two possible scenarios by which impurities could induce void nucleation and subsequent growth during thermal aging. In the first one, a high level of vacancy supersaturation, necessary for void formation, may result from vacancy sinks being blocked by impurity molecules, where sinks can be dislocations, interfaces, and grain boundaries. In a recent study,Reference Shang, Liu, Li and Shang1 a dense population of voids was observed along the Cu/Cu3Sn interface after aging of solder joints made between eutectic SnBi alloy and OFHC (oxygen free high conductivity) Cu. No voids were seen in aged solder joints made between pure Sn and OFHC Cu. Segregation of Bi was observed at the interface by TEM, suggesting that Bi segregant atoms may pin the interfacial misfit dislocations whose climb otherwise serve to absorb (sink) Cu vacancies. Secondly, impurities codeposited during electroplating might promote the heterogeneous nucleation of voids by changing the interfacial energies at locations such as grain boundaries, thus significantly reducing the activation energy required for nucleation under vacancy supersaturation conditions. It is also possible that the two scenarios coexist.
C. Remedies
It appears that identification of the degree to which various species are incorporated in the electroplated Cu would be essential to control the voiding propensity. Notwithstanding the considerable number of papers published on acid copper plating and the relatively widespread use of such bath chemistries, a full understanding of the electrochemical processes is currently lacking and remains an active research area.Reference Moffat, Wheeler and Josell42–Reference Tan, Guymon, Wheeler and Harb47 It is commonly known that excess incorporation has a harmful impact on Cu plating quality parameters such as tensile strength and ductility. Based on the quantitative SIMS analysis presented in Section III-E, we suggest that impurity levels on the order of tens of parts per million may result in unacceptably high propensities for voiding. At such low levels, a strength or ductility test might not detect any noticeable degradation. Better monitoring of the Cu plating process is therefore needed to prevent sporadic voiding in the interfacial IMC Cu3Sn layer in solder joints.
Due to the complex nature of plating additive chemistries used for microelectronic applications, and the fact that most of the commercial additives are proprietary, a fundamental study is difficult, yet needed, to identify and control the specific chemical species responsible for voiding. Thus, the only process details available for Foil-44 and Foil-45, two commercial samples from the same supplier that showed extremely different propensities for voiding, were that the two additive packages were used respectively, and the former was deposited by pulsed plating and the latter by direct current. Our previous electroplating studies of generic organic additives have revealed a critical dependence of voiding level on additive chemistry, current density, bath temperature, and so on.Reference Liu, Wang, Yin, Kondos, Parks, Borgesen, Henderson, Cotts and Dimitrov38, Reference Wafula, Liu, Yin, Bliznakov, Borgesen, Cotts and Dimitrov48, Reference Liu, Yin, Bliznakov, Kondos, Borgesen, Henderson, Parks, Wang, Cotts and Dimitrov49 In addition, the crystallographic orientation of the growing Cu layer has been shown to play an important role in impurity incorporation. We defer the detailed discussions and a unified hypothesis to a forthcoming paper.Reference Yin, Dimitrov and Borgesen50
V. CONCLUSIONS
A total of 103 Cu samples from various sources were characterized in terms of propensity for voiding within the Cu3Sn layer after soldering. Both ED foils and PCB samples exhibited voiding levels ranging from negligible to exceedingly high, under the same thermal aging conditions, implying that a Kirkendall effect is not enough to lead to voiding. As shown by the preannealing experiments, the root cause of voiding appears to be excess organic impurity incorporation during Cu electroplating. For high-voiding foils, preannealing led to not only dramatic reduction of the subsequent voiding level, but also extensive pore formation within the Cu and impeded Cu grain growth. The observed pore formation was accompanied by volume expansion, indicating gas bubble formation by impurity decomposition at 650 °C. Alternative voiding mechanisms were proposed, according to which organic impurities may lead to void nucleation during thermal aging by blocking vacancy sinks and/or lowering the nucleation barrier.
ACKNOWLEDGMENTS
This work was funded by the Advanced Research in Electronics Assembly (AREA) Consortium. The authors thank Christopher Parks at IBM Hopewell Junction for the SIMS analysis, as well as Dr. Pericles Kondos (Universal Instruments), Dr. Donald Henderson (IBM), Prof. Nikolay Dimitrov, and Prof. Eric Cotts (Binghamton University) for helpful discussions. The authors also thank Joseph Therriault, Ju Wang, and Mao Gao (Binghamton University) for their assistance with sample preparation and void measurements.