It follows that … democracy is less of a fraud than it sometimes seems. A foreign observer sees only the huge inequality of wealth, the unfair electoral system, the governing-class control over the press, the radio and education, and concludes that democracy is simply a polite name for dictatorship. But this ignores the considerable agreement that does unfortunately exist between the leaders and the led.
George Orwell ([1941] Reference Orwell2005, 27)
A variety of measures indicate that income inequality has grown significantly in the United States during the last three decades (APSA 2004; Brandolini and Smeeding Reference Brandolini and Smeeding2006). In a flurry of recent research, scholars have attributed this trend to the failure of the national government to represent the preferences of ordinary citizens in general and less wealthy citizens in particular (APSA 2004; Bartels Reference Bartels2004; Reference Bartels2006; Gilens Reference Gilens2005), who participate in politics less consistently and contribute fewer resources to political candidates than their wealthier peers (Verba, Schlozman, and Brady Reference Verba, Schlozman and Brady1995). The American Political Science Association's (APSA) Task Force on Inequality and American Democracy summarizes this representative failure hypothesis: “disparities in participation ensure that ordinary Americans speak in a whisper while the most advantaged roar” (2004, 2).
At first glance, this conclusion seems at odds with much of the empirical literature on political representation in the United States. This line of research suggests that policymaking is broadly democratic and that, at least in general terms, elected officials take account of the mass public's preferences when making policy (e.g., Erikson, MacKuen, and Stimson Reference Erikson, MacKuen and Stimson2002; Page and Shapiro Reference Page and Shapiro1983; Wlezien Reference Wlezien1996). But most studies of dynamic representation focus on responsiveness to the mass public's aggregate preferences, and thus do not address the consequences of heterogeneity in this aggregate opinion or the possibility of inequality in policymakers' responsiveness to public opinion. There is little evidence, in other words, to indicate whether aggregate responsiveness masks disproportionate attention to particular types of citizens—in this case, the more politically active and more economically well-off. If findings of aggregate representation obscure disproportionate representation of the preferences of certain citizens, both the substantive and normative implications of the broad literature on democratic representation and mass-elite linkages are called into question.
Assessing the representative failure hypothesis requires an understanding of whether citizens in different income strata, in fact, send substantively different policy signals to elites, and whether officeholders pay disproportionate attention to the preferences of certain types of citizens when making policy. In other words, the representative failure hypothesis raises two questions: Do the policy preferences of Americans vary across income cohorts? And, is government differentially responsive to the preferences of wealthier citizens?
Here, we take up these questions using time-series methods that are novel to the assessment of the representative failure hypothesis. First, using data from the General Social Survey, we construct a measure of aggregate public opinion liberalism on spending and social welfare issues. Next, we disaggregate our measure of opinion liberalism into time series of opinion liberalism for each income quartile. We then use these data to assess the extent to which preferences for government spending and welfare programs—and over-time changes in these preferences—vary across income groups and to model governmental responsiveness to public opinion change across the various groups.
We find that time series of policy sentiment are quite similar across income cohorts and correlate highly over time, though there is unique variance in each group's preference series that appears to be systematically related to income level. However, we find little evidence that national policymaking responds differentially to the preferences of any income group. To the extent that there are meaningful differences in the dynamics of the income quartiles' policy liberalism series, the differences are not reflected in the policymaking activity of Congress. We conclude that government responds to the preferences of all income cohorts either because policymakers cannot discern the modest differences between the preferences of richer and poorer Americans or because officeholders (strategically or sincerely) tend to represent the entire public's preferences. Therefore, while differences in the political representation of citizens' objective “best interests” may still exist, these differences appear to be the result of the broadly similar signals that citizens of all groups send to government rather than the product of a pattern of representative bias on the part of elected officials.
Inequality and Representative Failure
By almost any measure, income inequality in the United States has grown steadily since the mid-1970s, and the U.S. now has the “highest level of inequality in disposable incomes among rich nations” (Brandolini and Smeeding Reference Brandolini and Smeeding2006, 25). While some question the importance of this trend (Weissberg Reference Weissberg2006; Welch Reference Welch1999), the APSA Task Force on Inequality and American Democracy links growing inequality to declining trust in government and potential for social unrest. In that vein, Bartels (Reference Bartels2006) envisions a threat from “cracks in the levees separating our putatively democratic political system from the powerful waters of a vibrant capitalist economy” (39).
Economists have identified a number of factors that may contribute to rising inequality, including “changes in industrial structure, increased foreign trade, increased immigration, skill-based technical changes, and the decline in institutions that limit the market” (Gottschalk and Smeeding Reference Gottschalk and Smeeding1997, 646). While many of these explanations are beyond direct government control, political scientists have shown that government management of the economy and redistributive policymaking can also have important effects on income inequality. For example, numerous studies demonstrate that Democratic control of government is associated with a short-run reduction in unemployment at the expense of increased inflation while Republicans tend to implement policies that reduce inflation at the cost of higher unemployment (e.g., Hibbs Reference Hibbs1977).
More importantly to the issues here, Kelly (Reference Kelly2005) shows that there is a dynamic, negative relationship between policymaking liberalism and income inequality. As the public becomes more liberal on issues of spending and social welfare, the government takes greater action to distribute benefits and redistribute wealth, producing reductions in income inequality. Kelly provides evidence of a link between public opinion liberalism and reduced income inequality, mediated by government intervention in the economy through regulation and redistribution.
The joint observations of growing inequality and the availability of political tools to address the problem create a puzzle: why has the national government failed to do more to equalize incomes? One answer, provided by the APSA task force and others (Bartels Reference Bartels2004; Reference Bartels2006; Gilens Reference Gilens2005), is that growing inequality has proceeded without substantial government intervention because the preferences of lower-income citizens are underrepresented in national policymaking. The APSA task force attributes this representative failure to low levels of political participation among low-income citizens, who are relatively unlikely to vote or contribute time or money to campaigns or interest groups (Verba, Schlozman, and Brady Reference Verba, Schlozman and Brady1995). The task force concludes that “the concerns of lower or moderate income Americans … are systematically less likely to be heard by government officials” (2004, 11).
While socioeconomic biases in political participation are undeniable, the case for differential political responsiveness to various income groups is more complex than advocates of representative failure have suggested. First, to the extent that officeholders are reelection seekers (Mayhew Reference Mayhew1974), they may have incentives to appeal to the preferences of all of their constituents—not solely those who vote at a single point in time. Thus, strategic officeholders may attend to the views of citizens who are only sporadic political participants, forestalling the entry of challengers who could mobilize disaffected constituents and limiting the ability of opponents to mobilize antagonistic nonvoters into the electorate (Canes-Wrone, Brady, and Cogan Reference Canes-Wrone, Brady and Cogan2002; Rothenberg and Sanders Reference Rothenberg and Sanders2000).
At the same time, work on “turnout effects” suggests that biases in political participation are not often consequential in American election outcomes and, further, that the issue preferences of more and less involved citizens may not differ sufficiently for policymakers to be able to respond to a certain types of citizens and not to others. Along these lines, some studies suggest that the policy preferences of nonvoters—at least on issues of social welfare and economic redistribution—are more liberal than those of voters (e.g., Bennett and Resnick Reference Bennett and Resnick1990). But these conservative biases in the electorate are small and inconsistent over time (Highton and Wolfinger Reference Highton and Wolfinger2001).Footnote 1 Thus, socioeconomic differences between voters and nonvoters may not translate into meaningful differences in policy preferences, and to the extent that various socioeconomic or participatory groups send similar signals to policymakers, it may be largely irrelevant that one group might “roar” while another “whispers.”
Likewise, much empirical work generally challenges the idea that greater electoral participation would dramatically change the outcomes of American elections or public policy, finding that increasing voter turnout would sometimes increase Democratic vote share, but that the effects are inconsistent and often modest (e.g., DeNardo Reference DeNardo1980; Nagel and McNulty Reference Nagel and McNulty1996; Tucker and Vedlitz Reference Tucker and Vedlitz1986). Concurrently, Ellis, Ura, and Ashley-Robinson (Reference Ellis, Ura and Ashley-Robinson2006) find that policymaking activity in both houses of Congress is similarly responsive to the policy preferences of voters and nonvoters. Taken as a whole, this work indicates that the voting public is somewhat more affluent and conservative than the nonvoting public but that these differences may not be consequential for election outcomes or policy outputs.
Income and Dynamic Representation
Bartels (Reference Bartels2006) provides analytic criteria by which a government's responsiveness might be judged:
Let us stipulate that “responsive government” implies a systematic correspondence between the preferences of citizens and the policies adopted by their elected representatives. Let us further stipulate, following Dahl that “a key characteristic of a democracy is the continuing responsiveness of the government to the preferences of its citizens, considered as political equals.” (39)
This suggests that, at a minimum, government must take into account the preferences of all types of citizens when deciding upon the broad contours of public policy, not just the richest or most politically involved. When the preferences of one segment of the population change, government should respond to that change in rough proportion to the group's size within the polity as a whole. In the context of assessing the representative failure hypothesis with respect to income inequality, these standards indicate a need to measure policy preferences (particularly with respect to government spending and redistribution) across various income cohorts and to estimate the relationship between those measures and some indicator government policymaking.
A growing body of research suggests that the process through which preferences are represented is dynamic—that is, changes in public preferences produce future changes in policy outputs (Erikson, MacKuen, and Stimson Reference Erikson, MacKuen and Stimson2002; Wlezien Reference Wlezien1995; Reference Wlezien1996). The most effective way to understand how policy outputs respond to—not simply correspond to—the preferences of different groups of citizens is to analyze the dynamic response of government to various groups of citizens. If richer and poorer citizens' preferences react to changes in the political or economic environment in dissimilar ways, for example, to whom does government respond?
Although useful in providing a baseline to understand how public opinion affects policy over time, existing studies of dynamic representation are of little direct value in assessing representative failure. The bulk of these analyses focus solely on the effects of changes in aggregate public opinion, implicitly assuming that, when adjusting policy to more closely match the changing preferences of the mass public, policymakers take account of the preferences of the entire citizenry. As the representation failure hypothesis suggests, it is possible that elected officials respond to the opinion dynamics of wealthier citizens alone. Evidence of aggregate responsiveness public opinion may therefore mask heterogeneity in policy sentiment and government responsiveness: in this case, the possibility that wealthier and poorer citizens send different cues to policymakers and that only the preferences of upper-income citizens matter to policymakers. The clear differences in how citizens across different income and demographic cohorts view the political world and form opinions on political issues suggest that the potential for such heterogeneity is strong.
Though extant studies of dynamic representation are silent on questions of unequal representation, they can provide some benchmarks for understanding how different groups of citizens get their preferences represented in policy. In this spirit, our goals are to use longitudinal data to understand whether income groups send different policy preference cues to government over time and whether elected policymakers disproportionately respond to the views of one group or another in making policy decisions.
We proceed in two steps. First, we use data from the General Social Survey (GSS) from 1974 to 2004 develop a global measure of the public's preferences for government spending and social welfare issues. We then disaggregate this measure into a time series for each income quartile of GSS respondents so that we may assess differences between the series—the extent to which these income groups hold different preferences on this issue dimension. Next, we replicate Erikson, MacKuen, and Stimson's (Reference Erikson, MacKuen and Stimson2002) models of dynamic representation for each house of Congress, replacing Stimson's (Reference Stimson1999) mood metric with our measure of public opinion. This allows us to test the dynamic relationship between public opinion and policy for each income group.
Measuring Policy Preferences across Income Groups
Perhaps the most widely used measure of public preferences in work that examines the dynamics of mass-elite relationships with respect to representation is Stimson's (Reference Stimson1999) policy mood. Mood is an aggregate indicator of the structure and change of mass policy preferences on the dominant dimension of political conflict, typically recognized as the “liberal-conservative” debate over the size and scope of the federal government and its role in redistributing wealth and regulating the economy and is used by many researchers who wish to understand the effects of changes in mass policy preferences on elite behavior. Mood is particularly pertinent to this analysis since it deals primarily with issues of the government's role in the economy, and has been widely used to model the public's role in affecting the policymaking activity of the federal government (see Erikson, MacKuen, and Stimson Reference Erikson, MacKuen and Stimson2002; Kelly Reference Kelly2005).
Because mood is constructed from aggregate survey marginals, it cannot be decomposed into component parts of interest: in this case, into time series of the policy preferences of various income groups. However, the measure can help to validate alternative time serial measures of public sentiment. A measure that correlates strongly with mood can be considered a valid measure of the underlying concept of “public policy sentiment,” even if the measure is comprised of a far smaller battery of issues than mood itself. In order to assess the government's differential responsiveness to various income groups, we produce a proxy for the concept of mood that can be disaggregated to examine the dynamics of policy sentiment on scope-of-government issues across income groups.
In each administration from 1974–2004, the GSS asked 10 issue questions related to respondents' preferences for government spending on a variety of issues encompassing much of the federal government's role in distributive and redistributive policy.Footnote 2 We coded the responses to each of these questions for liberal-conservative content, with the most liberal possible answer receiving a score of 1, and the most conservative possible answer receiving a score of 0 (Question wording and coding is available in Appendix A available at http://dvn.iq.harvard.edu/dvn/dv/jura).Footnote 3 We then averaged the responses to each question to create a measure (bounded, like mood, between 0 and 1, with higher values indicating more liberal preferences) of policy sentiment for each respondent. We then took the mean of these individual scores for all respondents in each survey year to create a single measure of public policy preferences for each GSS survey year.Footnote 4
This 10-issue measure of policy preferences correlates with Stimson's policy mood at 0.82 (Figure 1). Also, since our measure of aggregate policy preferences has been constructed from questions that investigate respondents' preferences for government spending, it, like mood, may be taken as an indicator of the public's relative preferences for larger government—that is, preferences over the size and scope of the federal government and its role in providing social services. Given our substantive interest in government responsiveness vis-à-vis the public's preferences for policies that might affect income inequality, our measure of public sentiment builds on a logical set of issue-specific items focusing on spending, redistribution, and social services.
Stimson's Mood and 10-Issue GSS Policy Liberalism Index
Source: General Social Survey Cumulative File and the web site of James Stimson (http://www.unc.edu/~jstimson).

This indicator allows us to measure policy sentiment across various income groups since it is comprised of questions that are common to all respondents in all GSS survey years. Our measure of policy liberalism can be disaggregated into any level of analysis by changing the number and type of respondents over which the measure is aggregated. Using (self-reported) real family income, we are able to construct time series of the policy preferences various income cohorts, creating four separate time series using the techniques described above, one for each income quartile of GSS respondents.
Policy Liberalism by Income Quartile
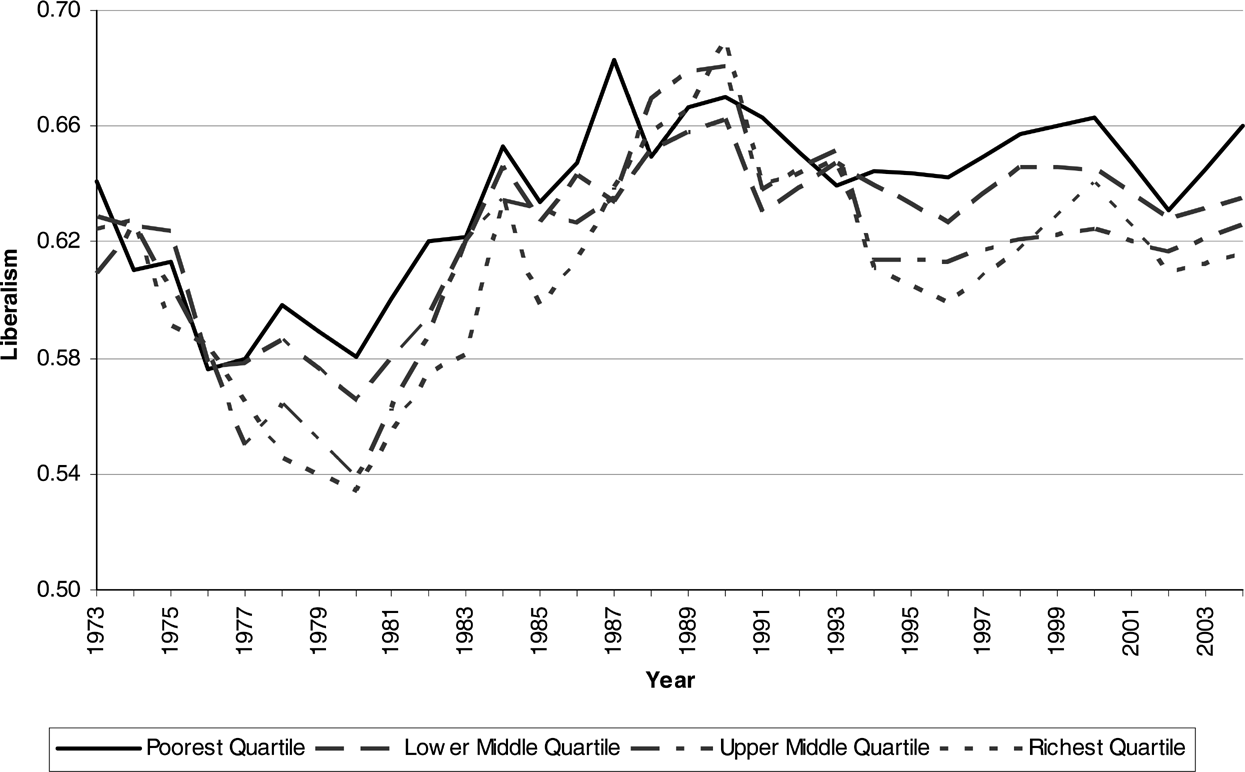
Time series of the policy preferences of the income quartiles using our proxy for mood are shown in Figure 2. As we might expect, the preferences of higher-income respondents are typically more conservative than those of lower-income respondents. For example, the wealthiest quartile is more conservative than the poorest quartile in 17 out of 23 GSS survey years. However, the differences between groups are quite modest. The total over time range within each group is about 9 to 14 points, while the mean difference between groups is approximately one-half to two points and is never greater than five percentage points between any two groups in any year. Likewise, the relationship between income and liberalism is inconsistent. The difference between the richest and poorest quartile is statistically distinguishable from zero in only 11 of the 23 survey years: in six years, the poorest citizens are slightly, though not significantly, more conservative than the richest. Wealth is negatively related to preferences for more government spending, but this relationship is marginal at most.
10-Issue GSS Policy Liberalism by Income Quartile
Source: General Social Survey Cumulative File.

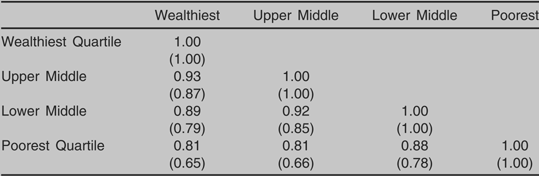
In terms of dynamics, the most obvious feature of the time series is the similarity among the various income groups' preferences. In addition to the similarity in the level of the groups' opinion liberalism, the various preferences time series also track closely together over time. Table 1 presents a correlation matrix among the preference series, showing bivariate correlations ranging from 0.81 to 0.93, indicating substantial similarity in the underlying mechanics of these series. Changes in public mood over time occur for a variety of political and economic reasons (Erikson, MacKuen, and Stimson Reference Erikson, MacKuen and Stimson2002; Wlezien Reference Wlezien2004), and these data suggest that citizens in each income quartile react in broadly similar ways to political and economic stimuli.Footnote 5
Income Cohort Policy Preferences Correlation Matrix

Note: Squared Correlations in Parentheses
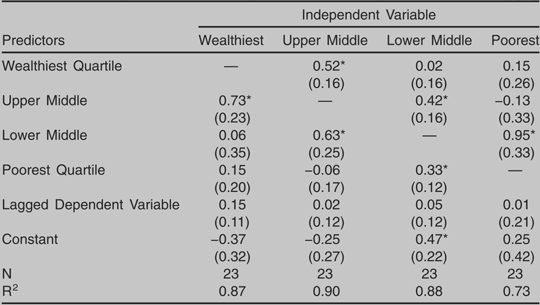
While the over-time similarity among the series is clear, this commonality is not the only important feature of these series. Despite moving together over time, each series exhibits some unique variance. Though our relatively small sample sizes make definitive inferences difficult, the evidence suggests that this unique variance appears to be systematically related to social class. Table 2 reports results for four OLS models, in which each of the income series is regressed on the remaining three and its own lagged value. The values for each income series are significantly predicted by the income quartile(s) most similar to itself—and not by any other series. When controlling for all of the series, one can predict the preferences of the richest group of citizens in a given year, in other words, by the values for the upper-middle quartile—but not from the two poorest groups. One can predict the values for the upper-middle quartile from the richest and lower-middle quartiles—but not the poorest, and so on. When controlling for each of the other series, in other words, preferences of the poorest citizens have far more in common with preferences of the lower-middle quartile than they do with the richest quartile, and vice versa. So, while high correlations between the series indicate a dominant trend of over-time similarity, each series retains unique variance, which may indicate politically important differences in how the income affects Americans' responsiveness to political and economic stimuli
Regression Analyses of Income Cohort Policy Preferences

Notes: Standard errors in parentheses.
* p < .05 (Two-tailed tests).
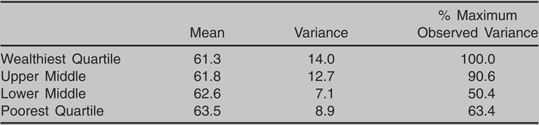
One process that may yield such differences across income groups is the effect of political sophistication on respondents' abilities to observe and react to the political and economic world. Given the well-established relationships among income, education, and sophistication, it is reasonable to suspect that those in the wealthiest cohort may be paying the greatest amount of attention to changes in the political and economic context and updating their own preferences accordingly (see also Enns and Kellstedt Reference Enns and Kellstedt2007). To assess this idea, Table 3 reports the mean, variance, and relative variance (each series' variance expressed as a percentage of the maximum observed variance among all four series) for each of the four income quartiles' preference series.
Mean, Variance, and Relative Variance of Income Cohort Policy Liberalism

As we expect, the wealthiest quartile's policy liberalism is the most active, indicating greater responsiveness to relevant political and economic stimuli (Erikson, MacKuen, and Stimson Reference Erikson, MacKuen and Stimson2002). Likewise, the upper-middle and lower-income quartiles exhibit decreasing variance relative to the highest income cohort. The negative relationship between income and variance is, however, disturbed by the poorest quartile, whose aggregate policy liberalism is marginally more variable than the lower-middle cohort's. Also, while the highest income cohort's aggregate policy liberalism is the most variable over time, none of the remaining series have less than half of its variance.
Assessing Differential Responsiveness
We began by asking two questions: Do the ideological policy preferences of Americans vary across income cohorts? And, is government differentially responsive to the preferences of wealthier citizens? The data indicate that answer to the first is a qualified yes. While the dominant finding is one of similarity—each income quartiles' aggregate policy liberalism correlates highly with the others over time—there are also systematic differences in the both the variance and over-time movement of the preference time series. With these figures in hand, we now turn to an analysis of responsiveness: the degree to which each Congress responds to changes in the preferences of the four income groups.
Perhaps the most comprehensive study of policy responsiveness is Erikson, MacKuen, and Stimson's (Reference Erikson, MacKuen and Stimson2002) work on the relationship between public opinion and policy activity in the United States. Using multi-indicator measures of policymaking activity, these scholars analyze the dynamic relationship between public opinion (and other electoral and contextual variables) and policymaking. Although differences exist across branches of government (and houses of Congress), they generally find that national-level policymakers do respond, quite dramatically, to changes in public sentiment.
We use these analyses as a template for modeling the degree to which policymakers respond differently to preferences of various income groups, estimating the dynamic relationship between the policy preferences of each income quartile and the policy activity in both the House of Representatives and Senate. In effect, we estimate the independent effects of each income group's preferences on public policy (controlling for other relevant electoral characteristics), substituting our 10-issue proxy measures for mood itself. We restrict our analysis to the years 1974–1996, the years in which both GSS and policymaker liberalism data are available. The dependent variables in the analyses to follow are House and Senate policy liberalism scores created using the same indicators of policy activity liberalism as Erikson, MacKuen, and Stimson. The dependent indicators for both the House and Senate include measures of average of House (Senate) ADA/ACU scores, the percentage of ideological votes won by liberals, and median size of the “liberal” coalition on ideological votes.
As in Erikson, MacKuen, and Stimson (Reference Erikson, MacKuen and Stimson2002), models of House and Senate liberalism are estimated using the DYMIMIC Kallman Filter setup (Beck Reference Beck1990). This method essentially allows for the one-step estimation of both principal components analysis (since each of our dependent variables is composed of multiple indicators) and regression of independent variables on the dependent concept of interest. Each component of our dependent indicators loads strongly on a single dimension, suggesting that each of the indicators tap the same latent concept of policy liberalism.
Analyzing the independent effects of income cohorts' policy preferences for both the House and the Senate is especially useful in light of the fact that Erikson, MacKuen, and Stimson find that aggregate public opinion does have important effects for policymaking in the House, but it does not have an independent impact on the actions of the Senate. We test whether these aggregate results mask heterogeneity in how legislative bodies respond (or do not respond) to the changing preferences of across income groups. If the representative failure hypothesis is correct, we expect to see that the impact of wealthier GSS respondents' preferences on policymaking is stronger than that of lower income respondents' preferences in the House. Also, we might find evidence that preferences of wealthier citizens influence Senate policymaking in some way that was obscured in MacKuen, Erikson, and Stimson's analyses. On the other hand, if the perspective derived from the participation effects literature holds, we expect to find no differences in House responsiveness to any income group nor any evidence that any income group's preferences predicts Senate policymaking.
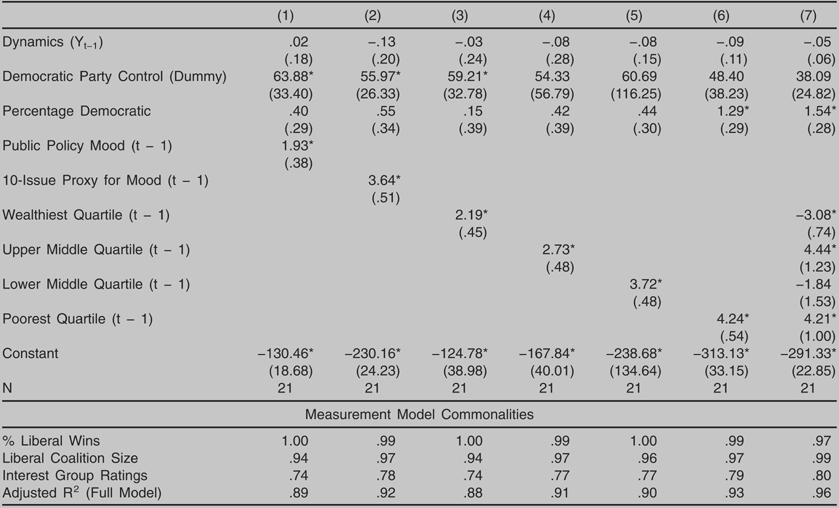
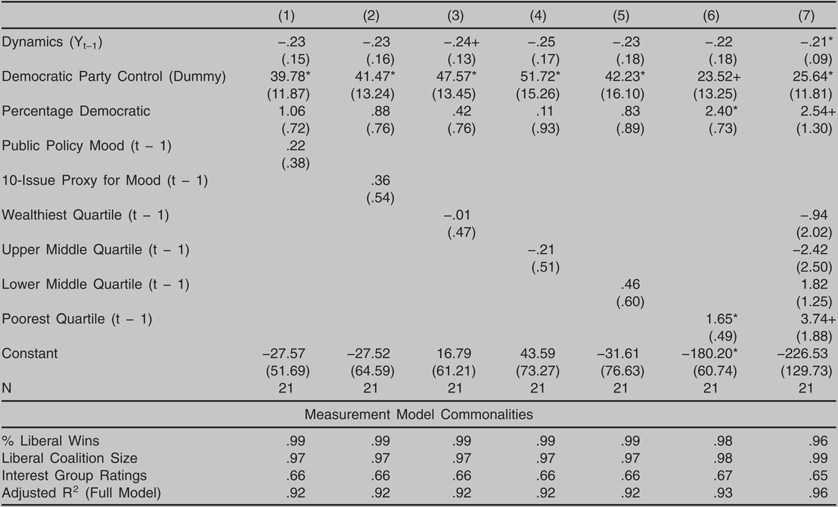
The results are presented in Tables 4 (the House of Representatives) and 5 (the Senate). Each table contains seven columns of coefficients. The first is a replication of Erikson, MacKuen, and Stimson's analyses for the restricted time frame we cover in this analysis. The second substitutes our aggregate proxy measure of policy sentiment for policy mood. The next four include only the policy sentiment measures of a single income cohort, starting with the wealthiest quartile and proceeding in order to the poorest. The final (seventh) column reports the results of the models estimated with all income cohorts' policy liberalism measures included as unique independent variables.
Policy Activity in the House of Representatives, 1974–1996

Notes: Standard errors in parentheses.
* p < .05 + p < .10, (Two-tailed tests).
Policy Activity in the Senate, 1974–1996

Notes: Standard errors in parentheses.
* p < .05 + p < .10, (Two-tailed tests).
In the House, aggregate policy sentiment (using either our 10-issue measure or mood) is a reliable and powerful predictor of policy activity. But there is little evidence to suggest that this responsiveness is driven by disproportionate attention paid to the preferences of any income group. When entered into separate models, the effects of each income quartile's preferences are quite similar—in fact, they are statistically indistinguishable. All are positively and significantly related to policymaking liberalism in the House. As one might expect, the model performs erratically and standard errors become inflated when all four highly correlated series are included as predictors simultaneously: the point estimates in this combined model should not be taken too seriously. Nevertheless, the failure of any one series, or theoretically sensible set of series, to dominate the results suggests that, as a practical matter, income groups' preferences are indistinguishable to policymakers in the House of Representatives. We replicate, in other words, Erikson, MacKuen, and Stimson's find that the House is responsive to the preferences of the aggregate public. But the implications of heterogeneity across income groups to this aggregate finding are minimal: we find no evidence to support the representative failure hypothesis.
Consistent with the findings of Erikson, MacKuen, and Stimson (Reference Erikson, MacKuen and Stimson2002), Table 5 suggests that aggregate public policy sentiment plays little direct role in the policy activity of the United States Senate. Neither Stimson's mood nor our aggregate 10-issue liberalism indicator significantly predicts Senate liberalism, indicating that public control over the Senate is largely a function of electoral replacement. When entered into separate models, three of four income quartile's preferences fail to demonstrate a significant relationship with Senate policy activity. Only the preference indicator for the poorest income quartile corresponds significantly with Senatorial policymaking. Likewise, in a model containing the preferences of all income groups simultaneously, the preference liberalism of the lowest income quartile continues to significantly and positively predict Senate liberalism while the other income group's preferences fail to do so. This is, of course, most likely an artifact of the collinearity between the groups—including four different measures of public preferences, highly correlated with one another, might yield a single significant result by chance. But whether we accept the result as a matter of chance or as the product of a causal relationship, the more important point in this context is that there is no evidence that the Senate responds disproportionately to the preferences of wealthier citizens. Again, the data do not support the representative failure hypothesis.
Taken together, the House and Senate results provide little support for the representative failure hypothesis. While our models generally confirm the Erikson, MacKuen, and Stimson's results that the House is dynamically responsive to public opinion to a much larger degree than the Senate, we also find that these patterns of responsiveness and non-responsiveness do not discriminate on the basis of income. In sum, while other evidence indicates that a failure to represent the preferences of poor Americans lies at the heart of growing inequality, our results suggest that the preferences of all income groups are quite similar over time and that government appears responsive to the aggregate preferences of Americans regardless of their income.Footnote 6
Conclusions
Drawing on the General Social Survey, we construct an aggregate measure of public opinion liberalism that correlates highly with Stimson's (Reference Stimson1999) mood. Using respondents' self-reported incomes, we are able to disaggregate dynamic policy preferences for government spending by income quartiles. We find a general tendency for wealthier citizens to be more conservative than poorer citizens, though this relation is inconsistent over time. While the series are very strongly related to one another over time, we also find marginal differences in the variances of each time series, indicating that income groups may be somewhat differentially responsive to political stimuli.
Despite these modest differences, we find no evidence that government is disproportionately responsive to wealthier citizens. These results confirm the theoretical insights of dynamic representation, but also suggest that policymakers in both houses respond relatively equally to citizens of all income quartiles. We also recover Erikson, MacKuen, and Stimson's (Reference Erikson, MacKuen and Stimson2002) finding that the Senate is not responsive to aggregate public opinion outside the electoral process. However, these aggregate results do not mask income effects: the Senate does not respond to the preferences of wealthier citizens alone.
At a minimum, these results contradict current statements of the representative failure hypothesis. We find no evidence that the preferences of wealthier citizens predict policymaking activity more strongly than those of poorer citizens. This finding can be explained in two ways. First, office seekers must ultimately win elections, which require appeals to both wealthier, more politically stable, citizens and to poorer, more politically malleable, constituents. Indeed, this latter group may require the most attention since its electoral choices are generally more variable over time (DeNardo Reference DeNardo1980), creating opportunities for strong challengers to attract and mobilize support.
Alternatively, given the degree of collinearity between preferences on this dimension among citizens of all income groups, it may be simply impossible for elected officials to perceive and react differently to the “scope of government” preferences of different income groups. One can ascribe whatever motive—altruism, vote-maximization, or something else—one wants to the preferences of elected officials, but the strong correspondence between preferences among citizens of all income groups may make it extremely difficult for legislators to represent one socioeconomic stratum without representing the others, if only coincidentally. While income groups may have different objective economic interests, the cues that they send to policymaking elites with respect to the size and scope of government may be too similar to distinguish in any meaningful way.
However, our results should not be taken as evidence that citizens of all income levels are represented equally at all times and in all places. Indeed, we believe that the limitations of this work provide a basis for exploring more nuanced analyses of the political origins of rising income inequality. More modest claims of differences in class-based attitudes and policymaking responsiveness at particular times or on specific issues may well have support, and future work should examine the potential for disparities in representation in these more limited domains.
Further, our results certainly do not preclude claims that poorer citizens' interests are represented considerably less well by public policy. But they do indicate that the pathway suggested by the representative failure hypothesis is incomplete. If we assume that poorer Americans should prefer higher levels of government distribution and redistribution than wealthier Americans, the most important aspect of unequal representation is not the actions of policymakers, but the preferences of citizens—why different groups, with considerably different economic interests, hold similar preferences. Understanding how Americans view their political choices vis-à-vis their economic interests is the critical direction for future research that emerges from this project. Bartels (Reference Bartels2005) makes an important inquiry in this direction, investigating why public support for President Bush's 2001 tax cut proposal was so widespread despite the fact that the tax cut disproportionately benefited wealthier Americans. Although subjective in many respects, investigating the possibility of information effects and “misguided self interest” among lower-class citizens—and how these may have changed over time—may be much more important in understanding the political origins of growing inequality than most current statements of the representative failure hypothesis allow.
Finally, we note that our paper points to encouraging new directions for dynamic political analysis more generally. While existing studies of macro politics explore general relationships between government and the governed, most have not attempted to account for heterogeneity in either public opinion or in government responsiveness to various groups within the mass public. Here we have explored the implications of these concerns on a particular dimension (social welfare) and with respect to one division in the public (income), but a variety of other cleavages deserve similar attention. Pursuing research that integrates important macro-political concepts with insights from the micro-level literature on opinion formation and opinion change, this type of work is well suited to bridge the gaps between scholars of individual behavior and those of aggregate processes, answering important substantive questions about the circumstances in which different political, economic, and social groups' preferences are represented in the policymaking processes.