1 Introduction
Phonetic parameter values typically vary across instantiations of a given phonological form. Despite variation from numerous sources such as phonetic context, speech rate and talker identity (e.g. Allen et al. Reference Sean, Miller and DeSteno2003, Repp Reference Repp1982 and Smith Reference Smith2002), it is often possible to identify ranges of phonetic values that may function under some conditions as heuristics for a particular phonological structure. In the case of syllables, phonetic heuristics are often temporal in nature. For instance, the acoustic duration of syllable rhymes has been correlated with syllable weight (Broselow et al. Reference Broselow, Chen and Huffman1997, Gordon Reference Gordon2002; see also Nam Reference Nam, Cole and Hualde2007). Syllable position, onset vs. coda, has been linked to the relative timing of articulators (Krakow Reference Krakow1989, Reference Krakow1999, Sproat & Fujimura Reference Sproat and Fujimura1993, Waals Reference Waals1999, Gick et al. Reference Gick, Campbell, Oh and Tamburri-Watt2006, Byrd et al. Reference Byrd, Tobin, Bresch and Narayanan2009) and the acoustic duration of segments (Boucher Reference Boucher1988, Waals Reference Waals1999). A related line of research has demonstrated correspondences between the syllabic parse of consonant clusters and characteristic patterns of temporal organisation (e.g. Browman & Goldstein Reference Browman and Goldstein1988, Byrd Reference Byrd1995, Goldstein et al. Reference Goldstein, Chitoran, Selkirk, Trouvain and Barry2007, Hermes et al.,Reference Hermes, Grice, Mücke, Niemann, Hoole, Bombien, Pouplier, Mooshammer and Kühnertin press). On the perceptual side, temporal patterns have been shown to influence judgements on syllabification when stress and phonotactics allow an ambiguous parse (Tuller & Kelso Reference Tuller and Kelso1991, de Jong et al. Reference De Jong, Lim and Nagao2004, Redford & Randall Reference Redford and Randall2005). Taken together, these studies provide evidence for a systematic relation between syllabic organisation and the timing of consonants and vowels in speech.
In addition to syllable structure, however, a number of other factors also influence the timing of consonants and vowels (Nittrouer et al. Reference Nittrouer, Munhall, Scott Kelso, Tuller and Harris1988, Byrd Reference Byrd1996, Wright Reference Wright1996, Bombien et al. Reference Bombien, Mooshammer, Hoole and Kühnert2010, Byrd & Choi Reference Byrd and Choi2010, Gafos et al. Reference Gafos, Hoole, Roon and Zeroual2010). For example, Nittrouer et al. (Reference Nittrouer, Munhall, Scott Kelso, Tuller and Harris1988) show that patterns of articulatory timing between singleton labial consonants and following vowels vary systematically and discretely as a function of rate, stress, consonant identity ([m] or [p]) and syllable position. In consonant clusters, timing can be affected by the identity of the consonants in a cluster (Byrd Reference Byrd1996, Chitoran et al. Reference Chitoran, Goldstein, Byrd, Gussenhoven and Warner2002, Redford Reference Redford2008), by word position (Wright Reference Wright1996, Gafos et al. Reference Gafos, Hoole, Roon and Zeroual2010) or by prosodic phrase position (Bombien et al. Reference Bombien, Mooshammer, Hoole and Kühnert2010), and, moreover, each of these factors can interact with syllable structure in shaping temporal patterns (Byrd & Choi Reference Byrd and Choi2010). These studies demonstrate cases in which patterns of temporal organisation characteristic of syllabic structure are perturbed by linguistic and non-linguistic factors, leading, in some cases, to ambiguous phonetic diagnostics. Such cases expose the main problem associated with the heuristic use of phonetic measurements. When the phonological structure of interest does not surface with the expected phonetics, the heuristics remain silent and offer the analyst no further course of action. Moving beyond the heuristic use of phonetic measurements requires a deeper understanding of the way abstract phonological organisation shapes the continuous and variable phonetics.
Our study has two main aims. The first aim is to present new articulatory data bearing on the phonetic expression of syllable structure. By evaluating temporal patterns across highly distinct segmental instantiations of a common syllabic organisation, we offer a conservative test of the relation between syllables and speech timing. Based on the analysis of this data, our second aim is to put forward a new perspective on how phonological organisation is instantiated in the continuous phonetics. In pursuit of this aim, we use the prosodic variability naturally contributed by our speakers to study how phonetic indices for syllable structure change as various parameters are scaled.
The new data come from Electromagnetic Articulography (EMA) recordings of Moroccan Arabic. In the study of the relation between syllable structure and timing, Moroccan Arabic is of particular interest for two reasons. Much of the available articulatory data appropriate for evaluating how consonant clusters are organised syllabically comes from languages claimed to parse sequences of word-initial consonants into syllables with complex onsets (Browman & Goldstein Reference Browman and Goldstein1988, Honorof & Browman Reference Honorof, Browman, Elenius and Branderud1995, Kühnert et al. Reference Kühnert, Hoole and Mooshammer2006, Goldstein et al. Reference Goldstein, Chitoran, Selkirk, Trouvain and Barry2007, Marin & Pouplier Reference Marin and Pouplier2010). One notable exception is Hermes et al. (Reference Hermes, Grice, Mücke, Niemann, Hoole, Bombien, Pouplier, Mooshammer and Kühnertin press), who investigate consonant clusters in Italian, including clusters parsed into both complex onsets (stop–liquid clusters) and simplex onsets (/s/–stop clusters) (see Davis Reference Davis1990 for morphophonological evidence for these parses). Hermes et al. found temporal patterns consistent with these syllabic parses providing further support for a systematic relation between syllables and temporal organisation. Languages claimed to parse all strings of two or three initial consonants, e.g. #CCVX or #CCCVX, into syllables with simplex onsets, e.g. #C.CVX or #CC.CVX, are underrepresented in the literature.Footnote 1 Two preliminary studies, Goldstein et al. (Reference Goldstein, Chitoran, Selkirk, Trouvain and Barry2007) on Berber and Shaw et al. (Reference Shaw, Gafos, Hoole and Zeroual2009) on Moroccan Arabic, are limited, in that they report data from just one speaker of each language. More recently, Hermes et al. (Reference Hermes, Ridouane, Mücke and Grice2011) have reported new data from three speakers of Berber. In this study, we contribute articulatory data from four speakers of Moroccan Arabic.
The second reason for focusing on Moroccan Arabic is related to the variety of its consonant clusters. Like many languages, Moroccan Arabic allows word-initial consonant clusters, including #CCVX and #CCCVX sequences. Unlike many of the other languages for which such clusters are permissible, Moroccan Arabic allows instantiations of these clusters with both rising and falling sonority contours (e.g. /glih/ ‘to grill’, /dfla/ ‘oleander’ vs. /msku/ ‘to hold’, /rbaħ/ ‘to win’). In conjunction with this property, Moroccan Arabic, like other Arabic dialects, is claimed to disallow syllables with complex onsets (Broselow Reference Broselow, Broselow, Eid and McCarthy1992, Kiparsky Reference Kiparsky and de Vijver2003). Specifically, all word-initial consonant clusters, regardless of the identity of the consonants or the sonority profile of the cluster, have been claimed to be parsed heterosyllabically, i.e. biconsonantal clusters are parsed as #C.CVX and triconsonantal clusters are parsed as #CC.CVX (Dell & Elmedlaoui Reference Dell and Elmedlaoui2002: ch. 8). We are interested in assessing whether this invariance on the phonological side – all clusters, independent of their sonority profile, conform to syllables with simplex onsets – finds a corresponding invariance in terms of temporal organisation in our phonetic recordings.
Building on previous work, we begin with the assumption of a fixed correspondence between a qualitative syllabic organisation and an instantiation of that organisation in terms of phonetic parameters. This assumption implies a static invariance view of the relation between phonetics and phonology. According to this view, the phonetic reflexes of different phonological organisations are fixed, as expressed in statements of the kind ‘simplex onsets surface with timing pattern A’, ‘complex onsets surface with timing pattern B’, and so on. In exploring the natural variability of the data, we identify ranges of phonetic parameter values under which this assumption leads to misleading or at least ambiguous results. Across our data, we find that speakers vary considerably in the degree to which the durations of consonants and vowels are affected by increasing the length of a word. Instead of seeking invariance in individual phonetic parameters, we harness this variability by identifying relations between phonetic parameters that remain invariant and clearly predictive of syllable structure, even as the phonetic parameters themselves vary. The presence of these relations leads us to a new perspective on how phonological organisation is instantiated in continuous phonetics, which we refer to as the dynamic invariance view. In this view, any given phonological organisation makes specific predictions about the pattern of change in the phonetic indices as parameters are scaled. Invariance is to be found in the distinct relations or patterns of change prescribed by the different phonological organisations, rather than in static statements such as ‘simplex onsets surface with timing pattern A’ or ‘complex onsets surface with timing pattern B’.
2 Experimental methods
2.1 Speakers and materials
Four speakers (three male, one female) of the Oujda dialect of Moroccan Arabic participated in the study. Stimuli consisted of nine target words, organised into three triads, given in (1). The triads were constructed such that words differed only in the number of initial consonants, e.g. #CVX, #CCVX, #CCCVX. All two- and three-consonant clusters in the stimulus set have been claimed to be parsed heterosyllabically, e.g. #C.CVX, #CC.CVX (Boudlal Reference Boudlal2001, Dell & Elmedlaoui Reference Dell and Elmedlaoui2002, Kiparsky Reference Kiparsky and de Vijver2003). The target stimuli were randomised within a larger set of words included for analysis in other experiments. Participants produced each target at least ten times, in the carrier phrase /zibi__hnaja/ ‘bring__here’. Participants comfortable with producing more than ten repetitions were encouraged to continue cycling through the word list. In total, participants produced the target words between 10 and 18 times each, yielding a total of 552 tokens.
(1)


2.2 Procedure
Articulatory data were recorded using the Carstens AG500 three-dimensional Electromagnetic Articulometry system (EMA) at the Institut für Phonetik und Sprachverarbeitung, Munich (Zierdt et al. Reference Zierdt, Hoole, Tillmann, Ohala, Hasegawa, Ohala, Granville and Bailey1999, Hoole, Zierdt & Geng Reference Hoole, Fuchs, Dahlmeier, Palethorpe and Tabain2003, Hoole & Zierdt Reference Hoole, Zierdt, Maassen and van Lieshout2010). EMA is a flesh-point tracking system that uses receivers adhered to speech articulators to record movements in a magnetic field (Perkell et al. Reference Perkell, Cohen, Svirsky, Matthies, Garabieta and Jackson1992). In the Carstens AG500 system, six transmitter coils affixed to a plastic cube apparatus produce alternating magnetic fields at different frequencies. The transmitters induce an electrical signal in the receivers placed inside the cube. The voltage of this signal is used to recover the distance and orientation of the receivers with respect to the transmitter coils. The system samples movement data at a rate of 200 Hz. Voltage-to-distance conversions used a filter cut-off of 40 Hz for the tongue-tip receiver and 20 Hz for all other receivers. Head movement was removed from the signals computationally. The origin of the coordinate system was located at the lower front edge of the upper incisors. Audio data was collected concurrently with a directional microphone at a sampling rate of 24 kHz.
The EMA receivers (about 2 mm diameter) were placed on the tongue tip (at 1 cm behind apex), tongue mid (approximately halfway between the tip and tongue body sensor), tongue body (approximately 5 cm behind the tip sensor), lower lip, upper lip and jaw. Additional sensors used as reference points were placed on the upper incisors, bridge of the nose and the left and right sides of the head, behind the ears. Participants sat inside the plastic cube with receivers attached, while target words were displayed in standard Arabic script on a computer screen placed outside of the cube. Speakers produced the words displayed on the screen within the carrier phrase at a comfortable speech rate.
2.3 Measurements
The articulatory data produced by the EMA recordings was analysed using Mview, a Matlab-based program developed at Haskins Laboratories by Mark Tiede and adapted to our data by us. The program displays the acoustic and positional signals together with the corresponding instantaneous velocity signals, which were calculated by differentiating the positional signals. Three-dimensional EMA provides information about vertical, anterior–posterior and lateral movement. Our analysis focuses on the vertical and horizontal (i.e. anterior–posterior) movement within the midsagittal plane. The EMA receiver used to delineate movements associated with a consonant was the one corresponding to that consonant's primary oral articulator: tongue tip for [l n], tongue body for [k] and lower lip for [b m f]. The receiver used for [s] was either the tongue tip or the tongue mid, depending on the speaker.
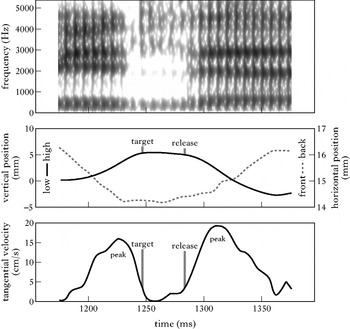
Articulatory landmarks associated with the hold phase, or plateau, of consonantal constrictions were parsed from the kinematic data by referencing the tangential velocity signal. The achievement of target, henceforth ‘target’, and release from constriction, henceforth ‘release’, landmarks define the start and end of the consonantal plateau respectively. These landmarks were obtained by identifying the timestamp at which the magnitude of instantaneous velocity falls below, in the case of the target landmark, or rise above, in the case of the release landmark, a 20% threshold of local tangential velocity peaks. Figure 1 shows the parse of target and release landmarks for the [l] in a production of /lan/ by speaker A. The middle panel shows horizontal and vertical movement of the tongue-tip receiver. The bottom panel shows the corresponding tangential velocity signal. The velocity peaks associated with movement to and away from the target constriction are labelled ‘peak’. The target and release, as defined above, are labelled on both the tangential velocity signal and the corresponding positional signal.
The middle panel shows the location of the tongue-tip receiver in vertical (solid line) and horizontal (dashed line) coordinates during the [l] portion of /lan/. The scale for the vertical coordinate is shown on the left side of the panel. Increases on this scale correspond to increases in tongue-tip height. The scale for the horizontal coordinate is shown on the right side of the panel. Increases on this scale correspond to tongue-tip retraction (note different scaling of vertical and horizontal movement). The bottom panel shows the corresponding tangential velocity signal. The location of the articulatory landmarks, ‘target’ and ‘release’, as parsed from the signal, are shown on both the position and velocity signals. The top panel shows a spectrogram of the corresponding acoustic signal.

The tangential velocity signal provided a clean parse of articulatory landmarks for all segments, with the exception of [k] in the /kulha~skulha~mskulha/ triad. For [k] in this context, a single peak in the tangential velocity signal corresponded to both movement associated with the backing of the tongue body for [u], in the horizontal dimension, and movement associated with achievement of the [k] target, primarily in the vertical dimension. For this reason, only the component velocity from movement in the vertical dimension was referenced to identify landmarks for [k].
3 Stability-based heuristics of syllable structure
We begin our analysis from the perspective of static invariance. We adopt statements of a fixed correspondence between syllable structure and temporal stability (§3.1), and apply those statements as phonetic heuristics to our data (§3.2). We next highlight one corner of the data that deviates from the expected phonetic pattern (§3.3), and call into question the validity of the static invariance approach (§3.4).
3.1 Static invariance in the phonetic expression of syllable structure
The landmarks described in the previous section were used to define intervals whose durations inform us about the temporal organisation in our data. Three interval durations were measured for each token. These intervals correspond to those used to summarise timing patterns in related work (Browman & Goldstein Reference Browman and Goldstein1988, Byrd Reference Byrd1995, Honorof & Browman Reference Honorof, Browman, Elenius and Branderud1995, Shaw et al. Reference Shaw, Gafos, Hoole and Zeroual2009). The three intervals extend respectively from the left edge, centre and right edge of the initial consonant (in #CVX words) or consonant cluster (in #CCVX and #CCCVX words) to a common anchor point. The left edge of the consonant cluster was identified by the target landmark of the initial consonant in the word, e.g. the target of [b] in /bulha/, the target of [s] in /sbulha/, and so on. The right edge of the cluster was identified by the release landmark of the immediately prevocalic consonant, e.g. the release of [b] in /bulha/, /sbulha/, etc. The c-centre landmark was determined by the midpoint of the initial consonant plateau in #CVX words and by the mean of the midpoints of each consonant's plateau in the #CCVX and #CCCVX words, e.g. the centre of [ksb] in /ksbulha/ is the mean of the midpoints of the [k] plateau, the [s] plateau and the [b] plateau. The anchor point was defined by the timestamp of minimum velocity of the tongue-tip sensor in the postvocalic consonant, which was either [l] or [n] for all words in the corpus.
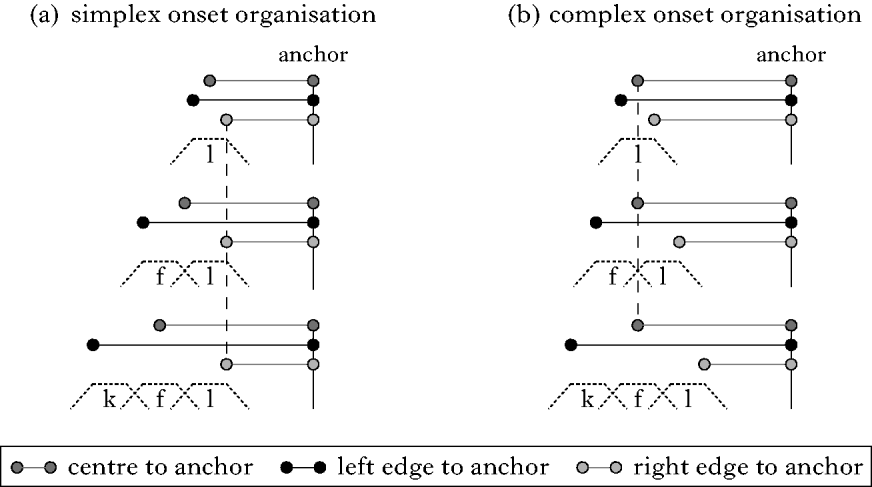
In this section, the above intervals are used to evaluate the two competing hypotheses about temporal organisation schematised in Fig. 2. The schemas in Fig. 2 illustrate distinct temporal organisations which have been considered in past work to be representative or typical manifestations of simplex (Fig. 2a) and complex (Fig. 2b) onsets. Moroccan Arabic, a language claimed to disallow sequences of consonants at the start of a syllable, is hypothesised to exhibit simplex onset organisation, shown on the left. For comparison, the temporal schema thought to be representative of complex onset organisation (as in English) is shown on the right. In Fig. 2, the temporal life of each individual gesture, [k], [f], [l], is represented by three dashed lines corresponding to movement toward constriction, constriction duration and movement away from constriction. For each syllabic organisation, three words differing in the number of initial consonants, [l], [fl] or [kfl], are shown. In addition, the figure shows three intervals for each word. The intervals are left-delimited by the left edge, right edge and centre of the single consonant or consonant cluster, as defined above, and right-delimited by a common anchor, such as the [n] following the [a] in /lan/, /flan/ and /kflan/.
Schematic of the static invariance perspective on the phonetic expression of syllable structure: (a) illustrates the temporal organisation associated with simplex syllable onsets; (b) illustrates the temporal organisation associated with complex syllable onsets.
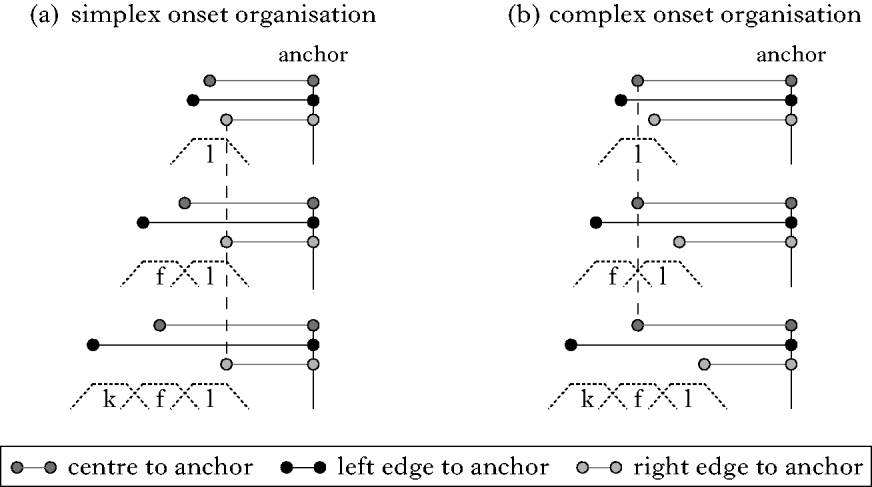
The schema in Fig. 2a corresponds to a pattern whereby the right edge to anchor interval is more stable than the centre to anchor and left edge to anchor intervals. The relative stability of the right edge to anchor interval in Fig. 2a is indicated by the constant length of the horizontal line drawn between the right edge and the anchor. In reality, across word types and multiple repetitions of each word, the right edge to anchor interval is not constant. However, according to the schemas of Fig. 2, the magnitude of durational changes in the right edge to anchor interval is expected to be smaller than the magnitude of changes in the other intervals. These differences in magnitude translate into greater stability for the right edge to anchor interval, relative to the other two intervals.
In Fig. 2b a different pattern is found, whereby the centre to anchor interval is more stable across words than the left edge to anchor and right edge to anchor intervals. This pattern has been found repeatedly in languages claimed have complex syllable onsets (Browman & Goldstein Reference Browman and Goldstein1988, Honorof & Browman Reference Honorof, Browman, Elenius and Branderud1995, Goldstein et al. Reference Goldstein, Nam, Saltzman, Chitoran, Fant, Fujisaki and Shen2009, Marin & Pouplier Reference Marin and Pouplier2010), but also, under some circumstances, in languages claimed to have simplex syllable onsets (Shaw et al. Reference Shaw, Gafos, Hoole and Zeroual2009). As shown in Fig. 2b, it is the horizontal line between the centre and the anchor that remains constant across the two words. Again, Fig. 2 is a schematic. In experimental data, the expectation about the centre to anchor interval would not be that it remains constant, but rather that it is the most stable interval relative to the other two, when stability is assessed across word types and multiple repetitions of each word.
In the small number of languages for which relevant articulatory data are available, the patterning depicted in Fig. 2 concurs with independent arguments from phonological theory. For example, American English is argued to allow complex onsets (Kahn Reference Kahn1976), and has been shown to pattern as in Fig. 2b. Moroccan Arabic is argued to disallow complex consonant clusters as syllable onsets (Boudlal Reference Boudlal2001, Dell & Elmedlaoui Reference Dell and Elmedlaoui2002: ch. 8, Kiparsky Reference Kiparsky and de Vijver2003). The same claim has been made for other Arabic dialects (Broselow Reference Broselow, Broselow, Eid and McCarthy1992, Kiparsky Reference Kiparsky and de Vijver2003). Accordingly, the Moroccan Arabic string /kra/ ‘rent’ would not be just a single syllable. Rather, [k] would be in a different syllable from [ra]. Intuitively, we can describe the correspondence between these theoretical ideas and the data patterns of Fig. 2 as follows. Since, theoretically, it is only the immediately prevocalic consonant that is in the same syllable as the vowel in Arabic, their timing relation should remain unperturbed when another consonant is added to the beginning of the word. Thus, no change in the interval between the prevocalic consonant and the vowel is expected (Fig. 2a). In English, in contrast, since the added consonant is incorporated into the same syllable as the rest of the segments, the timing relation between these segments must change to accommodate the extra member of the syllable. Thus, we expect the interval between the prevocalic consonant and the vowel to change when another consonant is added (Fig. 2b).
To sum up, Fig. 2 represents a statement to the effect that different phonological organisations correspond to different phonetic indices. In more specific terms, there is a correspondence between timing patterns in articulatory data and syllable structure. Syllables with simplex onsets correspond to a pattern of temporal stability where the right edge to anchor interval is the most stable, i.e. more stable than the left edge to anchor and centre to anchor intervals. Syllables with complex onsets correspond to a pattern of temporal stability where the centre to anchor interval is the most stable, i.e. more stable than the right edge to anchor and left edge to anchor intervals. We refer to these statements as the stability-based heuristics of syllable structure. Statements of this form promote the view that the relation between phonological organisation and phonetic indices is spelled out in the form of fixed correspondences between particular syllable organisations and specific phonetic indices for these organisations. The validity of such stability-based heuristics, as methods of inferring phonological organisation from phonetic data, is a major theme we take up after presenting the results of our data analysis.
3.2 Stability patterns in the data
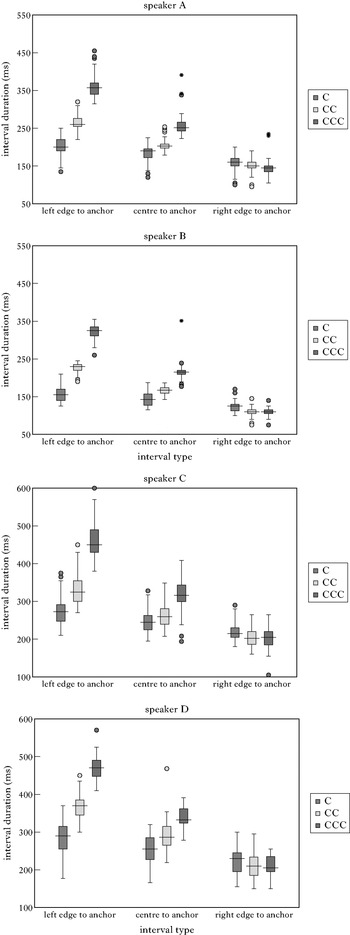
Figure 3 (pp. 466–467) provides box plots for each speaker showing the duration of intervals (y-axis) as a function of consonant cluster size (x-axis). It can be seen from comparison of the speakers that there is substantial variation in average interval duration. As an example of this variation, consider the median left edge to anchor interval in words beginning with a singleton consonant. Figure 3 shows that this interval ranges from 150 ms for speaker B to 290 ms for speaker D. Despite such disparities in absolute durations across speakers, the main pattern of interval change, as consonant cluster size increases, is the same within each speaker. The left edge to anchor interval and the centre to anchor interval both increase with the addition of each consonant (#CCCVX>#CCVX>#CVX). In contrast, the right edge to anchor interval remains relatively stable.Footnote 2 This is the pattern expected for simplex onset organisation, according to the stability-based heuristics of Fig. 2a. After quantifying the statistical reliability of this pattern, we then look more closely at individual words and identify items that deviate from the main trend shown in Fig. 3.
Duration of three measured intervals (left edge to anchor, centre to anchor and right edge to anchor) by cluster size (C, CC, CCC) for four speakers, pooled across triads. Boxes are defined by the upper and lower quartiles of the data. The solid line is the median duration, whiskers indicate sample minima and maxima, and circles and asterisks indicate outliers.

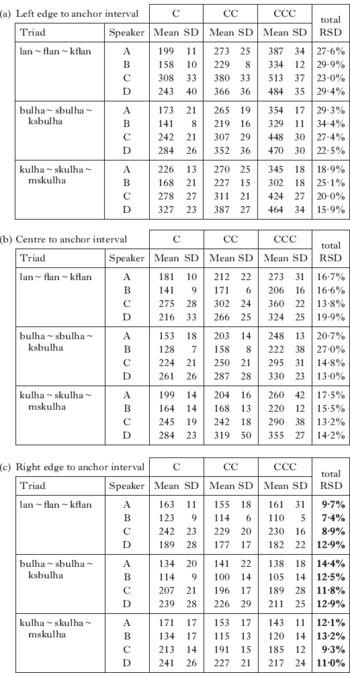
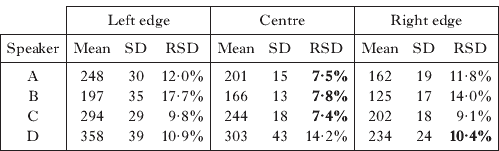
Table I (pp. 468–469) provides measurements of interval duration for each combination of speaker and triad across C-, CC- and CCC-initial words. The table shows the mean and standard deviation of the left edge to anchor, centre to anchor and right edge to anchor intervals, as well as the relative standard deviation of these intervals calculated across words of a triad (right column). The relative standard deviation, also known as the coefficient of variance, is the standard deviation divided by the mean. In consideration of the general property of motor behaviour that the variance of a timed interval is correlated with its mean (Wing & Kristofferson Reference Wing and Kristofferson1973, Schöner Reference Schöner2002), we adopt the relative standard deviation (RSD) as our index of interval stability. In contrast to other widely used indices of stability such as variance or standard deviation, relative standard deviation does not bias the interpretation of the results in favour of right edge to anchor stability (as the shortest of the three intervals shown in Fig. 2, the right edge to anchor interval is biased toward having a lower variance or standard deviation than the other intervals), making it a conservative measure for assessing phonological organisation using temporal stability measures (Shaw et al. Reference Shaw, Gafos, Hoole and Zeroual2009). For all combinations of speaker and triad, the RSD of the right edge to anchor interval (Table Ic, in bold) was lower than the RSD of the other two intervals (Table Ia, b). This is the pattern of stability corresponding to simplex onsets, according to the stability-based heuristics in the left panel of Fig. 2.
Mean and standard deviation (SD) of three measured intervals, (a) left edge to anchor, (b) centre to anchor and (c) right edge to anchor, for each speaker and word in a triad. The relative standard deviation (RSD) calculated across words in a triad is provided for each interval and speaker (rightmost column). For each combination of speaker and triad, the lowest RSD values are found for the right edge to anchor interval (shown in bold).

A repeated measures ANOVA was conducted to evaluate the statistical reliability of the stability pattern. The dependent variable was RSD. Triad {/lan~flan~kflan/, /bulha~sbulha~ksbulha/, /kulha~skulha~mskulha/} and interval type {left edge to anchor, centre to anchor, right edge to anchor} were included as repeated measures factors. Mauchly's test indicated that the assumption of sphericity was upheld for both factors (triad: p=0·094; interval type: p=0·348). The main effect of interval type [F(2, 6)=56·4, p<0·001] and the interaction between interval type and triad were both significant [F(4, 12)=5·25, p=0·011]. The main effect of triad was not significant [F(2, 6)=3·51, p=0·098].
Post hoc ANOVAs showed significant differences in relative standard deviation between each level of interval type: centre to anchor vs. right edge to anchor [F(1, 3)=21·5, p<0·019]; centre to anchor vs. left edge to anchor [F(1, 3)=99·3, p=0·002]; right edge to anchor vs. left edge to anchor [F(1, 3)=62·9, p<0·01]. This indicates that the stability advantage (lower RSD, as seen by comparing numbers in the right column of Table Ic with the corresponding numbers in Table Ia and b) of the right edge to anchor interval over the centre to anchor and left edge to anchor intervals is reliable.
To evaluate the interaction between triad and interval type, post hoc ANOVAs were conducted on each level of interval type, with triad as a within-subjects factor. These tests indicated that the significant interaction between triad and interval type was due to the RSD of the left edge to anchor interval. There was a significant effect of triad on the left edge to anchor interval [F(2, 6)=9·56, p<0·05], attributable to the /kulha~skulha~mskulha/ triad, which had a lower left edge to anchor RSD than the other triads. The effect of triad on the other two intervals, centre to anchor [F(2, 6)<1] and right edge to anchor [F(2, 6)=3·32, p=0·11], was not significant. Since the RSD patterns of the centre to anchor interval and the right edge to anchor interval were not significantly different across triads, the interaction between triad and interval type has no relevant consequence for the theoretical hypotheses under evaluation. This is because, as per the stability-based heuristics of Fig. 2, the prediction of complex onset organisation refers to centre to anchor stability, and the prediction of simplex onset organisation refers to right edge to anchor stability.
In sum, the statistical analysis indicates a reliable pattern of right edge stability, the timing pattern proposed to be characteristic of simplex onset organisation (as per Fig. 2a).
3.3 Exceptional patterns
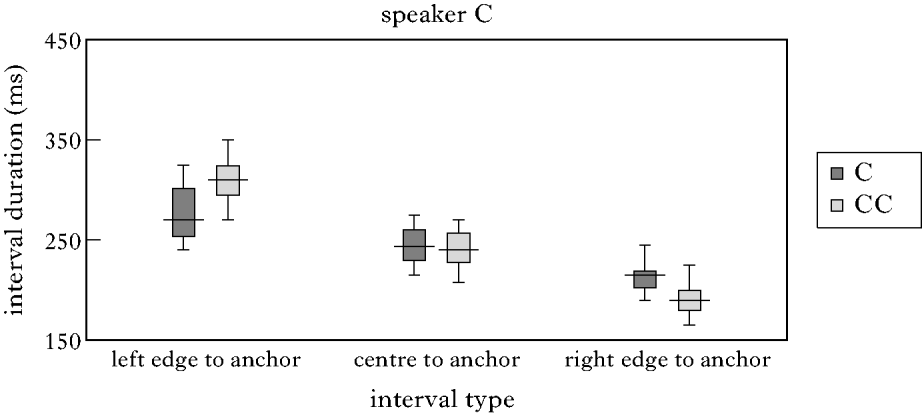
A closer look at the results of Table I reveals some potential exceptions. For three speakers, A, B and C, the centre to anchor interval does not show a substantial increase in duration from /kulha/ to /skulha/. That is, for this subset of the data, we find centre to anchor interval stability. This patterning, no substantial change in the means from #CVX to #CCVX, is non-canonical from the perspective of the heuristics for simplex onset organisation in Fig. 2. As depicted by these heuristics, stability of the centre to anchor interval is seen as the canonical manifestation of complex onset syllables (Browman & Goldstein Reference Browman and Goldstein1988, Honorof & Browman Reference Honorof, Browman, Elenius and Branderud1995, Goldstein et al. Reference Goldstein, Chitoran, Selkirk, Trouvain and Barry2007, Marin & Pouplier Reference Marin and Pouplier2010, Hermes et al.,Reference Hermes, Grice, Mücke, Niemann, Hoole, Bombien, Pouplier, Mooshammer and Kühnertin press).
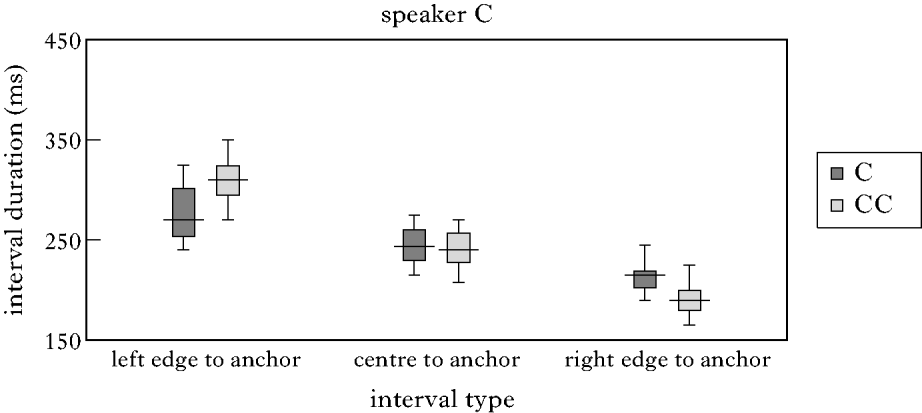
To further illustrate the exceptional patterning of centre to anchor interval duration in /kulha~skulha/, Fig. 4 shows a box plot for just this data, produced by speaker C. The box plot shows that the centre to anchor interval is stable across #CVX and #CCVX words, while the right edge to anchor interval decreases from #CVX, /kulha/, to #CCVX, /skulha/. This pattern reflects the predictions of complex onset organisation, as shown in Fig. 2b.
Duration of three measured intervals (left edge to anchor, centre to anchor and right edge to anchor) by cluster size (C, CC) for /kulha~skulha/, as produced by speaker C.
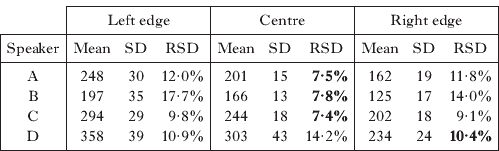
To explore how the changes in duration highlighted in Fig. 4 affect our measure of interval stability, we isolated the /kulha~skulha/ data and calculated interval stability over just these words. Table II shows the results. For speaker D, the right edge to anchor is more stable than the centre to anchor interval and the left edge to anchor interval. From the perspective of the heuristics in Fig. 2, speaker D shows the canonical pattern of simplex onset organisation. However, the other three speakers show a stability pattern consistent with the predictions of complex onset organisation. For these speakers, the centre to anchor interval has a lower RSD than both the left edge to anchor interval and the right edge to anchor interval. We take up this exceptional pattern in §4, where we discuss the reliability of stability-based heuristics for syllable structure.
Mean, standard deviation (SD) and relative standard deviation (RSD) of three intervals, left edge to anchor, centre to anchor and right edge to anchor, of the /kulha~skulha/ dyad for each speaker. For each speaker, the interval with the lowest RSD, i.e. the most stable interval, is shown in bold.
3.4 Taking stock: preliminary summary
The overall patterns of interval stability are largely consistent with the predictions for simplex onset syllables according to the stability-based heuristics for syllable structure. Across words beginning with one, two and three initial consonants, the right edge to anchor interval is more stable than the left edge to anchor interval or the centre to anchor interval. This stability pattern derives from the direction and magnitude of changes in interval duration across increases in the number of consonants at the start of a word. As the number of consonants increases, the durations of the left edge to anchor interval and the centre to anchor interval increase. The right edge to anchor interval decreases from #CVX to #CCVX, and remains roughly equivalent across #CCVX and #CCCVX. Across #CVX, #CCVX and #CCCVX word types, the magnitude by which the left edge to anchor and centre to anchor intervals increase is substantially greater than the magnitude by which the right edge to anchor interval decreases. These differences lead to a stability advantage for the right edge to anchor interval over the other two intervals. This fact is summarised by the relative standard deviation statistic reported in Table I. For all combinations of speaker and triad, the right edge to anchor interval showed a significantly lower RSD than the other two intervals.
We have also seen, however, that it is possible to isolate some pieces of the larger corpus that are consistent with the stability-based heuristics for complex onset syllables. Specifically, patterns of interval duration across /kulha/ and /skulha/ (excluding /mskulha/) deviated for speakers A, B and C from the main trend in the data. Three out of four speakers produced /kulha~skulha/ (but not /bulha~sbulha/ or /lan~flan/) with stable centre to anchor intervals. Centre to anchor stability has provided an informative heuristic for complex syllable onsets (Browman & Goldstein Reference Browman and Goldstein1988, Kühnert et al. Reference Kühnert, Hoole and Mooshammer2006, Goldstein et al. Reference Goldstein, Chitoran, Selkirk, Trouvain and Barry2007, Marin & Pouplier Reference Marin and Pouplier2010, Hermes et al., Reference Hermes, Grice, Mücke, Niemann, Hoole, Bombien, Pouplier, Mooshammer and Kühnertin press). In the current study, centre to anchor stability is sometimes observed for the /kulha~skulha/ dyad (a dyad refers to a #CCVX word and its segmentally matched #CVX counterpart). The exceptional stability of the centre to anchor interval for just a single word pair is important in the context of theories of syllable structure. Such theories typically aim at capturing aspects of linguistic knowledge shared by members of a speech community, i.e. differences in syllabification across subjects are not expected. Further, while there are various proposals that treat the phonological organisation of consonant clusters and/or the temporal organisation of consonant clusters differently, depending on the identity of the consonants in the cluster, our data do not conform to these proposals. For example, /s/–obstruent clusters, such as those in /skulha/ and /sbulha/, are sometimes claimed to be phonologically different from rising sonority clusters, such as the initial cluster in /flan/ (e.g. Fudge Reference Fudge1969, Selkirk Reference Selkirk, Hulst and Smith1982, Zuraw Reference Zuraw2007). In our data, uniformity is found across /sbulha/ and /flan/ (not across /skulha/ and /sbulha/). In other data, the temporal patterning of consonant clusters is influenced by the ordering of the place of articulation of the consonants, i.e. front-to-back clusters (those in which the place of articulation of the first consonant is anterior to the place of articulation of the second consonant) show differences in timing patterns from back-to-front clusters (Hardcastle & Roach Reference Hardcastle, Roach, Hollien and Hollien1979, Zsiga Reference Zsiga1994, Byrd Reference Byrd1996, Wright Reference Wright1996, Surprenant & Goldstein Reference Surprenant and Goldstein1998, Chitoran et al. Reference Chitoran, Goldstein, Byrd, Gussenhoven and Warner2002, Goldstein et al. Reference Goldstein, Nam, Saltzman, Chitoran, Fant, Fujisaki and Shen2009, Gafos et al. Reference Gafos, Hoole, Roon and Zeroual2010). In our data, [fl] and [sk], the front-to-back clusters, do not pattern to the exclusion of [sb], the back-to-front cluster. Thus the exceptional data in our corpus does not readily fit into existing proposals. Moreover, interpreting centre to anchor stability as support for complex onset organisation in our data would lead us to the rather puzzling conclusion that for speakers A, B and C the initial cluster of /skulha/ has a different syllabification than the initial cluster of /sbulha/ or the initial cluster of /flan/.
The alternative is that syllabic organisation remains unchanged throughout our entire data set, and that therefore our understanding of the relation between syllable structure and phonetic indices, as encoded in the stability-based heuristics of Fig. 2, is incomplete. In sum, our data offer an opportunity, taken up in the following section, to assess the validity of stability-based heuristics of syllable structure and thus improve our understanding of the relation between phonological form and phonetic indices.
4 Limitations of stability-based heuristics for syllable structure
An important question for addressing the relation between syllabic organisation and experimental data is how reliably stability measures of temporal organisation, extracted from the inherently variable and continuous phonetic signal, reflect syllable structure. Here we use our data, including the ‘exceptional’ data mentioned in §3.3, to study how stability-based patterns change under natural prosodic modulations contributed by the speakers in our experiments.
Our experimental manipulation invites consideration of two well-known prosodic modulation effects contributed by adding segments to a word, i.e. #CVX, #CCVX, #CCCVX. The first concerns the duration of the prevocalic consonant in #CVX sequences compared to that in #CCVX and #CCCVX sequences. There are reasons to expect that the duration of that consonant would be longer in #CVX. Consonants in the first position of a word tend to be longer or strengthened in comparison with instances of the same consonants in a non-initial position (Fougeron & Keating Reference Fougeron and Keating1997, Byrd & Saltzman Reference Byrd and Saltzman2003, Byrd et al. Reference Byrd, Lee, Riggs and Adams2005), and consonants in clusters tend to be shorter than in isolation (Haggard Reference Haggard1973, Klatt Reference Klatt1976, Umeda Reference Umeda1977).Footnote 3
The second effect is vowel or syllable compression as additional segments are appended to the word. There is considerable evidence that the underlined portion of #CVC sequences shortens in #CCVC and #CCCVC sequences, due to the addition of the extra segments (e.g. Lehiste Reference Lehiste1972, Klatt Reference Klatt1973 and Kim & Cole Reference Kim and Cole2005 on English; and Strangert Reference Strangert1985 for a cross-linguistic review).
In this section, we pursue an analysis of the influences which these prosodic modulations have on stability-based indices of syllable structure. We take up prevocalic consonant shortening in §4.1, and turn to syllable compression in §4.2. Using a computational model of temporal organisation, we make explicit the behaviour of temporal stability indices as phonetic parameters are scaled. We find that under simplex onset organisation, the two effects lead to improved centre to anchor stability. Crucially, for complex onset organisation, the shortening effects observed in our data make different predictions. These predictions enable us to diagnose syllabic organisation in our data even in cases where stability-based heuristics fail to be informative. In short, in the approach put forward here, the natural prosodic variability in our experimental data becomes crucial in elucidating the relation between phonological organisation and phonetic indices. It is only when we understand the effect of this variability on the stability patterns that we can reliably infer syllabic organisation from our phonetic data.
4.1 Effects of consonant duration on interval stability
Under certain structural conditions, centre to anchor interval stability, as calculated across #CVX and #CCVX forms, can be influenced by the temporal properties of the immediately prevocalic consonant, i.e. the underlined consonant in #CVX and #CCVX. Three speakers exhibited centre to anchor stability for /kulha~skulha/. When [s] joins the [kVX] in /kulha/ to form [skVX] in /skulha/, it shifts the c-centre (the landmark left-delimiting the centre to anchor interval) to the left or, in other words, it stretches the centre to anchor interval by increasing its duration. If the addition of [s] is accompanied by shortening of [k], the duration added to the centre to anchor interval by [s] may be reduced or even obliterated. Thus, across [kVX] and [skVX] sequences, the centre to anchor interval may not change much. Therefore, the relative standard deviation of that interval may be relatively low (centre to anchor interval stability). Importantly, however, the effects of prevocalic consonant duration on centre to anchor stability depend on syllable structure. Syllables with complex onsets yield different predictions than syllables with simplex onsets.
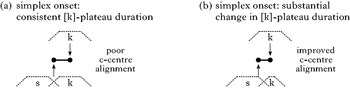
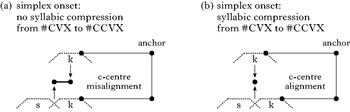
Figure 5 illustrates the predicted relationship between consonant shortening and centre to anchor interval duration for simplex onset syllables. In Fig. 5a, the plateau duration of [k] remains relatively invariant across the [k]/[sk] contexts, whereas in Fig. 5b, [k]'s plateau duration is shorter in [sk] than in [k]. Figure 5a shows the canonical pattern of simplex onset organisation. This parallels the simplex onset schema shown in Fig. 2. In both Fig. 2 and Fig. 5a, consonant duration remains invariant across the [k]/[sk] sequences. Under these idealised conditions, addition of [s] to [k] lengthens the centre to anchor interval in [sk] relative to [k]. Consequently, as Fig. 5a shows, the c-centre landmark, which left-delimits the centre to anchor interval, is poorly aligned across [k] and [sk]. Such misalignment lowers the stability of the centre to anchor interval. In Fig. 5b, [k]'s plateau duration is shorter in [sk] than in [k]. In this case, shortening of [k] cancels out some of the duration added to the centre to anchor interval by [s]. As a consequence, the c-centres of [k] and [sk] are better aligned in Fig. 5b than in Fig. 5a.
Comparison of c-centre alignment under simplex onset organisation of #C and #CC in two conditions of consonant plateau duration. (a) shows consistent consonant durations across [#s] and [#sk]. (b) shows a decrease in [k] plateau duration in [#sk] relative to [#k]. The length of the solid line indicates the degree to which the c-centres of [k] and [sk] are aligned. The line is shorter in (b) than in (a), indicating that shortening [k] improves c-centre alignment under simplex onset organisation.

The main point of Fig. 5 is that consonantal shortening improves centre to anchor stability under simplex onset organisation. There is a direct relationship between centre to anchor stability and differences in consonant plateau duration. As the difference between plateau duration (across #CVX and #CCVX) increases, the difference in c-centre location decreases. This is not a prediction of syllables with complex onsets.
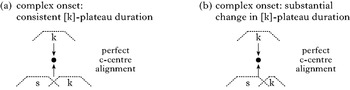
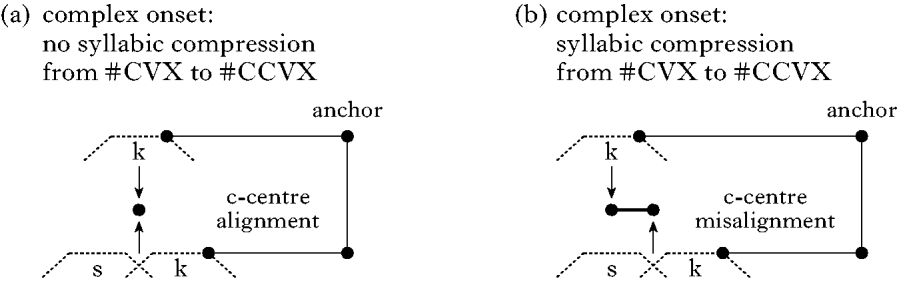
In complex onset syllables, consonant plateau shortening is predicted to be unrelated to centre to anchor stability. Figure 6 illustrates this by redisplaying the same sequences, [k] and [sk], under complex onset organisation. Figure 6a shows the same alignment pattern as our first introduction of the complex onset schema (Fig. 2b). In this panel, the duration of [k] remains the same both in [k] and in the [sk] cluster. Figure 6b shows changes in [k] plateau duration across [k] and [sk]. It can be seen from a comparison of Fig. 6a and Fig. 6b that the location of the c-centre is unaffected by changes in plateau duration. Complex onset organisation predicts that there is no relationship between consonant shortening and centre to anchor interval stability.
Comparison of c-centre alignment under a complex onset organisation of #C and #CC in two conditions of consonant plateau duration. (a) shows consistent consonant durations across [#s] and [#sk]. (b) shows a decrease in [k] plateau duration in [#sk] relative to [#k]. In both panels, the c-centres of #C and #CC remain aligned.

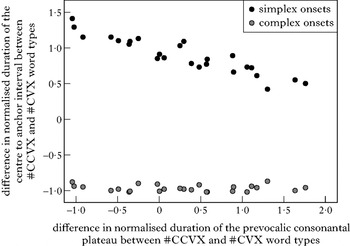
To check the predictions illustrated in Figs 5 and 6, we used a computational model of temporal organisation to simulate word dyads under conditions of prevocalic consonant shortening. Given a set of word types, e.g. #CVX and #CCVX, the model simulates the temporal organisation for each word by generating articulatory landmarks defining the plateau of each constituent segment. These landmarks are generated from stochastic versions of local timing relations between consonants and vowels (following Gafos Reference Gafos2002). Landmark generation proceeds by first selecting the timestamp of the release landmark of the immediately prevocalic consonant, Creln, from a Gaussian distribution. The immediately preceding landmark, the target of that consonant, Ctarn, is then generated by subtracting consonant plateau duration, k p, from Creln and adding a noise term. These two landmarks, Ctarn and Creln, define the plateau of the immediately prevocalic consonant. For words with two initial consonants, the release landmark of the preceding consonant, Cn−1 (C1 in #C1C2V words), is generated with reference to Ctarn. The inter-plateau interval, k ipi, is subtracted from Ctarn and a noise term is added. The target landmark of the initial consonant, Creln−1, is then calculated by subtracting plateau duration from Creln−1 and adding a noise term. Anchor points were generated according to syllabic organisation by subtracting a constant, k v, either from the midpoint of only the immediately prevocalic consonant, under simplex onset organisation, or from the midpoint of the entire cluster of prevocalic consonants, under complex onset organisation. In this way, word dyads, #CVX and #CCVX forms, were simulated under complex and simplex onset organisation.Footnote 4 On each run of the simulation, fifteen instances of #CVX and fifteen instances of #CCVX words were simulated. Across thirty runs of the simulation, the duration of the immediately prevocalic consonant in #CCVX was systematically varied from 100 ms to 10 ms in 3 ms steps. Relevant measurements of the simulated data are summarised in Fig. 7.
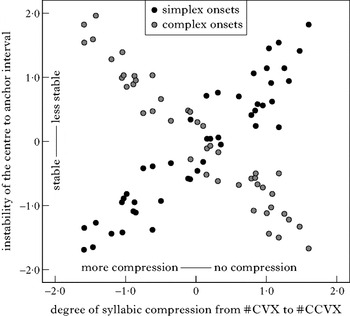
Scatter plot of data simulated under simplex and complex onset organisation. The y-axis shows the absolute value of the difference in centre to anchor interval duration calculated across dyads. The x-axis shows the difference in prevocalic consonant duration between #CCVX and #CVX. Higher values on the x-axis correspond to greater degrees of shortening.

Figure 7 plots the absolute value of the difference in centre to anchor interval duration between #CCVX and #CVX words against the difference in prevocalic consonant plateau duration across these word types. Both of these parameters were normalised by z-scoring.
The figure shows that the relation between the parameters depends on syllabic organisation. For simplex onset organisation (black circles), there is a negative correlation. As the effect of consonant shortening increases (higher values on the x-axis), the difference in centre to anchor interval duration between #CCVX and #CVX decreases (lower values on the y-axis). For complex onset organisation (grey circles), there is no such relation. The difference in duration of the centre to anchor interval does not change in any systematic way as duration of the immediately prevocalic consonant is scaled.
We now turn to our data to evaluate these predictions. Across one- and two-consonant clusters, simplex onset organisation predicts a negative correlation between differences in centre to anchor interval duration and differences in prevocalic consonant duration. This means that the greater the shortening of the prevocalic C across #CVX and #CCVX, the smaller the difference in c-centre location across #CVX and #CCVX. Figure 8 plots these two differences for each combination of speaker and word dyad in the data. Since absolute duration varies greatly across speakers, both differences were normalised within speaker by calculating z-scores for each value. The normalised difference in centre to anchor duration, y-axis, is plotted against the normalised difference in the duration of the prevocalic consonant plateau, x-axis. For speaker×dyad combinations with stable prevocalic consonant duration across words, i.e. values around zero on the x-axis, Fig. 8 shows large differences in centre to anchor interval duration. In contrast, speaker×dyad combinations with large differences in prevocalic consonant duration show small differences in centre to anchor interval durations, i.e. values around zero on the y-axis. Pearson's correlation coefficient indicates a significant negative correlation between the two variables (r=−0·844, p<0·001). Thus, as predicted by simplex onset organisation, consonant shortening is related to c-centre alignment – the greater the shortening of prevocalic C, the smaller the difference in c-centre location.
Scatter plot of the normalised difference in centre to anchor interval duration calculated across dyads (y-axis) against the difference in prevocalic consonant duration (x-axis). Higher values on the x-axis correspond to greater degrees of shortening. The circle designates the ‘exceptional’ data points, /kulha~skulha/, as produced by speakers A, B and C.

In the context of the main trend in the data, we can now make sense of the pattern of centre to anchor stability observed for the exceptional /kulha~skulha/ dyad. The three speakers' /kulha~skulha/ productions with stable centre to anchor intervals are circled in Fig. 8. For these cases, stability-based heuristics at first suggested complex onset syllables. But we can now see that stability of the centre to anchor interval in this data is a necessary consequence of simplex onset organisation and prevocalic consonant shortening.
The central point illustrated here, then, is that the same qualitative syllabic organisation can have a range of concrete phonetic manifestations, as various parameters are changed. Simplex onset organisation can give rise to kinematic patterns that, from the perspective of the stability-based heuristics in Fig. 2, would be canonical manifestations of complex onset syllables. We thus see that stability-based heuristics break down under particular conditions. Nevertheless, there are relations between phonetic parameters that remain intact across the range of variation in the data.
4.2 Effects of syllable compression on interval stability
In this section, we illustrate how the second prosodic modulation effect, vowel or syllable compression, interacts with stability-based indices for syllable structure. As with the previous section, we make explicit that the influence which compression has on centre to anchor stability depends crucially on the syllabic organisation of consonant clusters.
Figure 9 illustrates what happens to c-centre alignment when syllable duration is perturbed such that the VC portions of #CCVC sequences are shorter than in corresponding #CVC sequences. We first discuss predictions of simplex onset organisation. To establish a baseline, Fig. 9a shows #CVX and #CCVX sequences without shortening. Since the duration of all segments is held constant and consonant clusters are organised into simplex onset syllables, the right edges of the consonants are better aligned than the c-centres. As we have seen before, adding a consonant lengthens the centre to anchor interval in #CCVX relative to #CVX, yielding low centre to anchor interval stability. Figure 9b shows the same sequences under syllabic compression. While the effect we focus on here is a consequence of syllable shortening, regardless of what part of the syllable shortens, for the purposes of illustration we indicate syllable compression in the figure by manipulating the right edge to anchor interval. In Fig. 9b, the right edge to anchor interval is substantially shorter in #CCVX than in #CVX. As a consequence of this shortening, the c-centre of #CCVX is brought into alignment with the c-centre of #CVX. This results in improved centre to anchor interval stability across #CVX and #CCVX sequences in Fig. 9b compared to Fig. 9a. Thus, syllable compression in #CCVX relative to #CVX sequences improves centre to anchor interval stability. Crucially, however, this is a prediction of simplex onset syllables only.
Comparison of c-centre alignment under simplex onset organisation of #CVX and #CCVX in two conditions of syllabic compression. (a) shows consistent right edge to anchor durations across [#sVX] and [#skVX]. (b) shows a decrease in right edge to anchor interval duration in [#skVX] relative to [#kVX]. The solid line indicates the degree to which the c-centres of [k] and [sk] are misaligned. The perfect alignment of the c-centres in (b) indicates that syllabic compression improves c-centre alignment under simplex onset organisation.

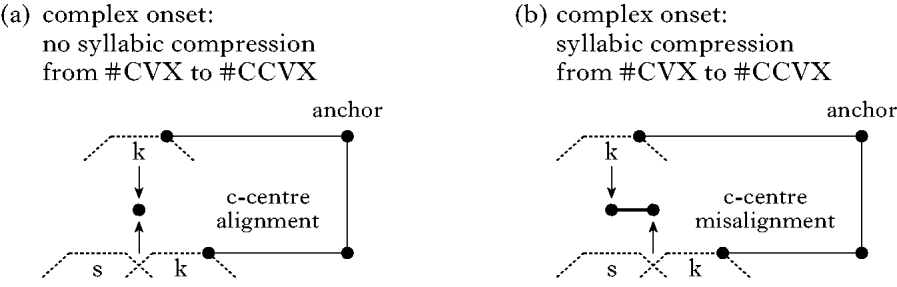
Under complex onset organisation, syllabic shortening has the opposite effect on centre to anchor interval stability. This is illustrated in Fig. 10. Figure 10a shows the idealised version of the complex onset schema first introduced in Fig. 2b. In this schema, the c-centre landmarks of #CVX and #CCVX are perfectly aligned. This alignment pattern underlies centre to anchor interval stability. Figure 10b illustrates the effects of syllable shortening. This is indicated by the right edge to anchor interval, which is reduced in size in Fig. 10b relative to Fig. 10a. Syllabic compression reduces the duration of the centre to anchor interval, causing the c-centres of #CVX and #CCVX to be misaligned. Since the c-centre landmark left-delimits the centre to anchor interval, perturbations of the c-centre across #CVX and #CCVX sequences reduce the stability of the centre to anchor interval. We thus see that for complex onset syllables the syllable compression reflected in the shortening of the right edge to anchor interval serves to degrade centre to anchor stability.
Comparison of c-centre alignment under complex onset organisation of #CVX and #CCVX in two conditions of syllabic compression. (a) shows right edge to anchor durations expected of [#sVX] and [#skVX] without syllabic compression. (b) shows a large decrease in right edge to anchor interval duration in [#skVX] relative to [#kVX], due to syllabic compression. The solid line indicates the degree to which the c-centres of [k] and [sk] are misaligned. The alignment of the c-centres in (a) is disrupted in (b), indicating that syllabic compression degrades c-centre alignment under complex onset organisation.
To check predictions of syllabic compression on simplex (Fig. 9) and complex (Fig. 10) onset organisations, we again conducted simulations. Word dyads, #CVX and #CCVX forms, were simulated using the same parameter values as before. On each run of the simulation, fifteen instances of #CVX and fifteen instances of #CCVX words were simulated. We ran the simulation fifty times. On each run, the duration of the vowel in #CCVX was systematically decreased. On the first run, it was drawn from the same distribution for both #CVX and #CCVX words. On each subsequent run, the duration of the vowel in #CCVX forms was decreased by 1 ms. Measurements of the simulated data are reported in Fig. 11.
Scatter plot of phonetic parameters in data simulated under simplex and complex onset organisation. The y-axis shows an index of centre to anchor stability and the x-axis shows an index of syllable compression. The index of centre to anchor stability is the absolute value of the difference in centre to anchor interval duration across dyads; the index of syllable compression is the degree of right edge to anchor interval difference across dyads.

Figure 11 plots a normalised index of centre to anchor interval (in)stability (y-axis) against a normalised index of syllabic compression (x-axis). As an index of compression, we subtracted the duration of the right edge to anchor interval in #CVX words from the duration of the right edge to anchor interval in corresponding #CCVX words. The right edge to anchor interval is a suitable index of compression, since it delimits the period of open vocal tract, indicative of a vowel, and extends to the postvocalic consonant. Since the differences were normalised (by z-scoring), zero indicates the average amount of shortening in the simulation, negative numbers indicate larger degrees of shortening and positive numbers indicate smaller degrees of shortening. To provide an index of centre to anchor stability, we subtracted the duration of the centre to anchor interval in #CVX words from the centre to anchor interval in #CCVX words, and report the absolute value of this difference, which was again normalised by z-scoring. On this index, zero indicates the average level of instability across runs of the simulation, positive numbers indicate larger (greater than average) decreases in centre to anchor stability and negative numbers indicate smaller (smaller than average) decreases in centre to anchor stability.
Figure 11 shows that syllable compression has opposite effects on the two syllabic organisations considered. Under simplex onset organisation, centre to anchor stability improves with syllable compression. Under complex onset organisation, centre to anchor stability degrades with syllable compression. If we focus on those dyads that have the most stable centre to anchor intervals, values near −2·0 on the y-axis, we see that they come from both simplex onset organisation (black circles) and complex onset organisation (grey circles) under different degrees of syllable compression. This confirms the predictions sketched in Figs 9 and 10.
The main point illustrated in Figs 7 and 11 is that syllabic compression accompanying the addition of a segment to a string may cause stability-based heuristics to break down. When compression applies to syllables with simplex onsets, the result is improved centre to anchor interval stability. When compression applies to syllables with complex onsets, the result is either degraded centre to anchor interval stability (when compression is localised in the rhyme) or no effect (when compression is localised in the syllable onset).
These results are important for two reasons. First, they show that syllable compression can invalidate certain stability-based heuristics for syllable structure. Specifically, centre to anchor stability across #CVX and #CCVX, which has served as a heuristic for complex syllable onsets, can be a consequence of simplex syllable onsets when vowels, or other parts of the syllable, shorten.
The second, more constructive point is that the precise way in which syllable compression affects centre to anchor stability depends on syllabic structure. We have seen that simplex and complex organisations make different predictions about the stability of the centre to anchor interval. For simplex onset syllables, centre to anchor stability improves as syllabic compression increases. For complex onset syllables, there is a different relation between syllabic compression and centre to anchor stability. For complex onset organisation, this relation depends on the locus of compression. Centre to anchor stability is either degraded (Fig. 11) or unaffected (Fig. 7) by compression. Overall, then, the computational simulations tell us that variability in the stability-based indices is not random, but structured, in that each qualitative organisation (simplex, complex) is characterised by a continuum of correlated values among different parameters. Different qualitative organisations (simplex, complex) can be distinguished because they structure variability in different ways.
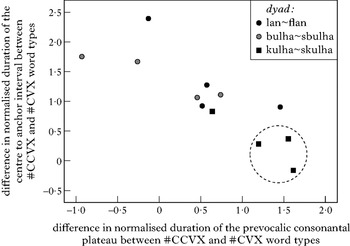
We now return to our experimental data to verify the predictions from the computational model. For each combination of speaker and #CVX~#CCVX dyad in the corpus, Fig. 12 plots for the experimental data the same indices of syllable compression and centre to anchor (in)stability plotted for the simulations. The pattern is indicative of simplex syllable onsets. Compression improves centre to anchor stability, such that greater degrees of right edge to anchor compression, i.e. the ‘more compression’ range on the x-axis, go hand in hand with greater degrees of centre to anchor interval stability. These two variables, right edge to anchor compression and centre to anchor stability, are positively correlated (r=0·698), and the correlation is statistically significant (p=0·012).
Scatter plot of an index of centre to anchor stability (y-axis) against an index of syllabic compression (x-axis): the index of centre to anchor stability is the normalised difference in centre to anchor interval duration across dyads; the index of syllable compression is the normalised degree of right edge to anchor interval difference across dyads. The dotted circle designates the ‘exceptional’ data points, /kulha~skulha/, as produced by speakers A, B and C.

Again, the data which exhibited the ‘exceptional’ behaviour are not exceptions, but rather direct predictions of simplex onset organisation. The ‘exceptional’ cases of centre to anchor stability, contributed by productions of /kulha~skulha/ by speaker A, B and C, are circled in Fig. 12. The figure shows that this corner of the data is part of a well-behaved pattern. This pattern is a property of simplex syllable onsets and is, crucially, inconsistent with complex syllable onsets. Since the relation between syllable compression and centre to anchor stability exhibited in our corpus is compatible only with simplex onset syllables, the presence of this relation supports this analysis of the data.
We conclude with a note on the relation between our model and our data. Although we have focused in this section on how scaling various parameters influences centre to anchor stability, we could, in principle, study the effect of prosodic variation on any interval. For example, scaling the duration of the prevocalic consonant also makes predictions about changes in right edge to anchor interval stability. As a comparison of Figs 5 and 6 suggests, shortening the underlined consonant in #CCVX relative to #CVX has differential effects on right edge to anchor stability, depending on syllabic parse. Under a complex onset parse, as shown in Fig. 6, right edge to anchor stability improves with consonant shortening, i.e. the right edges of C and CC are more closely aligned in Fig. 6b than in Fig. 6a. Under a simplex onset parse, as shown in Fig. 5, we see a different pattern. Right edge to anchor stability degrades with consonant shortening, i.e. the right edges of C and CC are more closely aligned in Fig. 5a than in Fig. 5b. We have verified these patterns through computational simulation. In the absence of other modulations, the pattern of change in the right edge to anchor interval resulting from manipulating consonant duration (in the way described above and schematised in Figs 5 and 6) can indeed distinguish syllable parses. In our data, however, the effect of consonant shortening on right edge to anchor interval stability is cancelled out by syllabic compression, the second prosodic modulation we have observed. This cancelling takes place because, under a simplex onset parse, consonant shortening increases and syllabic compression decreases the right edge to anchor interval. Note that for the centre to anchor interval, both consonant shortening and syllabic compression decrease the centre to anchor interval. By focusing on centre to anchor stability, as we have done in this section, we have chosen an interval that allows us to verify model predictions for consonant shortening and syllabic compression independently. This highlights an important point. There is a distinction between what can be studied with modelling and what can be evaluated in the data. Not all parameter modulations are equally revealing for a given data set. Informative use of the model–data relation requires dual consideration of the particular data set and model predictions. In our case, the structure of the data, segmentally matched CVX~CCVX~CCCVX triads, invites prosodic modulations that, under the hypothesis of simplex onset organisation, bring out revealing patterns of change in the centre to anchor interval.
4.3 From static to dynamic invariance
In this section, we consider implications of our results for the relation between phonological organisation and phonetic indices, a fundamental problem in spoken language research. The central point illustrated in the preceding two sections can be described as follows. Any given syllabic organisation prescribes a range of possible stability patterns, which may overlap with the range of stability patterns from a different syllabic organisation. For instance, we have seen that simplex onset organisation is instantiated in our data in terms of right edge to anchor interval stability, as seen in the overwhelming majority of our data in Table I, but also in terms of centre to anchor interval stability, as seen in the data isolated in Table II. From the perspective of the stability-based heuristics for syllable structure, the former stability pattern is considered as the canonical manifestation of simplex onset organisation (Fig. 2a), whereas the latter stability pattern is considered as the canonical manifestation of complex onset organisation (Fig. 2b).
What is the significance of such results for the classical question of how qualitative, phonological organisation is instantiated in the continuous phonetics? We argue that our results require a change of perspective on this question from the view represented in Fig. 2. Figure 2 states that the relation between phonological organisation and phonetic indices is characterised by static invariance. According to the statically invariant view, the phonetic reflexes of different phonological organisations are fixed, as expressed in statements of the kind ‘simplex onsets surface with right edge to anchor stability’, ‘complex onsets surface with centre to anchor interval stability’, and so on. This is an attractive view, because it makes strong predictions about the relation between phonology and phonetics.
We contrast the static invariance view with the alternative we put forward here, the dynamic invariance view. According to the latter, the reflexes of phonological organisation need not be invariant. This seems to be a retreat from the search for invariance or from a principled theory of the relation between phonology and phonetics. Simplex onset organisation is manifested as right edge to anchor interval stability in one set of circumstances, but also as centre to anchor interval stability in a different set of circumstances. This, however, does not mean that anything goes in the relation between phonological organisation and phonetic indices. In fact, the dynamic invariance view is stronger than the static invariance view, because it offers predictions also in circumstances where the latter view ceases to be valid. In our data, we have seen that the static view ceases to make predictions when prosodic modulations affect the units (consonants and vowels) depicted in the schemas of Fig. 2, or, if it does make any predictions, these are demonstrably wrong, because, as we have seen, the stability patterns can change. In contrast, the dynamic invariance view continues to make predictions also in these cases.
In the dynamic invariance view, any given phonological organisation makes specific predictions about the pattern of change in the phonetic indices as parameters are scaled. Figures 7 and 11 provide concrete examples. Figure 7 instantiates stability predictions (y-axis) of simplex and complex onsets as prevocalic consonant plateau duration (x-axis) is scaled. The pattern of change shown in this figure is an invariant, because it concerns a specific relation between two parameters. The individual parameters themselves are allowed to change, but their relation remains invariant, owing to the phonological organisation they instantiate. Figure 11 also states a relation between stability predictions (y-axis) of simplex and complex onsets as the parameter of syllable compression (x-axis) is scaled. As we have seen (Fig. 11), simplex and complex onset organisations make different predictions about the form of the relation between these two parameters. When compression applies to syllables with simplex onsets, the result is improved centre to anchor interval stability. When compression applies to syllables with complex onsets, the result is degraded centre to anchor interval stability.
In short, qualitative phonological organisations impose constraints on the kinematics in the form of reciprocal relations between phonetic parameters. Invariance is to be found in the distinct relations or patterns of change prescribed by the different phonological organisations, rather than in static statements such as ‘simplex onsets surface with right edge to anchor stability’ or ‘complex onsets surface with centre to anchor interval stability’.
5 Conclusion
Analysis of articulatory data on Moroccan Arabic consonant clusters has revealed clear evidence for the claim that this language disallows complex syllable onsets. Beyond this result we have explored how the natural prosodic variation found in the data interacts with phonetic heuristics for syllable structure.
We adopted at first the static invariance view, whereby fixed phonetic criteria are used to assess phonological structure. In past work, right edge to anchor stability has been used as a phonetic characteristic of syllables with simplex onsets, and centre to anchor stability has been used as a characteristic of syllables with complex onsets. These stability patterns reflect the predictions of canonical or simplified temporal organisations, under the assumption that Cs and Vs maintain constant duration across #CVX, #CCVX and #CCCVX sequences. In our data, these predictions were largely upheld. The same overall stability pattern (right edge to anchor interval more stable than centre to anchor interval) emerged across speakers and across triads with different segmental content constituting both rising sonority profiles, e.g. /lan~flan~kflan/, and falling profiles, e.g. /kulha~skulha~mskulha/.
Through computational simulations, however, we demonstrated that the static invariance view can break down when the assumption of constant C and V durations is not met. Adding consonants to the word, i.e. adding /s/ to /#kulha/ to form /#skulha/, had the effect of compressing segment durations to varying degrees. This compression was reflected in a decrease in the right edge to anchor interval from #CVX to #CCVX, which was found for eleven out of twelve combinations of speaker and dyad, and a decrease in the duration of the prevocalic consonant in #CCVX relative to #CVX, which was found for nine out of twelve combinations. Where these compression effects were strongest, in the /kulha~skulha/ dyad produced by speakers A, B and C, the centre to anchor interval was more stable than the right edge to anchor interval. Thus, whereas in the majority of the data we found clear support for simplex onset organisation, in this data subset we saw a stability pattern that, from the static invariance perspective, is associated with complex onset organisation. This case illustrated, in line with model predictions, how natural prosodic variation can lead to a breakdown of phonetic heuristics. The identification of such conditions is key to improving our understanding of the relation between phonological organisation and the inherently variable and continuous phonetic signal.
We have put forward a new perspective on how phonological organisation is instantiated in continuous phonetics, the dynamic invariance view, and we have shown how this view enables one to reliably diagnose phonological organisation from variable phonetic data. Dynamic invariance, the persistence of reciprocal relations between phonetic parameters across variation in those parameters, makes it possible to provide a unified phonological account of the data. Where static heuristics break down, relations persist between phonetic parameters that distinguish simplex onset organisation from complex onset organisation. We have argued this point analytically, demonstrated it computationally and verified it in the experimental data.
In this perspective, the natural prosodic variability in our experimental data becomes crucial in elucidating the relation between phonological organisation and phonetic indices. It is only when we understand the effects of this variability that we can reliably infer phonological organisation from phonetic data.