I. INTRODUCTION
Recently, a new alloy design concept called high-entropy alloy (HEA) was proposed, which is defined as solid solution alloy with five or more principal elements which should have a concentration between 5 and 35 at.%.Reference Cantor, Chang, Knight and Vincent1,Reference Yeh, Chen, Lin, Gan, Chin, Shun, Tsau and Chang2 These relatively new alloys have attracted increasing interest due to the possibility of producing a combination of high strength, high ductility, and good fracture toughness.Reference Jien-Wei3–Reference Zhang, Liaw and Zhang8 Despite multiphase HEAs, the majority of the studied HEAs are composed of elements which form single phase substitutional solid solutions, of which the substitutional strengthening arises from the lattice distortions.
By the alloy-strengthening concept, interstitial strengthening would be another route to improve mechanical properties in HEAs.Reference Wu, Parish and Bei9–Reference Huang, Jiang, Zhang, Jiang, Lu and Li13 The addition of carbon alloyed into HEAs has been proved to be a successful way to enhance the mechanical properties. The CoCrFeMnNi HEAs doped with 0.5 at.% carbon was first reported that the addition of carbon increased strength and hardening rate in comparison with C-free CoCrFeMnNi alloys due to pronounced activation of mechanical nanotwinning.Reference Wu, Parish and Bei9 Furthermore, the effect of carbon content on structure and hardness was investigated in the same alloys.Reference Stepanov, Yurchenko, Tikhonovsky and Salishchev14 The study of thermomechanical processing on the microstructure and mechanical properties showed that the high strength of the annealed alloy can be attributed to strong grain boundary strengthening and solid solution strengthening by carbon.Reference Stepanov, Shaysultanov, Chernichenko, Yurchenko, Zherebtsov, Tikhonovsky and Salishchev15 However, further understanding is still needed to elucidate deformation mechanisms such as twinning-induced plasticity (TWIP) in the carbon containing HEAs.
As a powerful method to study the micromechanical behaviors, in situ neutron diffraction (ND) has been widely used to investigate the mesoscopic characteristics such as lattice strain evolution of individual hkl diffraction, peak intensity changed by grain reorientation, and peak broadening resulted from local strain during alloy deformations.Reference Yu, An, Chen and Chen16–Reference Van Petegem, Wagner, Panzner, Upadhyay, Trang and Van Swygenhoven23 Only a few research studies have been reported on HEAs studied by in situ ND.Reference Huang, Yu, Yeh, Lee, An and Tu24–Reference Cai, Liu, Kabra, Wang, Yan, Lee and Liu27 The deformation mechanism of CoCrFeMnNi HEAs has been investigated by in situ ND at room temperature and high temperatures, which is found that the dominant deformation mode is the dislocation glide at 800 K and diffusion-controlled dislocation creep at 1000 K, and deformation at room temperature is likely caused by the motion of mixed dislocations.Reference Woo, Huang, Yeh, Choo, Lee and Tu25,Reference Wu, Liu, Wang, Ma, Stoica, Nieh, He and Lu26 An in situ ND study was done on Mo-alloyed FeCoCrNi HEA, which demonstrated the TWIP and microband-induced plasticity.Reference Cai, Liu, Kabra, Wang, Yan, Lee and Liu27 A similar deformation mechanism is expected in the carbon-containing CoCrFeMnNi HEAs from interrupted microscopic observations; however, how the dominating deformation mechanism evolves up on different levels of straining is not clear, thus an in situ ND work is presented here to take the powerfulness of neutrons to reveal this.
The deformation even dominated by deformation twinning often evolves with dislocation slip, which dramatically causes the complexity and difficulty in the analysis of in situ ND. However, it is well known that the formation of deformation twins will be suppressed when temperature is increased. For example, nanotwinning dominates the deformation of CoCrFeMnNi HEAs at cryogenic condition while only dislocation slip happens when temperature is up to room temperature.Reference Wu, Parish and Bei9,Reference Laplanche, Kostka, Horst, Eggeler and George28 Based on the same strategy, the shift of temperature from room temperature to intermediate elevated temperature is expected to hinder deformation twinning in carbon containing HEAs. Thus, the contribution of nanotwinning and slip could be compared in such a scenario.
In the current work, carbon-containing CoCrFeMnNi HEAs’ deformation mechanism is investigated by in situ ND under uniaxial tension at room and elevated temperatures. The micromechanical behavior is analyzed by examining the changes of the lattice strain, peak intensity, and width. The comparison at different temperatures is designed to understand the contribution of twinning and dislocation slip at each condition. Texture measurement is conducted by ND before and after deformation to determine the slipping and twinning-induced texture components. This study is attempting to elucidate the microstructure–texture–mechanical behavior relationship of carbon-containing HEAs.
II. EXPERIMENTAL METHODS
A. Materials and processing
The equiatomic single-phase CoCrFeMnNi alloy was produced with the addition of 0.5 at.% carbon by arc melting in argon atmosphere. The rectangular ingot of CoCrFeMnNi–0.5C was fabricated by drop-casting into a copper mold then homogenized at 1473 K for 24 h, followed by air cooling. The homogenized ingot was cold-rolled along the longitudinal direction to a total thickness reduction of ∼86%. The dog-bone specimens for tensile tests with a gage length of 14 mm were cut from the cold-rolled sheets, followed by recrystallization at 1373 K for 1 h. Before the tensile tests, all faces of sample gage sections were ground through 400-grit SiC papers.
B. In situ ND
ND measurements were performed in situ during tensile loading at the VULCAN diffractometer,Reference An, Skorpenske, Stoica, Ma, Wang and Cakmak29 Spallation Neutron Source at Oak Ridge National Laboratory (Oak Ridge, Tennessee). The tensile tests were carried out at two different temperatures, 293 and 573 K, with the engineering strain rate lower than 10−3 s−1. The specimens were mounted at the load frame with the loading direction (LD) along 45° to the neutron incident angle so that the two neutron collection banks received the diffracted signals from the longitudinal and the transverse directions of the specimen, respectively. The ND data were fitted by single-peak-fitting method using the VDRIVE program (Oak Ridge National Laboratory, Oak Ridge, Tennessee),Reference An50 which was used to determine interplanar lattice spacing (d), diffraction peak intensity (I), and full width at half maximum (FWHM). The lattice strain εhkl was calculated by
 $${\varepsilon _{hkl}} = {{{d_{hkl}} - d_{hkl}^0} \over {d_{hkl}^0}}\quad ,$$
where d hkl is the interplanar lattice spacing of the hkl plane at different load steps, whereas  $d_{hkl}^0$ is the interplanar spacing at the beginning of deformation.
C. Microstructure characterization
The microstructure was examined after tensions in the regions of the center (deformed) and grip (undeformed) regions of the dog-bone–shaped specimen. Both the samples were mounted in the epoxy resin, then ground through 1200-grit SiC paper and polished through 60 nm colloidal silica suspension in the VibroMet vibratory polishing machine (Buehler, Lake Bluff, Illinois) to remove minor deformation remaining after mechanical preparation. Their initial microstructures were examined on a tabletop scanning electron microscope (SEM) operated in the back-scattered electron mode at an acceleration voltage of 15 kV. The electron backscatter diffraction (EBSD) technique was used to investigate both samples on a field emission gun SEM equipped with a TSL OIM EBSD system (AMETEK, Mahwah, New York). The EBSD measurements were performed at an acceleration voltage of 20 kV with a step size of 0.01 µm for high fine scanning and 0.2 µm for coarse scanning.
D. Texture measurement
Texture measurement was conducted before and after room-temperature tensile tests by ND at VULCAN (Oak Ridge National Laboratory, Oak Ridge, Tennessee).Reference An, Skorpenske, Stoica, Ma, Wang and Cakmak29 The initial texture was measured from the grip of the dog-bone specimen and the deformation texture was measured near the fracture surface. The specimen was rotated from 0° to 360° around loading axis with 30° per step and from 0° to 90° around transverse axis with 15° per step. The diffraction peak intensities of single-peak-fitting were used to generate the pole figures, by which the orientation distribution function (ODF) and loading direction inverse pole figures (LDIPFs) were calculated using MATLAB toolbox MTEX.Reference Hielscher and Schaeben51
III. RESULTS
A. Mechanical properties
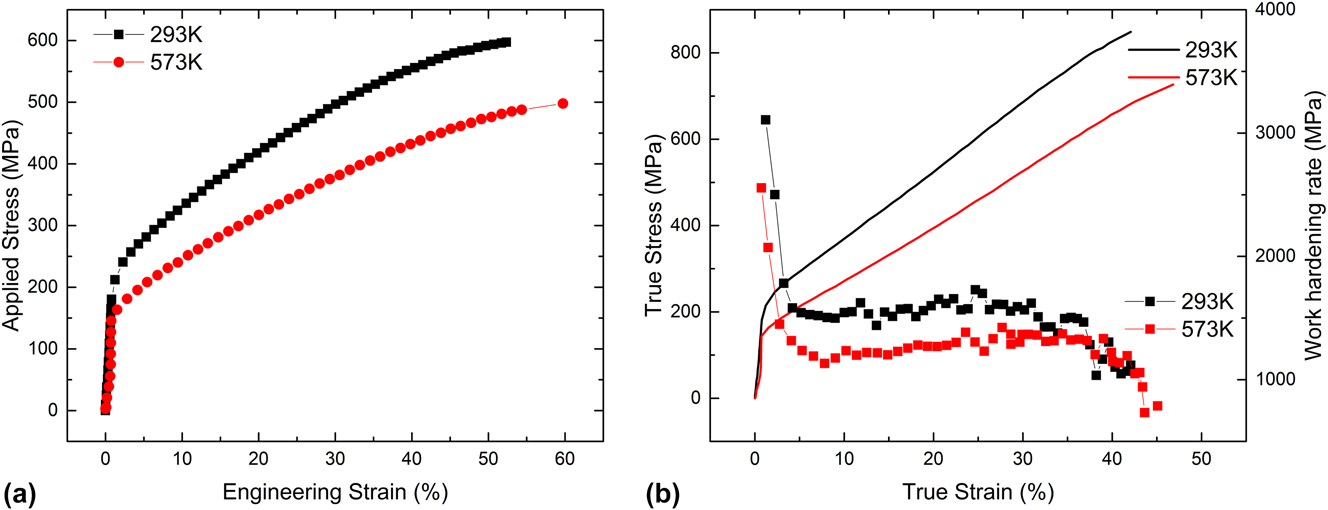
The engineering stress–strain curves of the CoCrFeMnNi–0.5C specimens tested at both temperatures are shown in Fig. 1(a). The yield stress of the specimen deformed at 293 K is about 201 MPa, while the yield stress at 573 K is about 168 MPa. The ultimate tensile stresses (UTSs) are 596 MPa and 495 MPa for 293 K and 573 K, respectively. They both have uniform excellent elongation, and the elongation slightly increases by 7% when the temperature is increased to 573 K. Figure 1(b) shows the true stress–strain curves and the work hardening rate as a function of true strain. Similar hardening behaviors are observed at both temperatures. During the tension at 293 K, the work hardening rate rapidly drops initially till 5% true strain and then maintains constant values of 1.55 GPa. By increasing the temperature to 573 K, the steady work hardening rate starts at slightly larger strain and its value reduces to 1.22 GPa. After a steady stage, the work hardening rate at both temperatures decreases again till fracture.
(a) Engineering stress–strain curves, (b) true stress–strain curves, and work hardening rate as a function of true plastic strain of tensile tests at 293 and 573 K.

B. Microstructure
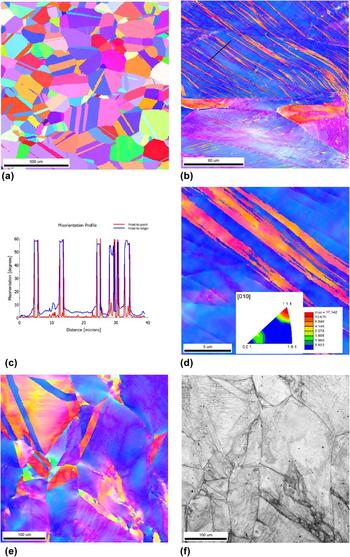
The microstructure of CoCrFeMnNi–0.5C specimens of undeformed and deformed states is shown in Fig. 2 by means of EBSD inverse pole figure (IPF) and image quality (IQ) maps. Equiaxial recrystallized grains are observed after annealing at 1373 K for 1 h as shown in Fig. 2(a). Visible annealing twins exist in most grains, and the average grain size without counting twin boundaries is ∼128 μm. Only the FCC solid solution phase is found without visible precipitates, which is also confirmed by ND. Figure 2(b) is the IPF image showing a deformed microstructure after fracture at room temperature, where extensive parallel deformation twin bands are observed. The twin bands are nearly equal spacing with a width of about 20 μm in the observed grains. Some twin bands cross through the grain with the orientation of 〈111〉//LD. A few spots with uniform color observed at the grain boundary and inside the grain distort the twin bands, which are expected to be carbide precipitates (the amount is not enough for being detected by neutrons) even though EBSD failed to identify them. The scanning along the back line in Fig. 2(b) shows 60° misorientation in Fig. 2(c), indicating that these boundaries are Σ3 twins with surroundings. High resolution IPF image in Fig. 2(d) indicates that the individual twins are less than 20 nm and the twin bundle can exceed 3 mm. By converting the IPF image to LDIPF, the twinning orientation as 〈115〉//LD and the parent orientation as 〈111〉//LD are clearly found, which agrees with the calculation of twinning. The uneven color indicates the orientation fluctuation inside the deformation twins. More interestingly, microbands are observed in the grain oriented close to <100>//LD (red color). When the tensile testing temperature is increased to 573 K, the deformation twin is significantly postponed. Annealing twins still exist, but no deformation twin bands are seen in Fig. 2(e) even after fracture. Severe orientation fluctuation is found in the grain close to 〈100〉//LD orientation. However, 〈111〉//LD-oriented grains exhibit less orientation fluctuation. Different from deformation twin formed at 293 K, narrow microbands are observed at 573 K and the IQ map provides a clearer view of microbands in Fig. 2(f). Similar microbands were also found in a different carbon contained HEAReference Wang, Baker, Cai, Chen, Poplawsky and Guo10 and steels.Reference Yoo and Park30 It is also found that some black spots suspected to be carbides are distributed inside grains in Fig. 2(e).
Microstructure of CoCrFeMnNi–0.5C specimens of undeformed and deformed states: (a) EBSD IPF image of the annealed microstructure (undeformed), (b) EBSD IPF image of the microstructure deformed at 293 K, (c) misorientation profile along the black line in (b), (d) high resolution EBSD IPF image showing deformation twins of the specimen deformed at 293 K with inserted LDIPF, (e) EBSD image, and (f) IQ map of the specimen deformed at 573 K. The IPF coloring is projected to LD.

C. ND
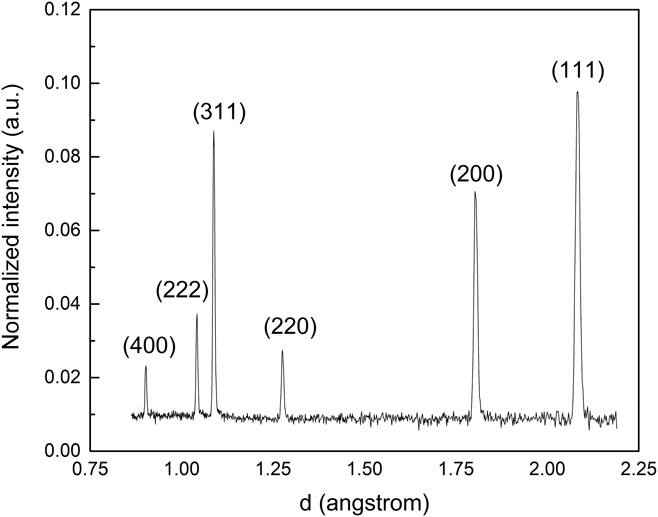
A representative ND pattern of the annealed CoCrFeMnNi–0.5C specimen at 1373 K is illustrated in Fig. 3. The diffraction pattern indicates that a single-phase FCC solid solution was obtained after annealing without detecting any intermetallic or the small carbide precipitates. There is also no secondary phase found during and after tensile deformation at both temperatures.
Representative ND pattern of the CoCrFeMnNi–0.5C specimen annealed at 1373 K.

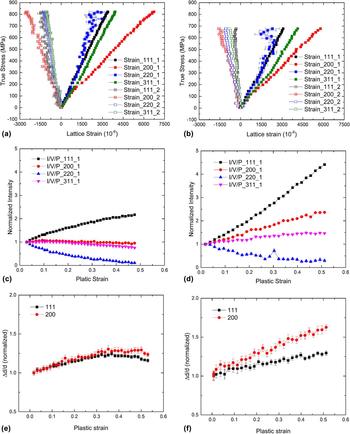
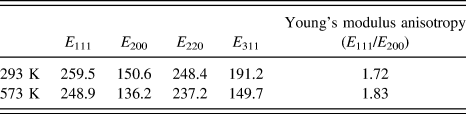
Figures 4(a)–4(f) present the in situ ND results of tension at 293 and 573 K. The lattice strain evolution as a function of applied stresses is shown in Figs. 4(a) and 4(b), where the solid square lines indicate the lattice strain along LD while the open square lines indicate the lattice strain along the transverse direction. First, the lattice strain at 293 K increases linearly below 200 MPa, and it increases linearly below 160 MPa at 573 K during the macroscopic elastic deformation. Then after yield, clear transition points can be found indicating that the stress–lattice strain relationship becomes nonlinear, i.e., the lattice strains deviate from the original elastic linearity significantly. The slopes of each orientation are linearly fitted to provide the diffraction elastic moduli (E hkl), which is summarized in Table I. The (111) grains exhibit the highest diffraction elastic modulus while (100) grains possess lowest diffraction elastic modulus. The Young’s modulus anisotropy (E 111/E 200) increases from 1.72 to 1.83 with temperature elevated to 573 K. In the plastic deformation, the load is redistributed according to different crystallography orientations. In detail, the load transfers from “softer”-oriented grains, e.g., (220), to “harder”-oriented grain, e.g., (200). As a result, the (200) lattice strain increases greatly to bear more load as the applied stress increases, while the (311) and (111) lattice strain evolution is more linear. Note that high fluctuation of the (220) lattice strain derives from the uncertainty of fitting low-intensity peaks where texture evolution plays an important role. The slope of the lattice strain for the (200) grains drops after yield, which also indicates that the (200) grains possess a high directional strength-to-stiffness,Reference Saleh, Pereloma, Clausen, Brown, Tome and Gazder31 which will accommodate more load when the specimen is further tensioned. Comparing two different temperatures, the lattice strain evolution is similar but claims different load distributions. For example, when the stress is applied to 500 MPa, the (311) lattice strain at 293 K is 2490 microstrain (10−6) while that at 573 K is much higher as 3190 microstrain. Considering the diffraction elastic modulus, however, the (311) grains accommodate less load (εhkl × E hkl) when the specimen deformed at higher temperature. Furthermore, the lattice strain distributions of (111), (220), and (311) diffractions are further away from each other at 573 K, indicating that the temperature increases the plastic anisotropy. But the (200) lattice strain does not increase so greatly as (111), (220), and (311) lattice strains by increasing temperature, showing that the (200) lattice strain deviates further from the others at 293 K. It supposes that the formation of deformation twins at 293 K moderates the load in (111) grains compared with that where there are no deformation twins at 573 K, but the lattice strain does not show a significant difference. Poisson’s effect can be found in the transverse direction initially. (220), (111), and (311) transverse lattice strains almost overlap at 293 K, but they split significantly at 573 K.
Evolution of the lattice strain during tension at (a) 293 K and (b) 573 K; normalized intensity evolution as a function of plastic strain during tension at (c) 293 K and (d) 573 K; normalized peak width as a function of plastic strain during tension at (e) 293 K and (f) 573 K.

Diffraction elastic modulus of different grain families in the current CoCrFeMnNi0.5C HEA at test temperature (unit: GPa).

Figures 4(c) and 4(d) display the evolution of normalized intensity as a function of plastic strain during tensile deformation at 293 K and 573 K, respectively. The change of peak intensity gives rise to the grain reorientation during the tensile deformation, which could be due to slip and/or formation of deformation twins. As can be seen in Figs. 4(c) and 4(d), the intensity of (111) diffraction increases while that of (110) diffraction decreases with the increasing strain, implying that the (111) grains are gradually reoriented along LD and (110) grains rotate away from LD, which is similar to dislocation slipping-induced fiber texture during tension in other FCC alloys.Reference Huang, Barabash, Jia, Wang, Ice, Clausen, Horton and Liaw32,Reference Kabra, Danion, Kockelmann and Zhang33 A significant difference between two temperatures is that the intensity of (111) diffraction at 293 K increases by a factor of 2.2 and that at 573 K increases by a much larger factor of 4.5. Furthermore, the increasing intensity of (111) diffraction slows down at higher strain at 293 K, while it keeps increasing linearly at 573 K. The drop of slope results from deformation twinning as the IPF indicates that the 〈115〉 twinning orientation in (111) grains causes the decreasing intensity of (111) diffraction.Reference Xie, Liang, Stoica, Li, Yang, Zhao, Wang, Lan and An19,Reference Liu, Wu, Stoica, Xie, Wu, Gao, Bei and An34 The slip included intensity increase is larger than twinning induced intensity decrease, so the overall effect leads to the drop of the intensity slope at 293 K. On the other hand, the intensity keeps increasing with same rate because only the dislocation slip dominates the deformation at 573 K. The intensities of (200) and (311) diffraction increase at 573 K, which is a typical behavior in FCC materials, but they slightly decrease at 293 K. Strangely, the decreasing intensity of (200) upon plastic deformation at 293 K is different from a common FCC, even with twinning activities.Reference Xie, Liang, Stoica, Li, Yang, Zhao, Wang, Lan and An19 The underlying reason is not clear.
The peak width of (111) and (200) diffraction is deduced from FWHM by subtracting the instrument broadening. The evolution of peak width (Δd/d) as a function of plastic strain is displayed in Figs. 4(e) and 4(f). Figure 4(e) shows that the peak width increases with strain initially, then transits to a constant evolution and drops at the end of deformation at 293 K. Whereas, the peak width at elevated temperature increases monotonically during the entire plastic deformation as shown in Fig. 4(f). The change of peak width can be used to investigate the deformation heterogeneities (such as dislocation and stacking fault) which contribute to peak broadening.Reference Woo, Huang, Yeh, Choo, Lee and Tu25,Reference Ungar, Gubicza, Ribarik and Borbely35,Reference Ungar, Ribarik, Gubicza and Hanak36 The slope transition of the peak width can be regarded as a sign of deformation twinning based on the above EBSD observation of deformation twins and the slope change of intensity evolution, which also agrees with the finding of deformation twinning onset at the strain level around 32.5%.Reference Wu, Parish and Bei9
D. Texture
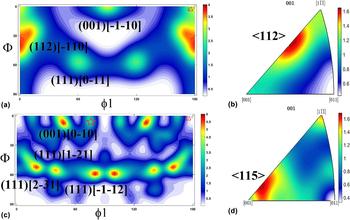
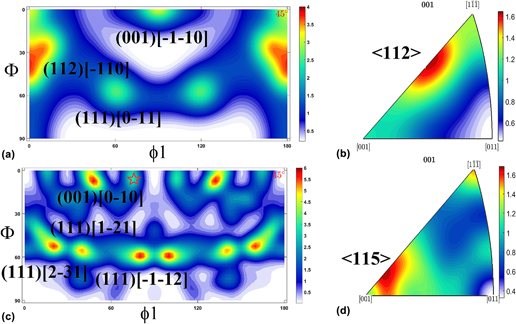
The crystallographic texture of undeformed and deformed states is characterized by ODF and LDIPF at room temperatures. Figure 5 presents the ND determined texture in LD. The ODF at sections of ϕ2 = 45° is illustrated to investigate the main texture components. As can be seen in Fig. 5(a), the initial texture of the annealed specimen consists of a strong (112) $\left[ {\bar{1}10} \right]$ texture with the highest intensity of 4, followed by (001)
 $\left[ {\bar{1}\bar{1}0} \right]$ and (111)
 $\left[ {0\bar{1}1} \right]$ texture components. Even the annealing process completely recrystallizes the deformed grains after rolling, the rolling texture is not fully eliminated. Accordingly, the LDIFP of the undeformed specimen in Fig. 5(b) illustrates the 〈112〉//LD texture component. After deformation at 293 K to fracture, the texture reflects a combination of twinning and slip. Dislocation slip-induced fiber texture is specified as (111)
 $\left[ {2\bar{3}1} \right]$, (111)
 $\left[ {1\bar{2}1} \right]$, and (111)
 $\left[ {\bar{1}\bar{1}2} \right]$ texture components in the ODF at a section of ϕ2 = 45° in Fig. 5(c). The texture component marked as a star is (115)
 $\left[ {\bar{5}\bar{5}2} \right]$ orientation, which is a typical twinning texture component in FCC metals.Reference Christian and Mahajan37 A strong fiber texture 〈111〉//LD is induced by dislocation slip, as shown in Fig. 5(d), with a noticeably strong texture component near 〈115〉//LD attributed to the formation of deformation twins. Similar to twinning-induced plasticity steels,Reference Yan, Carr, Callaghan, Liss and Li38 twinning occurs in the {111}〈112〉 twin system and transforms to the {511}〈255〉 orientation, which generates 〈115〉//LD in LDIPF. The twinning texture component of ODF is in accordance with the result of EBSD in the local area in Fig. 2(d).
(a) ODF at a section of ϕ2 = 45° and (b) LDIPFs of the undeformed specimen; (c) ODF at a section of ϕ2 = 45° and (d) LDIPFs of the specimen after tension test at 293 K.

IV. DISCUSSION
The purpose of the current work is to elucidate the deformation mechanism and micromechanical behaviors by fully utilizing in situ ND. The following investigation will be discussed on the elastic and plastic deformations.
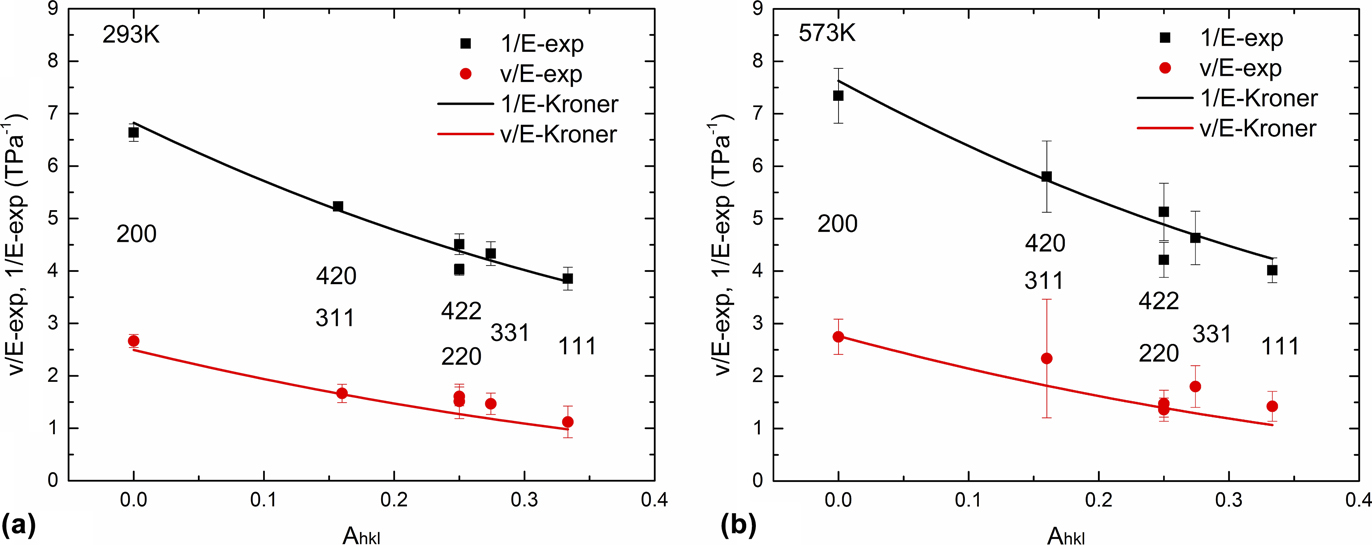
To better understand the elastic deformation of the current alloy and the effect of carbon on elastic properties at different temperatures, the well-known Kröner modelReference Kröner39 is applied by analyzing diffraction elastic moduli (Table I) obtained by in situ ND. The diffraction elastic behavior varies from differently oriented grains due to the crystallographic elastic anisotropy. The diffraction elastic modulus is plotted as a function of the cubic elastic anisotropy factor (A hkl) in Fig. 7. The cubic elastic anisotropy factor (A hkl) is defined as
 $${A_{hkl}} = {{{h^2}{k^2} + {k^2}{l^2} + {h^2}{l^2}} \over {{{\left( {{h^2} + {k^2} + {l^2}} \right)}^2}}}\quad .$$
The relation of diffraction elastic modulus and A hkl is correlated through single-crystal elastic constants in the Kroner model. Deriving from the Kroner model by the self-consistent method,Reference Wang, Stoica, Ma and Beese40 the single-crystal elastic constants of the current alloys at different temperatures are obtained. The calculated curves by the Kroner model are plotted in Fig. 6 as well as the experimental results, indicating that the model can describe the elastic behaviors reasonably well in the current alloys. The corresponding elastic constants, shear anisotropy, and bulk modulus are summarized in Table II, which can be used for simulation methods like crystal plasticity finite element method and elastoplastic self-consistent modeling. It is found that the elastic constants of the current alloys are c 11 = 227.1 GPa, c 12 = 158.7 GPa, and c 44 = 135.7 at 293 K, while c 11 = 199.5 GPa, c 12 = 138.2 GPa, c 44 = 122.2 GPa at 573 K, respectively. The bulk modulus reduces with the increased temperature, but the shear anisotropy changes a little. Comparing with the elastic properties of the CoCrFeMnNi HEA,Reference Wu, Liu, Wang, Ma, Stoica, Nieh, He and Lu26 the addition of carbon enhances the bulk modulus significantly from 158.5 to 209.1 GPa at room temperature. The shear modulus also increases from 2.84 to 3.97 by adding 0.5 at.% carbon. High elastic anisotropy is considered to cause deformation complexity since different grain families experience significantly different stresses. The (200) grains might be expected to yield relatively early based on the Schmidt factor and the applied stress, but experimentally grain families such as (220) and (331) would yield first showing the lattice strain curve upwards into compression. The yield of specific grain family presented on lattice strain-stress curve is shown as the changing of slope, resulting in the curve going up with a higher slope or even going back with a negative slope.
Elastic moduli plotted as a function of elastic anisotropy factor A hkl and fitted with the Kroner model at (a) 293 K and (b) 573 K. v is the Poisson’s ratio and E is the diffraction elastic modulus.

Single-crystal elastic constants and anisotropy of the CoCrFeMnNi0.5C alloys in comparison with those of CoCrFeMnNi without carbon.

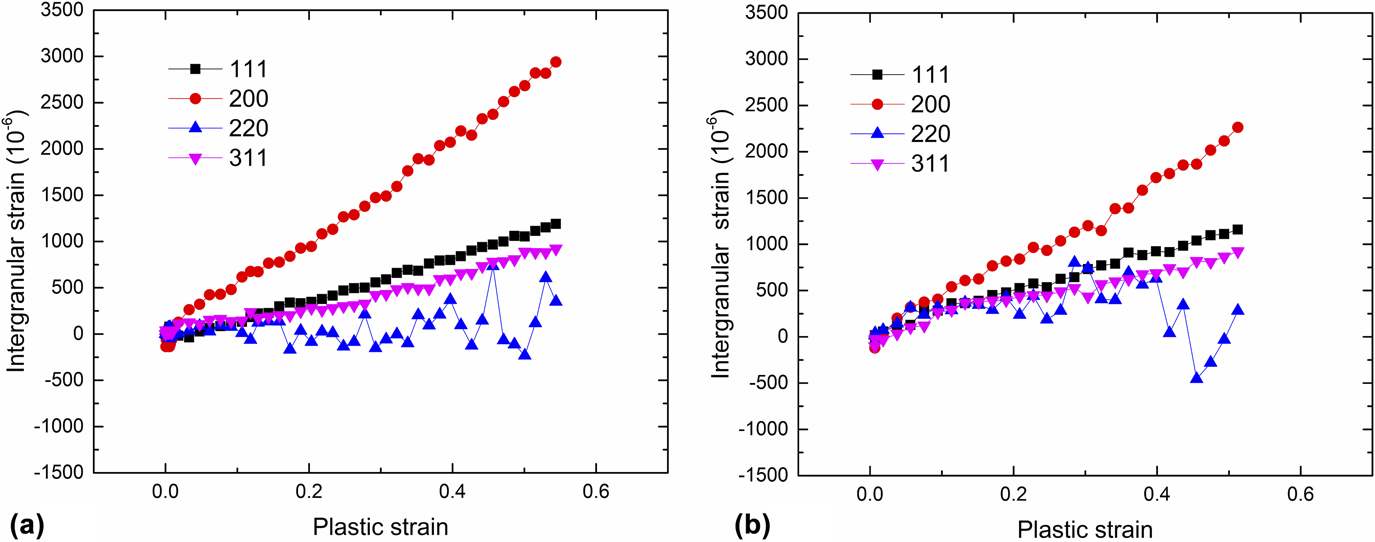
While the plots such as in Figs. 4(a) and 4(b) show both the elastic and plastic contribution to the total intergranular lattice strain of different grain families, it can be instructive to only investigate the plastic intergranular strain. An alternative investigation of micromechanical behavior is to derive the intergranular strain εr, which is the difference between the total lattice strain εhkl and the extrapolated line along elastic modulus E hkl, defined as εr = εhkl − σ/E hkl, where σ is the applied stress. The intergranular strains of (111), (200), (220), and (311) grain families are plotted as a function of plastic strain in Fig. 7. It is found in Fig. 7(a) that the (200) grains experience the largest intergranular strain with the highest slope, which elucidates that such grains bear the largest share of the applied stresses and move into tension relative to elastic linearity. The (111) and (311) grains show increasing intergranular strain with smaller slopes compared to the (200) grains. Interestingly, the intergranular strain of the (220) grains fluctuates around a constant close to zero and the fluctuation increased when the specimen is further strained. The deformation twins form at a relatively larger strain level; however, the twinning does not affect the stress redistribution significantly as evidenced in Fig. 7(a). Behavior of intergranular strain evolution at 573 K is shown in Fig. 7(b). The trend of intergranular strain evolution is similar to that at 293 K, but the magnitude is slightly smaller, especially for the (200) grains. Considering the abnormal change of (200) intensity in Fig. 4(c), the fact that (200) grains rotate away from LD could probably lead them to take more stress at 293 K. The total lattice strain at a given macroscopic strain experiences reduction in the magnitude from 293 to 573 K. Two competing effects may take place as the temperature is elevated. High temperature would reduce the stress required for a given macroscopic strain, which hence reduces the total lattice strain. On the other hand, high temperature reduces the elastic moduli, which evidently leads to a larger lattice strain for a given applied stress. It should also be noted that based on composite mechanics, some other oriented grains should share compressive stresses to balance the overall tensile intergranular strain showed in Fig. 7.
Intergranular strain as a function of plastic strain at (a) 293 K and (b) 573 K

Due to high penetration of neutrons, ND is considered as a perfect method to determine the bulk texture in metals and alloys. Being the direct result from in situ ND, the change of peak intensity accounts to grain reorientation during deformation, which can be induced by dislocation slip, rotation of grain, and/or the formation of deformation twins.Reference Woo, Huang, Yeh, Choo, Lee and Tu25 Generally, the formation of twinning in the grains oriented to satisfy the diffraction condition could lead reduction of original grain diffraction intensity of the twinned region; on the other hand, new grain orientations that fit the diffraction condition can increase the diffraction intensity of such oriented grains.Reference Brown, Bourke, Stout, Dunn, Field and Thoma41 As mentioned before, the dislocation slip will increase the (111) peak intensity during uniaxial tensile deformation in FCC metals, while the formation of deformation twins do also affect the (111) peak intensity, that is, twinning in the {111} system to the {511} direction will reduce the (111) peak intensity. In other words, the change of the (111) peak intensity is the convoluted competition of slip and twinning, so it becomes difficult to separate the contributions of slip and twinning to the measured peak intensity change. However, in the current study, the contribution of twinning to the (111) peak intensity is qualitatively determined by comparing the peak intensity change rate with and without deformation twinning in Figs. 4(c) and 4(d), which is supported by the EBSD microstructure observation. This finding agrees with the ex situ study of twinning formed in the same alloy by EBSD.Reference Wu, Parish and Bei9 Deformation twinning does not take place during the deformation at 573 K, so the (111) intensity change is solely due to the grain reorientation by the dislocation slip, showing a higher rate than that of the (111) intensity change moderated by twinning during 293 K tension. As a result, the peak intensity change is much smaller at 293 K by a factor of 2.2 in Fig. 4(c). The ODF of deformed specimens further confirms the twinning orientation of (115) $\left[ {\bar{5}\bar{5}2} \right]$ in Fig. 5. By calculating the twinning orientation from 〈111〉//LD to 〈115〉//LD, it turns out that a detector positioned at 141° to LD is expected to detect the intensity increase of the twinning region, which needs further investigation.
The current study manifests the improvements in mechanical properties of the carbon-containing HEA compared to its substitutional HEAs are due to the multiple strengthening mechanisms, i.e., solid solution strengthening, twinning/microband-induced plasticity. In the current studied HEAs without precipitates, the yield strength (σy) for the annealed specimen can be described byReference Wu, Gao and Bei42
 $${\sigma _{\rm{y}}} = {\sigma _{\rm{r}}} + \Delta {\sigma _{\rm{g}}}\quad ,$$
where σr is the lattice friction stress and Δσg is the strengthening contribution from grain boundaries. Since the grain sizes are as large as 128 μm, the grain boundary strengthening effect could be negligible. Hence, the major contribution to the increase in yield strength comes from the increase in the lattice friction stress due to the carbon interstitial strengthening, similar to the behavior in other interstitial HEAs.Reference Wang and Baker11 The yield strength reduces at an elevated temperature of 573 K which is mainly due to the temperature dependence of the lattice friction stress.Reference Varvenne, Luque and Curtin43
At the early stage of plastic deformation after yielding, the dislocation movement is hindered by the interstitial carbon to increase the work hardening to a steady rate. Although the tendency of the work hardening rate versus strain curve looks similar, the value of the hardening rate is larger for the curves deformed in room temperature, and the difference might be attributed to the additional hardening because of the deformation twinning, which prompts additional dislocation-twining boundary interactions.Reference Idrissi, Renard, Ryelandt, Schryvers and Jacques44,Reference Rahman, Vorontsov and Dye45 The increasing dislocation density induced by plastic deformation will cause the peak broadening of ND. Similar to another carbon-doped HEA,Reference Wang, Baker, Cai, Chen, Poplawsky and Guo10 the lattice friction stress increased sharply by the addition of carbon, along with the reduction of stacking fault energy (SFE), producing the transition of dislocation slip mode from wavy slip to planar slip. The strong solid solution hardening of the carbon interstitial atom makes the dislocation-mediated plasticity (slips) much more difficult; thus, the critical stress needed to activate twinning can be easily achieved due to the increase in the work hardening rate. The Shockley partial dislocations are more separated since the cross slip is inhibited with the reduction of SFE; thus the formation of deformation twin easily occurs when separated Shockley partial dislocations pass on every {111} slip plane,Reference Mahajan and Chin46 which results in the peak intensity change of (111) diffraction. The nanosized deformation twinning mediates the plastic deformation instead of the dislocation slip, which slows down the increase of peak width. Simultaneously, microbands form in the grains those are not favored for twinning by the calculation of the Schmid factor, when perfect dislocations become hard to move; hence, they move into localized bands.Reference Yoo and Park30 The simultaneous formation of twins and microbands has been reported in several other materials,Reference Gutierrez-Urrutia and Raabe47–Reference McCabe, Beyerlein, Carpenter and Mara49 which is attributed to the role of grain orientation on both deformation twinning and microband formation. When the temperature is elevated, higher SFE and relatively lower work hardening postpone the formation of the deformation twin; whereas, the microbands form to dominate further plastic deformation.
V. SUMMARY AND CONCLUSIONS
In summary, the current work elucidates that the plastic deformation of CoCrFeMnNi–0.5C at room temperature is governed by the dislocation slip at small strain level and then mediated by deformation twinning and microbands simultaneously; while at an elevated temperature of 573 K, it is controlled by the dislocation slip at the early stage but then mediated by microbands at the high strain level. The deformation mechanism and micromechanical behavior of CoCrFeMnNi–0.5C are investigated by in situ ND under uniaxial tensile deformation at 293 and 573 K. The crystallographic texture of undeformed and deformed specimens is measured by ND. The main conclusions are as follows:
(1) The addition of 0.5 at.% carbon to CoCrFeMnNi HEA increases the yield strength, UTS, as well as work hardening compared to substitutional CoCrFeMnNi HEA.
(2) The plastic deformation is dominated by dislocation slip at the early stage at both temperatures. At high strain level, deformation is mediated simultaneously by deformation twins and microbands at 293 K while it is governed solely by microbands at 573 K.
(3) The lattice strain evolution is similar to that in other FCC materials and the deformation twin does not affect the lattice strain evolution significantly compared with the micromechanical behaviors at both temperatures. The investigation of peak intensity and FWHM provides the alternative evidence of twinning activities.
(4) The texture measurement represented by ODF indicates that the annealed specimens possess a strong texture component of {112}〈110〉, and the tension deformed texture consists of the slip-induced fiber texture and twinning-induced {115}〈552〉 texture component.
ACKNOWLEDGMENTS
This research is supported by the U.S. Department of Energy (DOE), Office of Science, Basic Energy Sciences (BES), Materials Science and Engineering Division. Neutron scattering was conducted at the Spallation Neutron Source (SNS), which is DOE Office of Science User Facilities operated by ORNL. The authors thank Drs. Dunji Yu, Yan Chen, Qingge Xie as well as Mr. Matt Frost in SNS, ORNL, for technical assistance in neutron scattering and data reduction, texture analysis and tensile setup.