I. INTRODUCTION
Silicon carbide (SiC) is a promising semiconductor for high-power, high-temperature and high frequency applications, owing to its wide band gap, high breakdown field, high thermal conductivity, and high saturation electron velocity.Reference Treu, Rupp, Blaschitz and Hilsenbeck1 SiC has been used to fabricate high-power Schottky barrier diodes (SBDs),Reference Zhang, Madangarli and Sudarshan2 metal semiconductor field effect transistors (MESFET),Reference Hjelmgren, Andersson, Eriksson, Nilsson, Sudow and Rorsman3 and photoconductive semiconductor switches (PCSSs).Reference Zhu, Johnstone, Leach, Fu, Morkoc, Li and Ganguly4–Reference Kelkar, Islam, Kirawanich, Fessler and Nunnally6 PCSSs have been investigated for many pivotal applications such as in microwave- and millimeter wave generation, impulse radar, and pulsed power systems.Reference Loubriel, Zutavern, Baca, Hjalmarson, Plut, Helgeson, Omalley, Ruebush and Brown7 Due to the advantages mentioned above, semi insulating SiC is more suitable than semi insulating silicon (Si) and gallium arsenide (GaAs) for use in the fabrication of PCSSs.Reference Auston8–Reference Shi and Tian10
The photoconductive response of high-resistivity SiC was reported in 1990s.Reference Saddow, Cho, Goldhar, Lee and Neudeck11–Reference Sudarshan, Gradinaru, Korony, Mitchel and Hopkins13 SiC exhibited high-response speed and expectation in high-power applications; however, the dark current was high because of the relative low resistivity of the SiC substrate. With the developments of the vanadium-compensated semi insulating SiC (with resistivity of more than 109 Ω cm) in the 2000s, SiC PCSSs with low dark current, high-speed response, and high power were fabricated.Reference Dogan, Teke, Huang, Morkoc, Roberts, Parish, Ganguly, Smith, Myers and Saddow14–Reference Kelkar, Islam, Fessler and Nunnally16 However, the on-state resistances were in the range from 102 Ω to 104 Ω (with 1.75-mm channel)Reference Zhu, Dogan, Moon, Leach, Yun, Johnstone, Morkoc, Li and Ganguly17 that limited its applications in the high-current and high-power fields. Some efforts were made to decrease the on-state resistance. High-temperature hydrogen (H2) etching was introduced to remove the surface damage, which could decrease the on-state resistance.Reference Dogan, Teke, Huang, Morkoc, Roberts, Parish, Ganguly, Smith, Myers and Saddow14 Besides, the highly n+-doped gallium nitride (n+-GaN) subcontact layer was reported to decrease the contact resistance significantly.Reference Zhu, Johnstone, Leach, Fu, Morkoc, Li and Ganguly4, Reference Zhu, Dogan, Moon, Leach, Yun, Johnstone, Morkoc, Li and Ganguly17 The on-state resistances were decreased to about 10–100 Ω (with 1 mm–1.75 mm channel)Reference Dogan, Teke, Huang, Morkoc, Roberts, Parish, Ganguly, Smith, Myers and Saddow14, Reference Zhu, Dogan, Moon, Leach, Yun, Johnstone, Morkoc, Li and Ganguly17 by those technologies mentioned above. However, to meet the demands in the high-current field, the on-state resistance should be decreased further. The on-state resistance of the SiC PCSSs includes contact resistance and intrinsic resistance, which mainly depend on the properties of the SiC substrate. Therefore, it is necessary to study the relationship between the quality of the SiC substrate and the on-state resistance. This article provides results on the relationship between the Full Width at Half Maximum (FWHM) of the rocking curve of the SiC substrates and the on-state resistance, which provides a reference for the selection of 6H–SiC substrates for the fabrication of PCSSs and some other photoelectric devices. In addition, a method of measuring the photoconductive capacity of the SiC PCSSs is extended.
II. EXPERIMENTAL SETUP
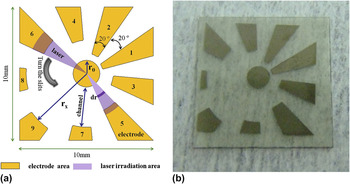
We have used different semi insulating SiC ingots grown by physical vapor transport (PVT) method for this research. After wire sawing, double side lapping, mechanic polishing (MP) and Chemical-mechanical polishing (CMP), we got Si-face polished SiC wafers. We chose 6 Si-face polished SiC wafers from different SiC ingots. Then these wafers were sliced to 10 × 10 mm square pellets. For each wafer, one square pellet in the center was chosen to fabricate PCSSs. Then we had 6 Si-face polished 10 × 10 mm SiC square pellets from different SiC ingots. The FWHM of rocking curve was measured by Brucker D8 Discover x-ray diffraction (XRD; Bruker Corporation, Karlsruhe, Germany) at nine points for each pellet. The average FWHM values of rocking curve were used to evaluate the pellet crystal quality. These SiC square pellets were cleaned by Radio Corporation of America (RCA) method of cleaning for organic contaminants, oxide strips, and ionic contamination, then passivated by H2 and hydrochloric acid (HCl) etching at 1300 °C in a chemical vapor deposition (CVD) reactor before fabricating PCSSs. For getting sufficient experimental data to fit the physical model for the on-state properties of SiC PCSSs, we designed nine PCSSs with channel lengths from 0.25 to 4 mm in each pellet, as shown in Fig. 1(a). A dot with diameter of 2 mm is at the center of the substrate as a common electrode, and other electrodes are around the central electrode with different channel lengths. Then each outside electrode and the center dot electrode become a PCSS together. When testing the PCSSs, we put the positive electrode of the voltage source on the center dot, and put the negative electrode of voltage source on the different outside electrodes, respectively. By this method, we can get nine sets of data from nine PCSSs fabricated on one 10 × 10 mm SiC square pellets. Both the angles of and between each electrode are 20°. The radius of the center dot r 0 is 1.0 mm, whereas rx [“x” represents the serial number of the electrodes as shown in Fig. 1(a)] is the distance from center to the edge of the outside electrode. In this design, r 1 = 1.25 mm, r 2 = 1.5 mm, r 3 = 2.0 mm, r 4 = 2.5 mm, r 5 = 3.0 mm, r 6 = 3.5 mm, r 7 = 4.0 mm, r 8 = 4.5 mm, r 9= 5.0 mm. Therefore, the channel lengths of the nine PCSSs are 0.25, 0.5, 1, 1.5, 2, 2.5, 3, 3.5, and 4 mm, respectively.
Schematic of the designed 9 PCSSs with different channel lengths on a 10 × 10 mm substrate (a) and the corresponding sample fabricated in our experiments (b). A dot on the center of the substrate as a common electrode, and other electrodes with different channel lengths are around the central electrode. Both the angles of and between each electrode are 20°. The radius of the center dot r 0 is 1.0 mm, whereas rx (“x” represents the serial number of the electrodes) is the distance from center to the edge of the outside electrode. In this design, r 1 = 1.25 mm, r 2 = 1.5 mm, r 3 = 2.0 mm, r 4 = 2.5 mm, r 5 = 3.0 mm, r 6 = 3.5 mm, r 7 = 4.0 mm, r 8 = 4.5 mm, r 9= 5.0 mm. Therefore, the channel lengths of the nine PCSSs are 0.25, 0.5, 1, 1.5, 2, 2.5, 3, 3.5, and 4 mm, respectively.

To fabricate the nine PCSSs on the 10 × 10 mm SiC square pellets, we designed the corresponding mask for photolithography first. Through the photolithography process, the design as shown in Fig. 1(a) was patterned on the 10 × 10 mm SiC square pellets. Then the patterned SiC square pellets were placed into the vacuum chamber with a background vacuum of 7.8 × 10⁻⁵ Pa. 70 nm nickel (Ni) was deposited by magnetron sputtering in a 1.8 Pa argon ambience. Excess metal was removed by lift-off procedure. Rapid thermal annealing (RTA) was performed in an argon ambience at 1000 °C for 2 min for the formation of ohmic contact properties. After these processes, six samples, each of which has nine PCSSs with different channel lengths, have been prepared. Figure 1(b) is one of the samples fabricated in our experiment. Hereafter, the six samples are designated as sample 1 to sample 6.
The photoconductivity of each PCSS was measured under a negative direct current (DC) voltage source using a Continuum Surelite EX YAG laser (Continuum, Santa Clara, CA). The laser has a seed to make sure that the temporal profile of the laser pulse is very smooth. This laser also provides a uniform distribution of intensity (<15%) across the beam profile while minimizing hot spots and modulation. By two frequency-doubling crystals, the 1064 nm laser was changed to 355 nm laser. We use the 355 nm laser pulse with FWHM of about 10 ns to excite the PCSSs. The laser density was about 127 μJ/mm2, and the stability of the laser energy was ±4%. The laser beam was focused to be a round spot with a diameter of 10 mm. A wedge-shaped slit was placed in front of the sample. The laser was irradiated on each PCSS by turning the angle of the slits. The voltages on the PCSSs were detected by voltage probe, whereas the currents through the PCSSs were detected by current viewing resistor (CVR). The voltage and current results were recorded by Tektronix DPO4104 oscilloscope (Tektronix, Inc., Beaverton, OR).
III. RESULTS AND DISCUSSION
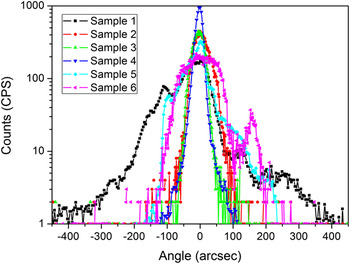
The FWHM of rocking curve measured by high-resolution x-ray diffraction can be used to evaluate the crystal quality. The lower FWHM means the higher crystal quality. The 6H–SiC defects, such as micropipes, dislocations, and low-angle grain boundaries, can influence the shape of rocking curve. The rocking curves of the 6H–SiC pellets used in this study were showed in Fig. 2. The rocking curves of sample 2, sample 3, and sample 4 are very sharp single peaks, which suggest very good quality of the SiC substrates. The rocking curves of sample 1, sample 5, and sample 6 broaden a lot and have satellite peaks, which indicate the bad crystallinity of the substrates. As shown in Table I the average FWHM of the rocking curves from sample 1 to samples 6 are 125.7, 48.9, 39.7, 33.4, 81.3, and 106.6 arcsec, respectively. Therefore, the order of the 6 SiC substrates quality from high to low is sample 4, sample 3, sample 2, sample 5, sample 6, sample 1.
Typical HRXRD rocking curves of different 6H–SiC substrates used in PCSSs.

The FWHM of the rocking curves, (G − R)·μ, and C for the samples.

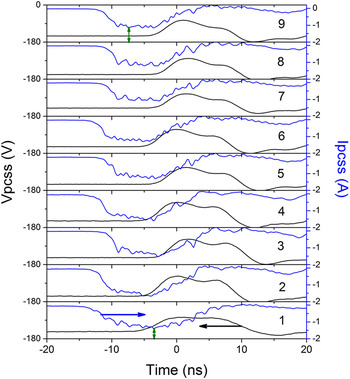
The 6H–SiC PCSSs were measured under a bias voltage of about −150 V. Figure 3 shows the typical voltage (Vpcss) and current (Ipcss) pulses of the PCSSs on sample 4. The PCSSs have very fast response with rise time of about 4.7 ns and fall time of about 5.1 ns. The FWHM of the current pulse is about 7.3 ns, which is consistent with the laser pulse. In this work, the on-state resistances R on were calculated by dividing the current through the PCSS (Ipcss) by the on-state voltage (Vpcss). The peak current value and the peak voltage value were taken to calculate R on. Therefore, the R on here is the minimum resistance during the laser pulse excitation. For each 6H–SiC PCSS, nine R onvalues were obtained. It is worth noting that we use the negative voltage source in the testing of PCSSs, so the Vpcss and Ipcss values were negative.
The typical Vpcss and Ipcss pulses of 9 SiC PCSS fabricated on a V doped SiC substrate (sample 4) tested at 150 V.

For the nine PCSSs in sample 4, the properties of the SiC substrate for each PCSS are almost the same, in addition, all the nine PCSSs were fabricated under the same process, so their contact resistance should be almost the same. Therefore, the Vpcss and Ipcss differences among PCSSs are induced by the resistance differences of the SiC substrates in the channels. Figure 3 shows the Vpcss and Ipcss pulses with the increasing channel lengths. The two-way arrows show the distances from peak of Ipcss to −2 A. From PCSS 1 to PCSS 9 the distances become farther obviously. It means that the current through the PCSSs (Ipcss) decreases with the increasing channel gap. From Fig. 3 it is difficult to observe the change of Vpcss. The decreasing of current and the nonchanging of voltages suggest the increase of the on-state resistances R on of the PCSSs. It is reasonable to infer that the on-state resistances R onincrease with the increasing lengths of the PCSS channels.
With laser pulse irradiating the channel of each PCSS by turning the angle of the slits, large numbers of electrons and holes generate as free carriers in the channel area in 6H–SiC, which turn the SiC substrates from semi insulating state to the conductive state. The on-state resistance R on is the resistance of this conductive state. It was reported that at 470 K the mobility of vanadium-doped semi insulating 4H–SiC is about 40 cm2/Vs.Reference Mitchel, Perrin, Goldstein, Saxler, Roth, Smith, Solomon and Evwaraye18 According to this data, the mobility at 300 K is calculated to be about 58 cm2/Vs by extrapolation. As the mobility of 6H–SiC is about half of the 4H–SiC, the mobility of 6H–SiC at 300 K should be around 30 cm2/Vs. For the PCSS with 1 mm channel length under 150 V, the electric field strength is 1500 V/cm. When laser irradiates the SiC in about 10 s, the electrons will drift for about 45 μm. The diffusion length is considered much less than the drift length. Compared with the 1-mm channel length, the electron diffusion length arising out of laser pulse irradiation lasting a few nanoseconds can be ignored. The absorption coefficient of 6H–SiC under 355 nm laser is about 930 cm−1.Reference Sridhara, Eperjesi, Devaty and Choyk19 The penetration depth when laser intensity attenuating to 1/e is calculated to be only 10.7 μm. During the laser pulse irradiation, the carriers are just on the surface of SiC. Therefore, the following derivation of the on-state resistance of PCSSs (R on) is based on the following two assumptions: (i) The free carriers are considered to transport just in the laser-irradiated area, because the diffusion effect of the carriers in just few nanoseconds is slight; (ii) The carriers are considered to transport on the surface of the SiC substrates due to the penetration depth in 6H–SiC is just about 10.7 μm for 355 nm laser. In the schematic in Fig. 1(a), the resistance for the “dr” is
 $$dR(r) = dr/(nq{\rm{\mu }}S)\quad,$$
where n is the carrier density, q the electron charge, S the cross section of the current flow, μ the carrier mobility ( ${\rm{\mu }} = {\rm{\mu }}_n + {\rm{\mu }}_p $), and r the distances from outside electrodes to the center as shown in Fig. 1(a). In this work, the photoconductive properties are studied under low field. The impact ionization and some other nonlinear carrier generation mechanisms can be ignored. The carrier density n under laser excitation can be written as
 $$n = (G - R)(1 - {\rm{Re}})E_a /h\nu \quad,$$
where Ea, G, R, Re, and hν are the laser density, the carrier generation rate, the carrier recombination rate, the reflectivity, and the energy of a single photon, respectively. By integration, the on-state resistance R onis expressed as follows,
 $$R_{{\rm{on}}} \, = \,\{ 9h\nu /[(1 - {\mathop{\rm Re}\nolimits} )(G - R){\rm{\pi }}E_a q{\rm{\mu }}]\} \ln (r_x /r_0 ) + C\quad,$$
where r 0 is the radius of the center dot electrode, and rx (“x” represents the serial number of the electrodes) is the distance from center to the edge of the outside electrode. C is a constant for each SiC substrate. C is considered to be related to the contact resistance and other parameters that affect the on-date resistance in this method. It is hard to distinguish the contact resistance from C.
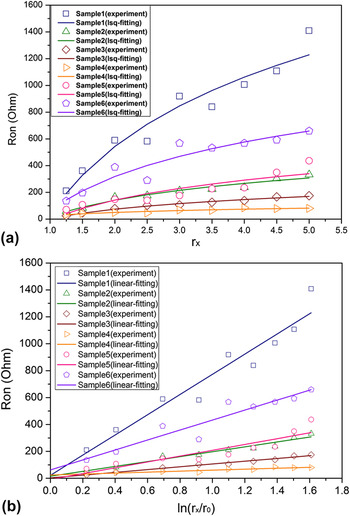
By the least-squares curve fitting method, we use Eq. (3) to fit our experimental data, as shown in Fig. 4(a). In this experiment Ea = 127 μJ/mm2, and the reflectivity Re is 0.25.Reference Huang, Chen, Chen, Li, Chang, Yan and Shi20 Generally, the experimental data fit well with the theoretical curve [solid lines in Fig. 4(a)]. After fitting, we got the value of (G − R)·μ [with unit: (V S cm)−1] and C. For sample 1, (G − R)·μ is 1.4 × 10⁻⁴, and C is −30, whereas 5.8 × 10⁻⁴ and −7 for sample 2, 10.1 × 10⁻⁴ and −4.2 for sample 3, 29.3 × 10⁻⁴ and −0.75 for sample 4, 4.9 × 10⁻⁴ and −9.1 for sample 5, 2.8 × 10⁻⁴ and −13.5 for sample 6, as shown in Table I. The (G − R)·μ value increases in the order of sample 1, sample 6, sample 5, sample 2, sample 3, and sample 4. The ascending order of the value of C is the same with (G − R)·μ. The (G − R)·μ value is related to the quality of the SiC substrates. Therefore, the constant C is also related to the quality of SiC substrates. However, besides the contact resistance, we do not know of any other parameters affecting the on-state resistance in this model yet. In addition to the possibility of existence of such other parameter or parameters, this unknown parameter may have a greater impact on the value of C. This is due to the fact that the fitted value of C is negative, and the contact resistance should not be negative. Nevertheless, we can study the relationship between (G − R)·μ and the SiC substrate quality according to Eq. (3).
(a) The least-squares curve-fitting of R on and rx based on Eq. (3). (b) is relationships between ln(rx/r 0) and the R on.

From Eq. (3), we can also find that the relationship between  $\ln (r_x /r_0 )$ and R on should be linear. So we draw the experimental data and their linear fitting results, as shown in Fig. 4(b). It is obvious that
 $\ln (r_x /r_0 )$ and R on follow the linear relationship. According to Eq. (3), the slope of the
 $\ln (r_x /r_0 )\sim R_{{\rm{on}}} $ curve can be expressed as
 $9h\nu /[(1 - {\rm{Re}})(G - R){\rm{\pi }}E_a q{\rm{\mu }}]$, and here we call this slope the photoconductive resistance (PR). In
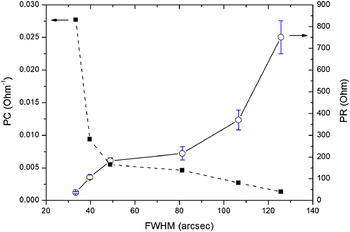
 $9h\nu /[(1 - {\rm{Re}})(G - R){\rm{\pi }}E_a q{\rm{\mu }}]$, the mobility μ, the carrier generation rate G and the carrier recombination rate R decide the photoconductivity. μ, G, and R are directly related with the quality of the SiC substrates. So the reciprocal of PR is corresponding to the photoconductive capacity (PC, with unit: Ohm−1) of the SiC substrates. To find out the relationship between the crystallinities and the photoconductive properties of the 6H–SiC, both the FWHMs (average of the 9 points) and the PR (the solid line) and PC values (the dash line) of these samples were shown in Fig. 5. With the FWHM of the rocking curves increasing from 33.4 to 125.7 arcsec, the PR increases quickly from 36.1 to 750.8 Ω. The curve of PC shows that, when the FWHM of rocking curve is less than about 50 arcsec the PC decreases dramatically with the increase of FWHM. While the FWHM of rocking curve is larger than 50 arcsec, the PC decreases gently. It is a clue to select SiC substrates for the photoconductive devices. The smaller the FWHM of the SiC substrate is, the better the photoconductive property will be. The SiC substrates with FWHM of rocking curve more than 50 arcsec will result in very poor devices property.
The relationship between the average FWHM of HRXRD rocking curves of the V-doped 6H–SiC substrates and the photoconductive capacity (PC) and photoconductive resistance (PR) values of PCSS fabricated on the substrates.

Sample 4 has the best substrate quality and the highest photoconductive capacity (PC) in this experiment. The 355 nm laser has an energy of 3.5 eV, which is near to the band gap of 6H–SiC (3.02 eV). For the ideal crystal, the G − R should be close to 1. Sample 4 has very good quality, but it is still far from the ideal crystal for SiC grown by PVT method. Hence, we use G − R = 0.9, together with the (G − R)·μ values by fitting, to calculate the mobility of the sample 4. The mobility of sample 4 is calculated to be 32.6 cm2/Vs. The mobility of semi insulating 6H–SiC at 300 K is around 30 cm2/Vs. So the mobility value by fitting in this experiment is reasonable. The mobility μ is especially sensitive to the structure defects in crystal. In sample 1 and sample 6, a mass of defects may decrease the mobility μ remarkably. We believe that increasing the carrier mobility μ is the most important factor to reduce the R on of the 6H–SiC PCSSs. It should be noted that this study has only examined the photoconductive properties of 6H–SiC under low field. The high field properties will be studied in our further work, where the effect of impact ionization and some other nonline carrier generation mechanisms would be considered.
IV. CONCLUSIONS
In this work, the effect of substrate crystallinities on the photoconductive properties of the 6H–SiC PCSSs was studied. The physical model of the PCSSs was put forward. The experimental data fitted well with the physical model. The experimental results suggested that the crystal quality obviously affected the on-state resistance of the 6H–SiC PCSSs. The smaller the FWHM of rocking curve is, the better the photoconductive property will be. Increasing the carrier mobility μ is one of the most important factors to reduce the on-state resistance of the 6H–SiC PCSSs. Some results in this work present reference for the selection of 6H–SiC substrates for the fabrication of PCSSs and some other photoelectric devices.
ACKNOWLEDGMENTS
This work is supported by the Innovation Programs of the Chinese Academy of Sciences (Grant No. KJCX2-EW-W10) and the Young Scientists Fund of the National Natural Science Foundation of China (Grant No. 51002176).