

Introduction
THE current success of populist radical-right parties has led to a wave of public attention as well as renewed academic interest in this development. The literature on the driving forces behind the vote for radical-right parties has long been dominated by noneconomic explanations based on anti-immigration attitudes and racial resentment. But widespread political dissatisfaction in the aftermath of the Great Recession, with its adverse impact on labor markets aggravated by additional economic pressure from international trade and automation, has put the spotlight back on the economic roots of right-wing populism.
In contrast to pioneering studies with a narrow focus on individuals’ immediate material circumstances, more recent work has recognized the need for a more nuanced understanding of economic anxiety. We advance this burgeoning literature by systematically integrating two important conceptual extensions into a comprehensive analysis of the structural economic roots of radical-right support. The first extension follows from the realization that common indicators of objective hardship leave us well short of understanding the main motivation behind political dissatisfaction and its manifestation in the electoral arena. Economic shocks resulting from job loss or substantial income drops are understood to have predictable but transient influence on political attitudes and even more limited effects on voting behavior in general Footnote 1 and populist support in particular. Footnote 2 Instead, somewhat richer conceptualizations of latent economic threat may be more promising to explain support for the radical right. Footnote 3 The second crucial extension builds on the intuition that an individualistic perspective on voters’ economic circumstances may be misleading. Building on long-standing insights of social psychology research, various recent studies in different subfields of the social sciences have adopted the understanding that perceptions and political preferences depend on the context conditions in which individuals form opinions and against which they juxtapose their own economic situation. Footnote 4
Our approach systematically integrates these theoretical and empirical insights into a comprehensive framework to examine the economic roots behind radical-right support. On the one hand, we take latent threats seriously by studying uncertainty about economic conditions rather than focusing on socioeconomic endowment, such as income, or materialized hardship, such as unemployment. More specifically, adding to recent studies that have begun to look into various forms of economic threat or social decline, we examine whether occupational unemployment risk is systematically related to supporting radical-right parties. On the other hand, we take context seriously by including individuals’ family and household situations, thereby integrating a key premise of the work/family role system Footnote 5 into the typically individualistic study of electoral behavior. Most voters do not live on their own but cohabit with a partner or a family. And since most contemporary households no longer fit the traditional image of a single (male) breadwinner responsible for a family’s standard of living, an individualistic perspective is in danger of missing important aspects of the societal consequences of economic risk and household mobility. Footnote 6 The household may be an important site of preference formation because individuals cognitively pool economic resources and hence, build their political preferences based on household risk rather than on personal risk alone. Footnote 7
To test our theoretical expectations, we calculate economic risks for disaggregated occupational groups on the basis of large-scale labor survey data (European Union Statistics on Income and Living Conditions or eu-silc) in eleven West European countries. Footnote 8 We combine this indicator of labor market vulnerability with the European Social Survey (ess). In contrast to most other comparative social science surveys, the ess provides detailed information not only on respondents’ own occupational situation, but also on the occupational situation of other household members. This allows us to merge the indicators of unemployment risk on respondents as well their spouses, which yields the crucial information on within-household constellations of economic vulnerability.
Our analysis provides strong evidence for the relevance of the household-insecurity framework. We first provide consistent evidence for a positive link between individual economic risk and vote choice. Occupational unemployment risk is systematically related to supporting radical-right parties (while current unemployment status is not). This link is then put into perspective by taking into account different household constellations. We find significant household effects that substantially improve our understanding of the link between economic conditions and party choice. We provide evidence that support for the radical right is a function not only of individual economic risk, but also of household risk more generally: voters incorporate their partner’s economic conditions in their vote calculus and adjust their own political behavior accordingly. Importantly, our findings indicate that voters do not pool economic risks in a way that a low-risk spouse can compensate for a high-risk partner. Instead, we find that one high-risk individual per household is sufficient to significantly increase the probability of supporting the radical right among all household members. Finally, we also assess gender-asymmetric effects and find—in line with previous sociological work on household income dynamics Footnote 9 —that individual risk plays a more important role for men than women.
Our findings have far-reaching implications. They provide a comprehensive analysis of economic risk as a determinant of electoral behavior. We show that—adequately conceptualized—economic circumstances need to be taken seriously for understanding patterns of radical-right support. Footnote 10 Importantly, political parties may channel such anxieties in a programmatic direction that resonates with their electorate, as radicalright parties have done in successfully mobilizing a sense of collective status threat among national ethnic majority groups. Footnote 11 The key implication is that fundamentally economic shocks may result in noneconomic (or not purely economic) political manifestations. Footnote 12 In addition, our findings demonstrate that household composition, often ignored in research on electoral behavior, plays a substantial role in individual preference formation. Crucially, ignoring material and non-material spillover effects within households may result in considerable underestimation of the role that economic risk plays in voting for the radical right and for political behavior more generally.
Socioeconomic Conditions and the Radical Right
The Role of Latent Economic Threat
Traditional approaches to explaining right-wing populism based on economic grounds exist in two flavors. The first is concerned with increasingly insecure labor market prospects in times of globalization and focuses on economic nationalism as an appealing offer for those who feel threatened by cheap foreign labor. Footnote 13 The second channel through which economic concerns could translate into support is the welfare state. Rather than competition on labor markets, voters might fear distributional conflicts between natives and immigrants when it comes to public spending. Footnote 14 But many studies that rely on these traditional economic approaches and investigate the political implications of economic hardship in absolute terms do not find a relationship between unemployment, for example, and radical-right voting. Footnote 15
In contrast, our focus is on economic risk—uncertainty related to a latent threat of adverse economic shocks in the future rather than on currently materialized economic conditions. Risk-based approaches have attracted a lot of interest, especially in the welfare literature, and have proved their explanatory power with respect to social policy preferences. Footnote 16 They have much more rarely been used to explain political behavior. The scarcity of evidence results in an ongoing scholarly debate about the role of labor market risk in shaping vote choice in general and support for radical-right parties in particular. The few existing studies that argue for a link between labor market risk and radical-right voting Footnote 17 were challenged in a recent symposium on the political repercussions of labor market inequality. Footnote 18 Essentially, “labor market outsiders,” who are particularly prevalent in the service sector, should not be mistaken for the working-class supporters of right-wing populist parties typically found in routine and manufacturing occupations. Footnote 19
Against the backdrop of this unresolved debate, we first discuss the theoretical channels that may connect economic risk to voters’ propensity to support the radical right. The traditional insurance logic in the political economy literature suggests that voters react similarly to risk exposure and to the experience of absolute economic hardship. As insurance against potential future job or income loss, voters demand policies that guarantee social protection. Such demands could either result in support for left parties that are the most credible providers of a generous welfare state or in support for radical-right parties that promise authoritarian solutions to reduce competition by immigrants regarding both labor markets and welfare states. Footnote 20
A recent strand in the literature has brought up another explanation that suggests a somewhat different mechanism. Various studies have examined the role of nostalgia, Footnote 21 societal pessimism, Footnote 22 recognition gaps, Footnote 23 or status threat and fear of societal regression Footnote 24 as important drivers behind radical-right voting. These contributions share the understanding that populist radical-right parties thrive on a program that emphasizes an idealized past rather than attracting voters with concrete policy remedies against perceived disadvantages. Economic risk would thus lead to support for the radical right as a form of protest against the vagaries of economic modernization and mainstream parties’ continued support for the politics of liberal and globally integrated advanced capitalist societies.
The Role of Context: Household Constellation
We argue that the inclusion of the household is necessary to arrive at a more encompassing understanding of the relationship between economic risk and support for the radical right. Although the overwhelming majority of social science research studies political attitudes as those of atomistic individuals, there is strong reason to expect that voters do not form preferences in isolation but rather depend on a multitude of context conditions and reference points. Footnote 25 In particular, people who share a household budget and interact frequently will influence each other’s political preferences. Footnote 26 Additionally, structural economic pressure is not only experienced directly, but also often in mediated form, which manifests itself as concern for one’s social group and results in grievances that are at least as much sociotropic as they are individual. Footnote 27 Of all social units, such influence is most likely to characterize households and, especially, partner relationships because of their simple structure and their economic interdependence. Footnote 28
Beyond the widespread expectation that people within social units tend to align political preferences over time, existing sociological work on household and couple effects primarily assesses the mutual impact of income, education, and class position on household members’ political behavior. Footnote 29 We propose that labor market risks follow a comparable spillover logic within the household. Hence, our first expectation is that individual vote choice not only depends on voters’ own vulnerability, but also reacts sensitively to labor market risks affecting other members within their intimate social network.
Going beyond this baseline expectation of mutually interdependent preference formation, we contend that exactly how individual risks interact within households is less obvious. Scrutinizing the different ways in which partners affect voting patterns is important because the precise channel of influence may provide valuable insights about underlying mechanisms. We derive observable implications of competing theoretical expectations about how individuals adjust (or do not adjust) party preferences given their own and their partner’s economic risk.
Traditional bargaining models of the family focus on the distribution of economic resources and the division of labor between spouses.Footnote 30 Even though we are concerned with a different core concept, namely labor market vulnerability, this literature is insightful for our purpose because one may think of risk exposure as uncertainty about future income.Footnote 31 In such a relatively narrow economic interpretation of unemployment risk, traditional resource pooling, as proposed in Gary Becker’s seminal framework, appears as a rational household strategy.Footnote 32 Both spouses’ levels of risk have similar weight and reinforce each other’s political preferences, resulting in what may be seen as averaging of attitudes within households. The economic safety of one spouse can help to remedy the risk of the other.
Conversely, we can also think of a situation in which one spouse’s economic circumstances dominate the joint household preference formation. Rather than averaging out heterogeneous risk exposure, a dominance framework suggests that household members align preferences around a particular influential actor within the social network. For example, Robert Erikson highlights the difficulty of ascribing a single class position to modern dual-earner families and proposes to derive the family’s class position from the family member who carries the economic responsibility of the household, irrespective of gender.Footnote 33 We can think of a similar logic of dominance regarding the link between economic risk and radical-right voting, although most likely with a reversed logic: given that we do not study the distribution of economic gains but a situation of potential income loss, we have good reasons to expect that, if anything, a high-risk spouse will dominate the household’s preference formation. Experimental research in social psychology and behavioral economics provides abundant evidence that losses and disadvantages have greater impact on preferences than gains and advantages.Footnote 34 Hence, instead of pooling economic risks, household preferences may converge based on the predominant risk situation. In this scenario, spouses primarily respond to their worse-off partner so that their own (lower) risk becomes relatively less important. The vulnerable position of one household member could thus be sufficient to shape household voting behavior independent of the risk of the other.
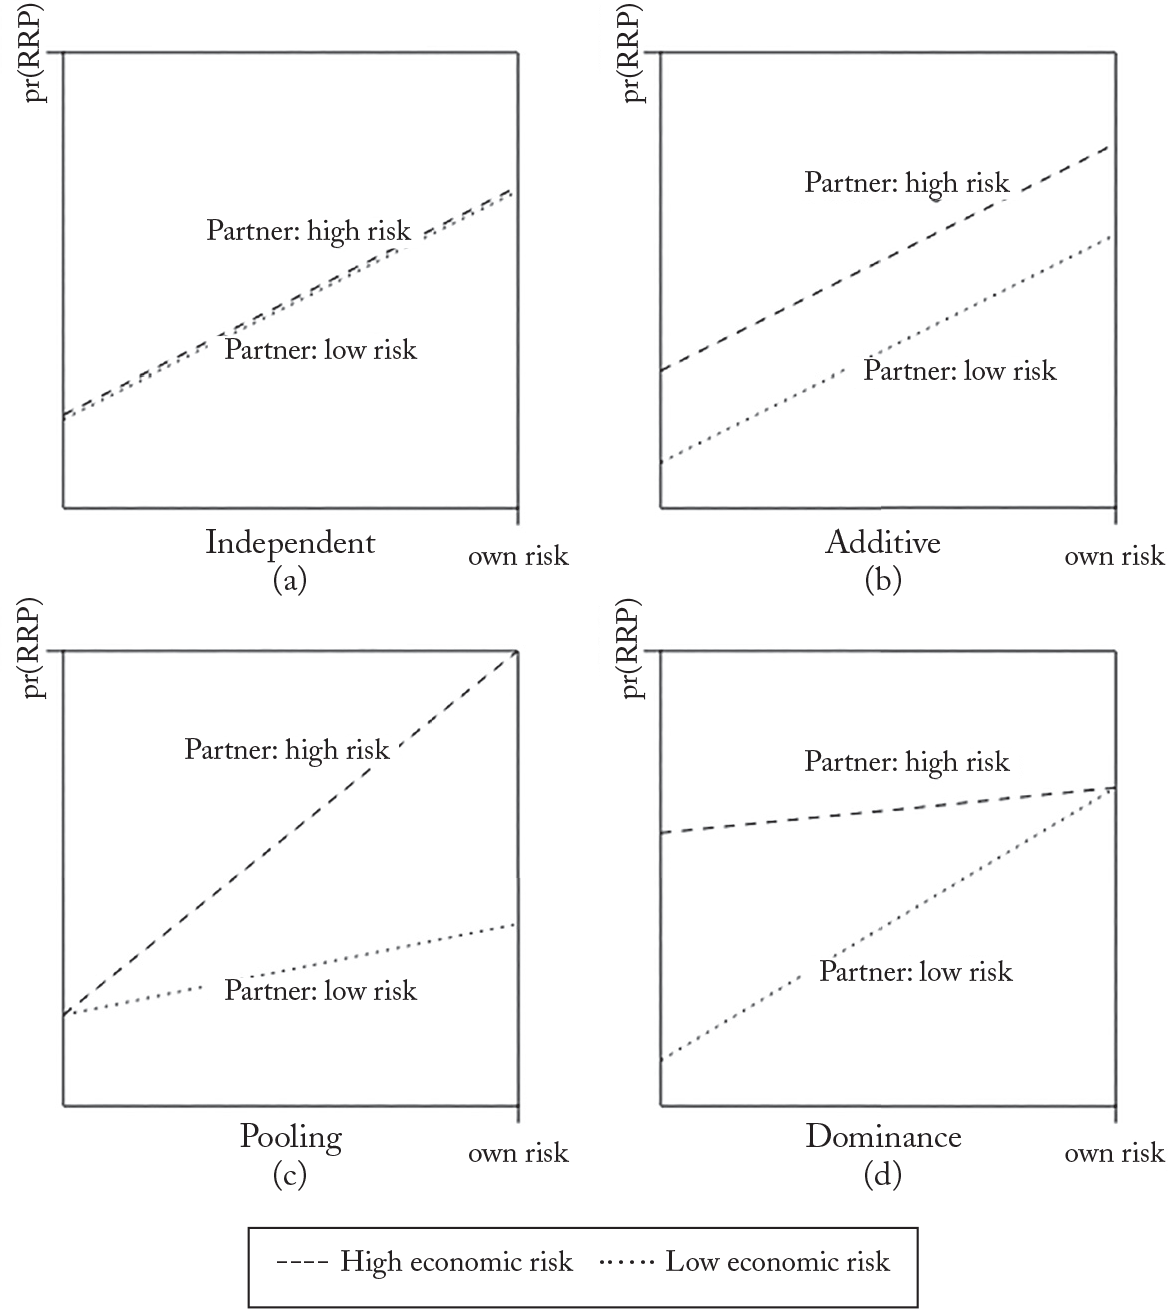
We provide stylized visualizations of these expectations in Figure 1. The main explanatory variable is an individual’s economic risk (x-axis) and the dependent variable is the probability of this individual supporting a populist radical-right party (y-axis). In line with the arguments discussed above, we expect a positive relationship between these two variables. We are interested in how household effects, or more precisely, how the economic situation of the individual’s partner affects the respondent’s own party choice. Thus, each panel in Figure 1 displays the relationship between risk and support for a radical-right party for a situation in which the individual has a partner with low economic risk and for a situation in which the individual’s partner suffers from high economic risk.
Stylized Effects of Household Risk Composition

To make the model as complete as possible, we also illustrate two different kinds of null hypotheses, that is, expected patterns in the absence of preference alignment within households in which a partner’srisk either has no effect on an individual’s voting propensity or is simply added to the individual’s own risk perception (panel [a] and [b]). Panels (c) and (d) illustrate conditional effects of economic risks within households that indicate one of the two discussed scenarios. Panel (c) shows how the partner’s lower risk can reduce the effect of an individual’s own risk on voting for the radical right. When partners can provide a safety net, demand for the radical right decreases. Panel (d) shows a scenario in which one high-risk person in a household is sufficient to increase the probability of radical-right voting.
A priori, we consider these expectations similarly plausible, which is why we treat the pattern of the interaction of economic risks within households as an empirical question. Beyond their explicit effects, these empirical patterns likely suggest different underlying mechanisms connecting unemployment risk and radical-right support. Risk pooling follows a strongly economic logic in which the combined (or averaged) level of vulnerability determines household members’ vote choice. Such an averaging of risk suggests that household members rationally calculate their joint need for insurance against potential future job loss and accordingly adjust their demand for policy remedies to help achieve this goal. Indeed, previous work has provided evidence for household risk pooling when it comes to social policy preferences. Footnote 35 A less vulnerable partner serves as a kind of private safety net and reduces the demand for social protection for both spouses. Although left parties are commonly considered the most credible supplier of such polices, radical-right parties have offered economic nationalism, immigration control, and welfare chauvinism as their alternative response to perceived labor market vulnerability.
In contrast, the empirical pattern related to a dominance scenario suggests a less strictly policy-based explanation. The overly dominant impact of one vulnerable actor within an otherwise relatively well-off household does not square well with a calculated demand for concrete policy remedy. Rather, this pattern seems to pick up a more general sense of disillusionment, Footnote 36 and perhaps anger, Footnote 37 at the workings of the current system and the political actors behind it. In this scenario, support for radical-right parties does not follow a clear bread-and-butter logic, but entails stronger elements of protesting against a political system that is not perceived as responsive toward latent threats of economic vulnerability. By implication, although a fundamentally economic challenge (unemployment risk) fuels radical-right support, its ultimate appearance in the political arena (dissatisfaction with the political status quo) might not manifest itself in purely economic terms.
In addition, any discussion of household effects on political preferences would remain incomplete without addressing potentially asymmetric effects between men and women. Even though the economic position and “outside options” of women have improved over time, Footnote 38 and female students now largely outperform male students at all levels of school, Footnote 39 structural differences in labor market opportunities of men and women remain. In line with most existing research that takes into account potentially asymmetric household effects, Footnote 40 preference alignment within the household is likely to be more pronounced among women than among men. By implication, we would expect that male respondents’ own risk is relatively more important in determining voting for the radical right compared to female voters, resulting in a stronger correlation between risk and radical-right support in the context of a low-risk partner (see Figure 1). Footnote 41
Empirical Approach
To test our argument, we need an empirical measure of individual economic risk exposure. We focus on the risk of job loss, which is certainly one of the most consequential threats in terms of both its material and psychological implications. Footnote 42 Following Philipp Rehm’s influential work, Footnote 43 we propose that an individual’s probability of losing his or her job is a reasonable objective proxy for risk exposure. The probability of job loss is approximated by objective occupational unemployment rates, that is, the share of unemployed workers in a respondent’s occupational environment. Measuring risk exposure at the group level makes sense since risk—the probability of a bad event—cannot meaningfully be derived without a reference group. Footnote 44 An objectively calculated measure of risk is desirable because it is arguably exogenous to political attitudes and electoral preferences. That said, we would certainly want our objective measure of risk to predict subjective assessments of risk perceptions reasonably well. Previous research has indeed empirically demonstrated this correlation. Footnote 45
As a first step, we rely on large-scale labor market data provided by the eu-silc to obtain reliable estimates of the group-specific prevalence of job loss. To do so, we calculate unemployment rates within occupational groups as defined by the International Labor Organization, that is, according to the International Standard Classification of Occupations (isco). Closely following Rehm’s work on occupational unemployment and redistribution preferences, Footnote 46 the main models rely on the prevalence of unemployment within major occupational groups (isco one digit). In the robustness section below, we show that our results also hold when we calculate unemployment risk based on a more fine-grained disaggregation of occupations into sub-major groups (isco two digit).
In a second step, we combine this objective group-specific indicator of risk exposure with individual-level survey data from the ess. The ess contains the necessary dependent variables on political behavior as well as detailed information on occupation and other sociodemographics. Most important, it also contains the same information for other household members. This exceptionally rich data set thus allows us to create occupational groups identical to those in the eu-silc for ess respondents as well as their partners, which makes merging the two data sources a straightforward task.
Our final sample consists of respondents who are (1) in a relationship, (2) have an occupational code assigned, and (3) have a partner who also has an occupational code. It is important to emphasize that the universe of cases we examine in our analysis reaches far beyond doubleincome households with two partners in the active labor market. The ess asks respondents about their current or previous occupation (“What is/was the name or title of your main job?”). The attribution of structural unemployment risks is therefore not contingent on current employment status (“main activity during the last 7 days,” see Table A2 in the supplementary material).Footnote 47 Even if respondents or, similarly important, their partners have not been occupied with paid work most recently, their economic vulnerability can be estimated based on their last job. Our sample thus includes household members who are at the moment not doing paid work (for example, students or homemakers) but who have at their disposal a set of occupational skills from a previous employment spell. Since most workers remain in a similar job environment, experience in previous occupations provide a natural approximation of their economic vulnerability once they decide to reenter the labor market. We limit our sample to the working-age population (between 18 and 65 years old), and our analyses are necessarily limited to people in households. We restrict any inference from our analysis to this population.
The main dependent variable—support of radical-right parties—is based on country-specific ess items asking respondents about the party they voted for in the last general election. We group support into party families and classify populist radical-right parties on Cas Mudde’s conceptual foundation (see Table A4 in the supplementary materials for details).Footnote 48 Our main dependent variable is a dummy capturing voting for populist radical-right parties (one) versus all other parties in the zero category. All our findings hold if we use a variable for radical right (one) versus the mainstream left and mainstream right parties in a country that make the zero category more homogenous. We show our main findings for this in the supplementary material.Footnote 49 Note that to ensure a close connection between risk exposure and electoral behavior, we match the labor market risk information based on the year the election took place rather than on the year the ess round was released.
We analyze our data set with country and wave fixed effect logit regression models and standard errors clustered by country wave to correct for nonindependent observations.Footnote 50 All our findings are robust against excluding any single country from the analysis. We control for age, education, gender, children, and income. We also include controls for unemployment status and partner’s unemployment. A table with summary statistics can be found in the supplementary material. We refrain from including more specific attitudinal variables because they are clearly posttreatment to our structural variables and would bring with them the risk of posttreatment bias. Our approach employing country fixed effects leads to an exclusion of all countries that do not have a radical-right party successful enough to meaningfully show up in survey responses. The problem of potentially inducing selection bias has been widely discussed in the literature on radical-right voting. Therefore, we additionally show that our findings do not change if we use a linear probability model that does not exclude these cases. We also show our main findings for a multilevel model with random effects at the countrywave level.
Descriptives
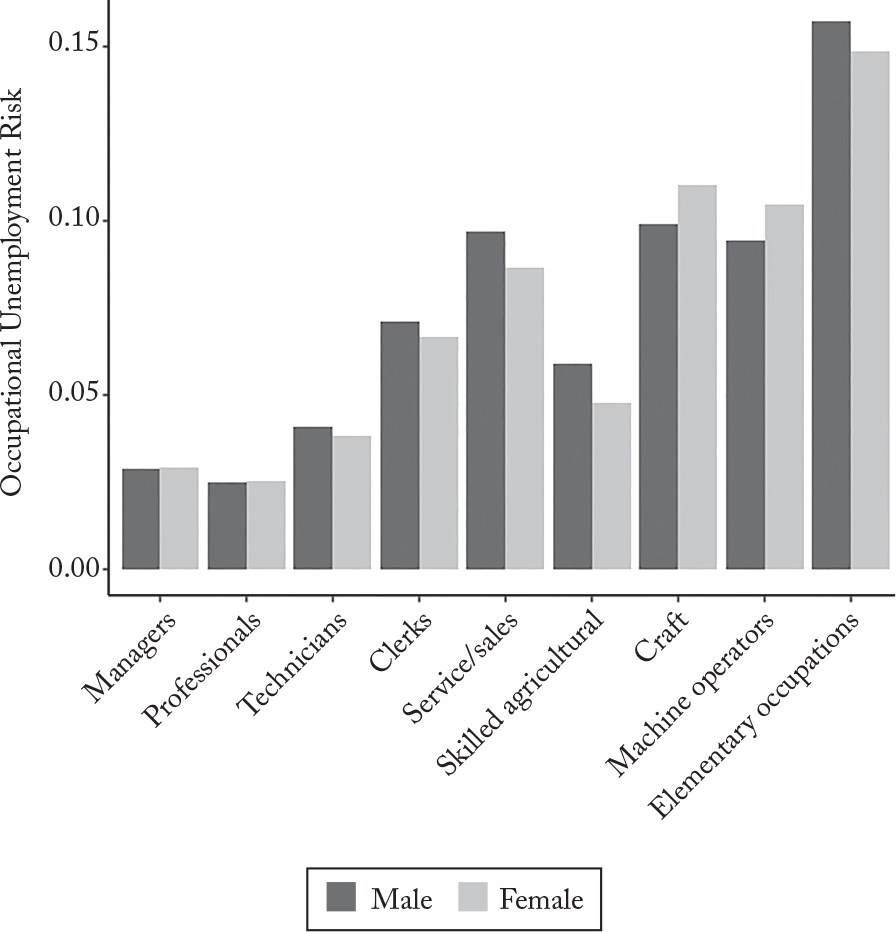
Figure 2 provides an overview of average risk exposure by occupational group and gender, pooled over time and space. Recall that risk exposure is proxied with an individual’s occupational unemployment risk, which is calculated as a group-specific analogue of the national unemployment rate. There is considerable variation between the nine major occupational groups. Workers in low-skilled elementary occupations, such as cleaning, construction, and food preparation, suffer from the highest risk levels (15.2 percent on average within a large cross-sectional bandwidth). Craft and related trade workers, plant and machine operators/assemblers, and workers in services and sales are exposed to medium levels of risk (around 10 percent), followed by clerical workers with slightly lower risk exposure (6.8 percent on average). More highskilled managerial, professional, and technical jobs are characterized by a lower prevalence of unemployment. Unemployment in the classical sense is also less frequent in the agricultural sector. One important observation (confirmed below) is that unemployment risk is less strongly gendered than one might expect and is certainly less gendered than broader concepts of labor market vulnerability, such as “outsiderness,” that also include (involuntary) part-time employment.Footnote 51 Although female workers face higher unemployment risks than their male counterparts in craft and manufacturing occupations in which they represent a clear numerical minority, this is not the case in other occupations. To the contrary, male workers face higher risks in clerical, sales, and elementary occupations. However, due to compositional effects, that is, a higher proportion of female workers in high-risk occupations (for example, 60 percent female in elementary occupations versus 32 percent female in managerial jobs), the average risk of female respondents is slightly higher than that of male respondents in our sample.
Unemployment Risk by Occupational Group and Gender

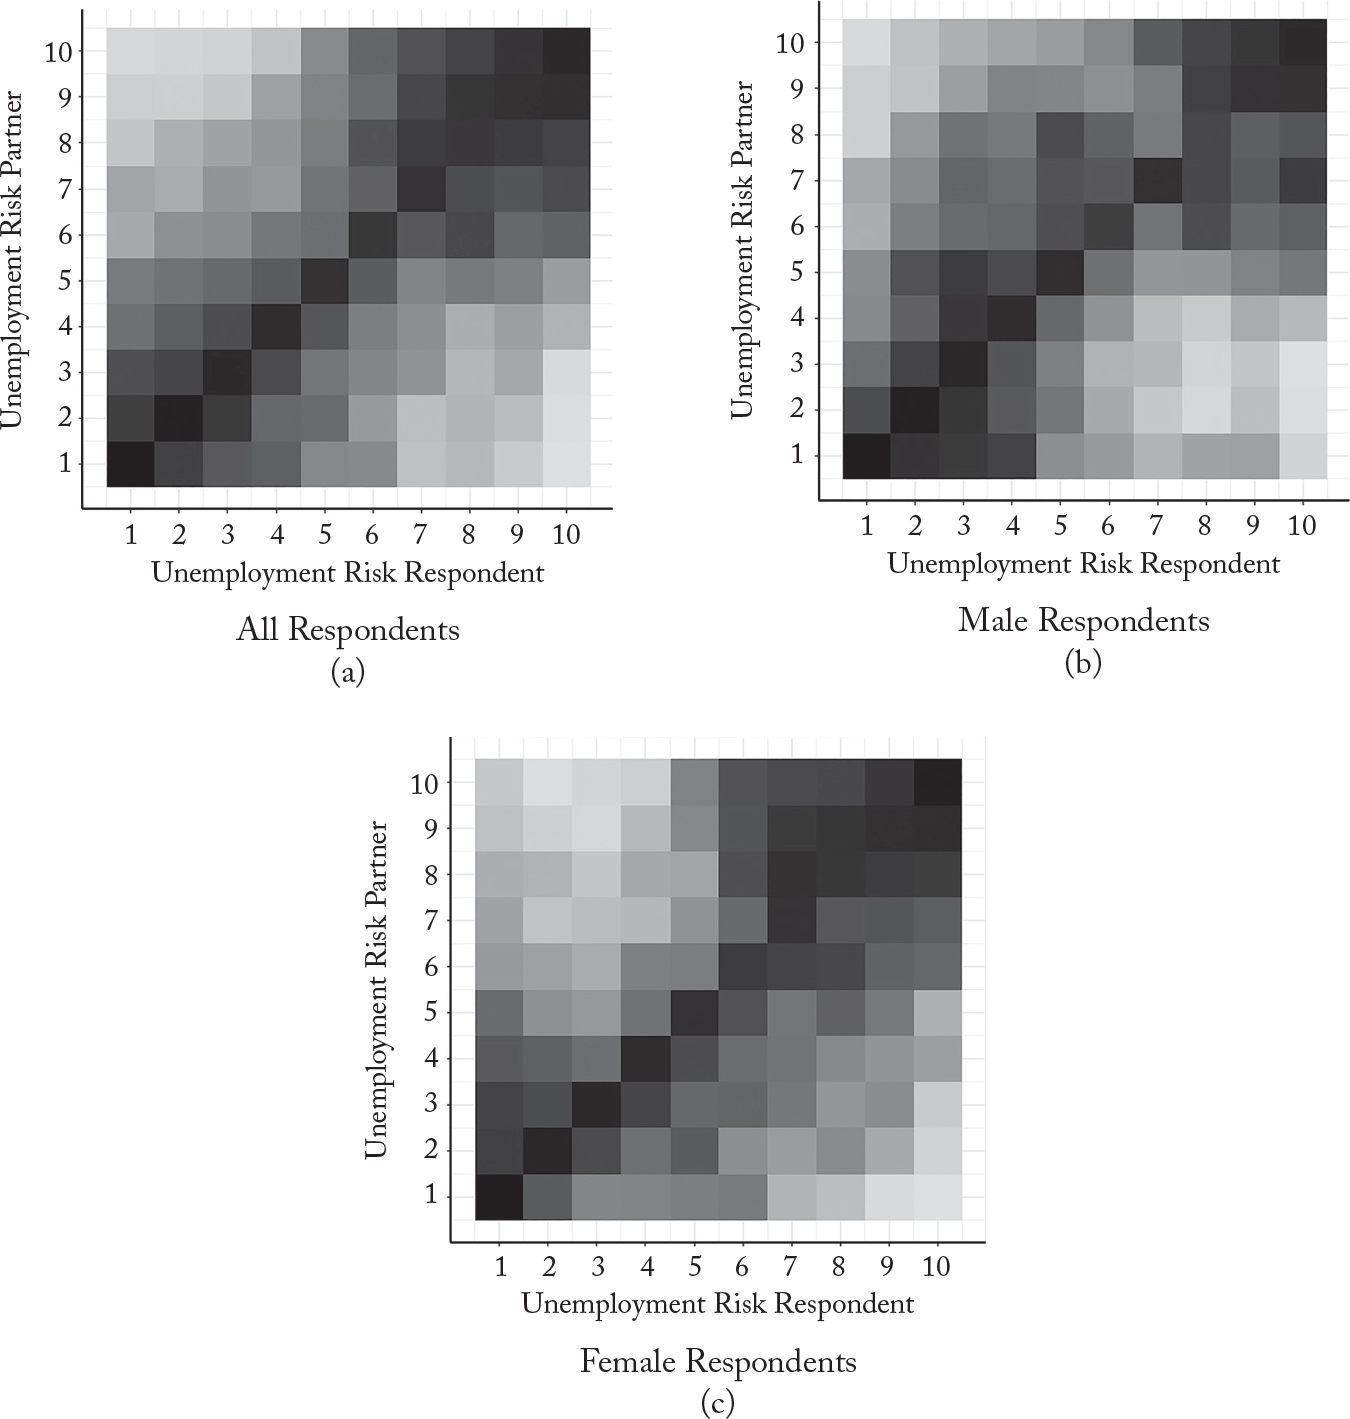
Our data on spouse’s occupation allows us to go one step further and examine within-household constellations of unemployment risk. To facilitate a concise illustration, we have aggregated individual risk exposure into country-specific deciles and then calculated risk-decile combinations for individual households (see Figure 3). The heat map’s density is highest around the diagonal, where respondent and partner risk are similar, but the plots also demonstrate that there is enough variation of risk distribution within households to examine the political implications of heterogeneous patterns of risk exposure. More specifically, we can look at the nine cells (3 × 3) in the upper left and lower right corners of Figure 3. The share of our respondents that are located within these corners is 12.1 percent across the full sample, ranging from 9.6 percent in Germany to 15.7 percent in Switzerland and the Netherlands (see Table A3 in the supplementary material). We consider this a sizable share of our sample that justifies closer scrutiny of not only household effects within homogamous relationships, but also of those with more unequal risk distribution.
Figure 3 (b) and (c) display the patterns for male and female respondents separately and demonstrate that a somewhat gendered pattern lies below the apparent symmetry of the overall sample. As one would expect, male respondents are on average in a slightly more secure position than their female partners, illustrated by darker shading above the diagonal (and vice versa for female respondents). Note that in line with the evidence discussed above, the distribution of unemployment risk is not extremely unbalanced between male and female respondents.
Household Risk Constellationsa
aDistribution of unemployment risks within households in deciles. Darker colors represent higher density.

Results
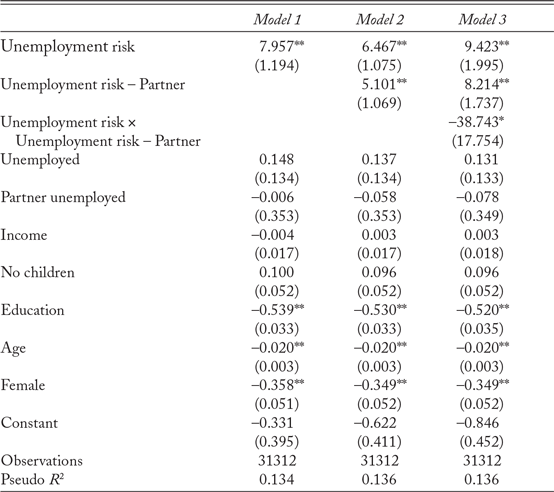
Table 1 shows our findings for the direct effect of unemployment risk on voting for the radical right. For comparable samples, all models are limited to people who cohabit with a partner. Model 1 includes the effects of individuals’ own risk; model 2 adds partner’s risk to the model. The first model provides some interesting information. First, unemployment risk is a strong and significantly positive predictor of support for radical-right parties. Second, we do not find any significant effect for individual unemployment status or partner’s unemployment status. This confirms the general idea within the growing literature on economic effects on radical-right voting that it is not material hardship per se but latent economic threat that constitutes a driver behind voting for the radical right.
Unemployment Risk and Radicial-Right Voting

*p < 0.05, **p < 0.01; clustered standard errors in parentheses; country and year fixed effects included
Model 2 adds unemployment risk of the partner, which has an independent effect of comparable magnitude to the respondent’s own economic risk and is also statistically significant. This first set of results thus provides strong evidence for our presumption that the household is an important site of preference formation that affects the political preferences of household members net of their own socioeconomic conditions.
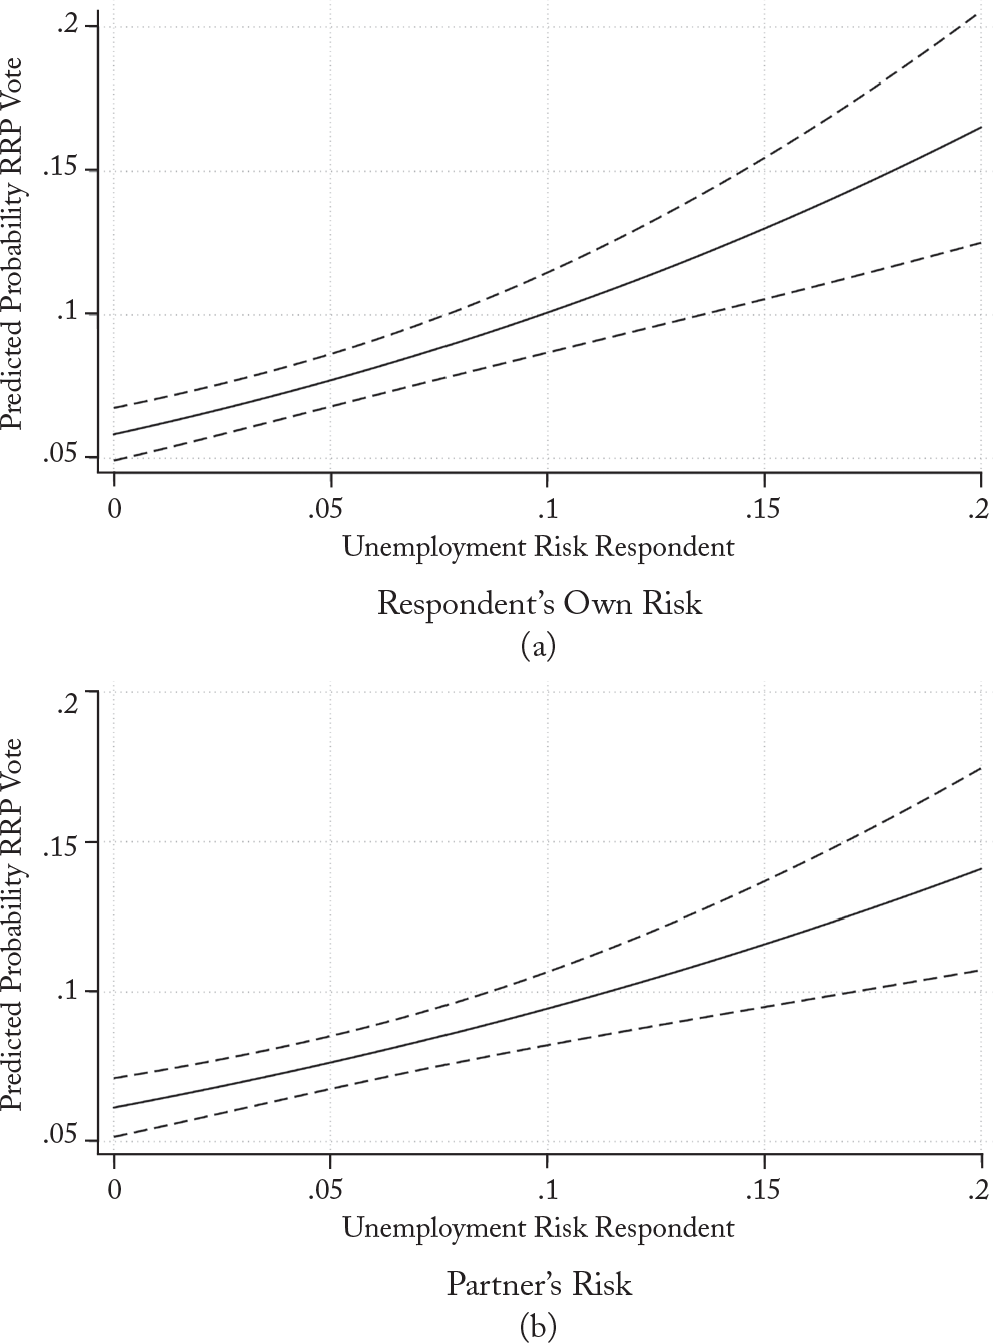
What about the magnitude of these effects? Figure 4 shows the predicted probabilities of voting for a radical-right party conditional on the individual’s and the partner’s risk based on model 2. (All other variables are held at their observed values.) We see substantively meaningful effects for both variables. Although individuals with a low risk of unemployment have a predicted probability of about six percent for voting for the radical right, for higher levels of risk this increases to over 17 percent. Considering the baseline probability of voting for a radical-right party, it is a substantial increase. Similarly, for partners’ unemployment risk, we find an increase from six percent to about 15 percent. Figure 4 demonstrates that unemployment risk significantly affects the probability of voting for the radical right. It’s important to emphasize that this is the effect of a partner’s unemployment risk controlling for the respondent’s own risk. Contagion effects exist within the household and the economic risks of other household members do indeed influence respondents’ voting behavior.
Direct Effect of Unemployment Riska
aPredicted probabilities of voting for the radical right conditional on unemployment risk and partner’s unemployment risk. Dashed lines represent 95 percent confidence intervals.

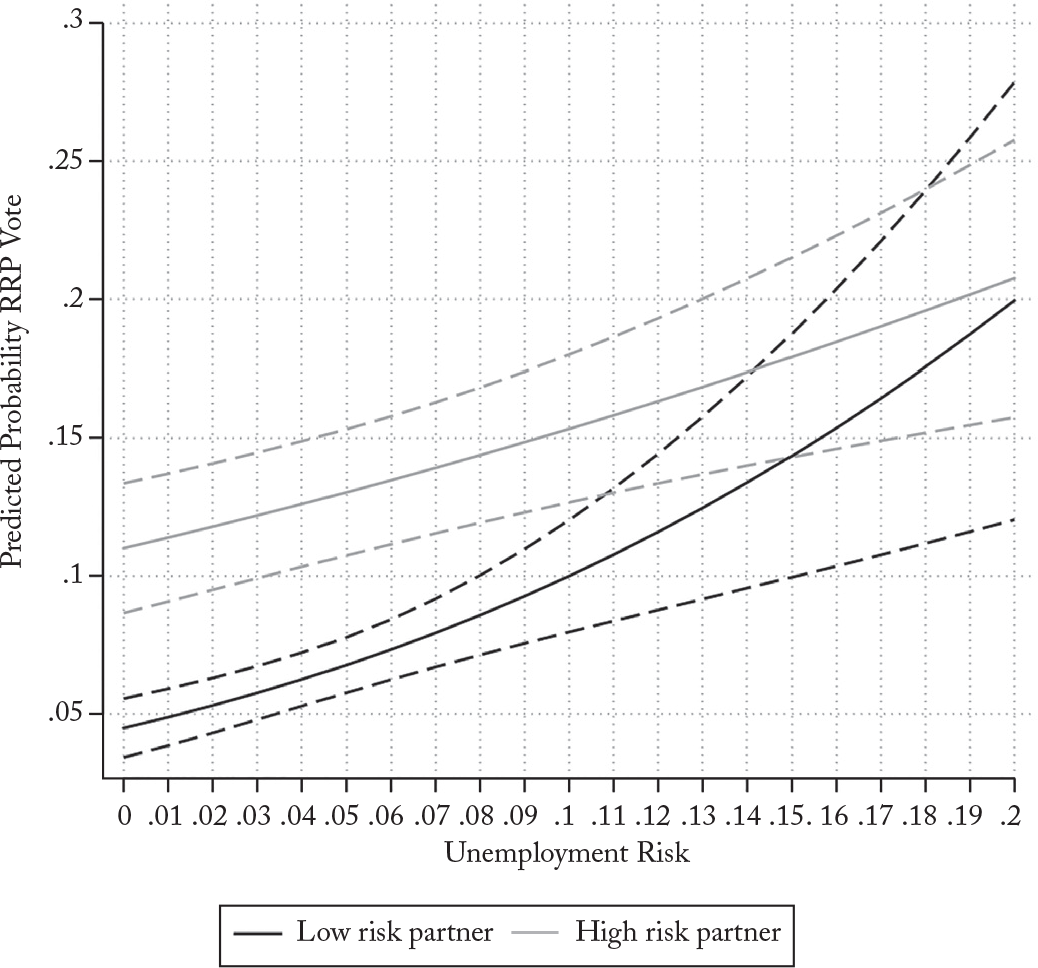
Model 3 interacts respondent and partner risk to scrutinize exactly how economic vulnerabilities within households interdependently affect voting for the radical right. Because we are dealing with a nonlinear logit model, we cannot directly interpret the coefficient of the interaction term. Footnote 52 Therefore, we illustrate the interaction effects in the form of conditional predicted probabilities. Figure 5 shows how the effect of an individual’s unemployment risk is conditional on the partner’s risk. We display the predicted probability of voting for the radical right for increasing values of unemployment risk conditional on low (first decile) and high (ninth decile) risk of their partners.
Predicted Probabilities: Own Risk and Partner Riska
aPredicted probabilities of voting for the radical right conditional on unemployment risk and partner’s unemployment risk. Dashed lines represent 95 percent confidence intervals.

The simulations provide a clear picture of how the distribution of unemployment risk within households affects radical-right voting. First, the figure demonstrates that respondents’ own risk and their partners’ risks interact. Second, we see that the probability of voting for the radical right strongly increases with higher levels of risk for individuals whose partners have a very low risk of unemployment. This
speaks against a logic in which partners provide a household safety net that mitigates or averages out the effect of risk on radical-right support through resource pooling. If partners’ low risk could compensate for individuals’ own risk, we should see a nearly flat line when partner risk is low. This is clearly not the case. Similarly, Figure 5 shows a clear effect of a partner’s unemployment risk even when individuals have a low risk themselves; at an individual’s unemployment risk of nearly zero, the individual’s probability of voting for the radical right is more than twice as high when the partner has high rather than low risk of unemployment.
Third, we see that a partner’s unemployment risk has a higher effect on voting for the radical right when a person’s own unemployment risk is low than when it is high. Again, from a logic of risk pooling we should expect the opposite effect: if a respondent’s unemployment risk is low, the partner’s risk should matter less. These findings do not only underline the importance of economic risk and its distribution within households for explaining the success of the radical right, they also point to a potential factor for why studies of individual economic determinants of radical-right voting have only found unstable and often weak effects. If one individual at risk of losing his or her job is enough to substantially increase the household’s probability to vote for the radical right, then looking only at individuals and not taking their context situation into account could significantly underestimate the overall effect of economic risk on radical-right support.
With respect to the different channels linking risk and radical-right support discussed above, the empirical pattern lends support to the dominance mechanism, that is, the idea that voters’ preferences within households converge toward the highest level of risk exposure. Partners do not seem to be pooling risks in a way that the low risk of one partner can work as a remedy to the risk of the other. Instead, a high risk of one person in the household is enough to substantially increase radicalright voting. In contrast to social policy preferences, Footnote 53 support for radical-right parties does not follow a simple bread-and-butter logic. The absence of obvious policy demand in response to household risk may suggest that affected voters are more strongly motivated by a desire to protest against the latent threat of economic vulnerability.
Gender-Specific Household Effects
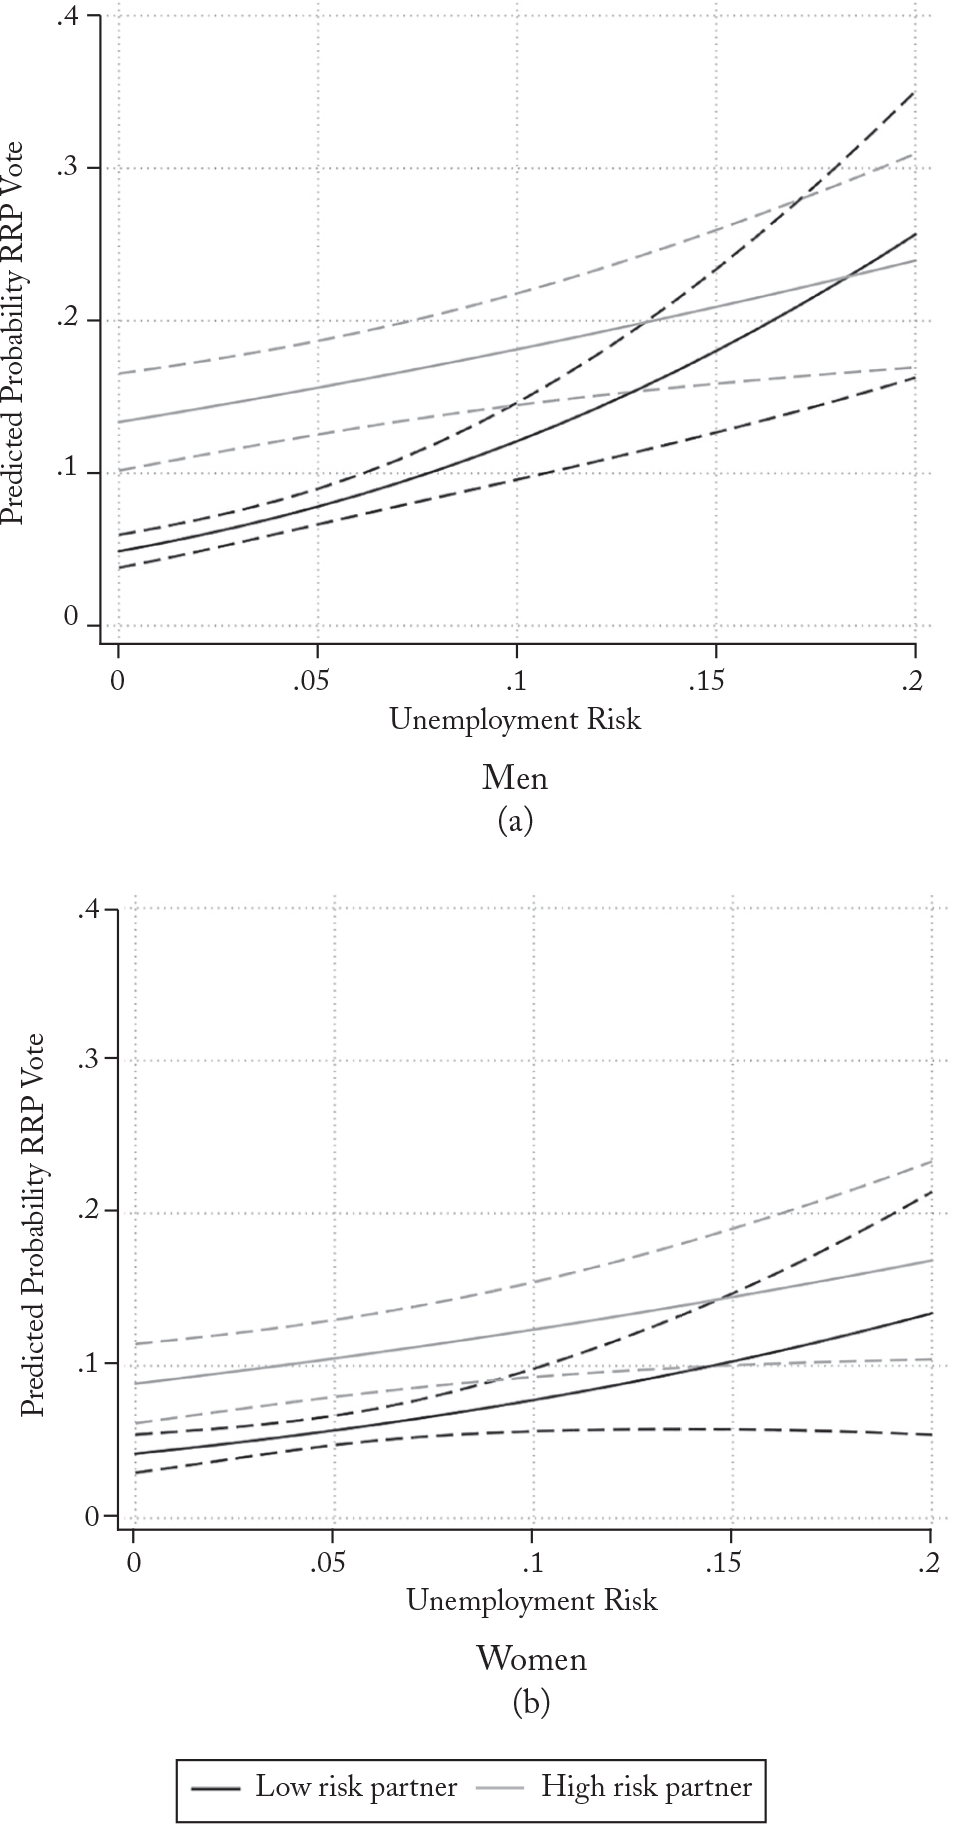
We next investigate the possibility that unemployment risk within the household affects men and women differently. We thus estimate our models for a split sample of men and women. For these analyses, we exclude same-sex couples. We show these results in Figure 6; the regression table can be found in the supplementary material
Effect of Unemployment Risk by Gendera
aPredicted probabilities of voting for the radical right conditional on unemployment risk and partner’s unemployment risk. Dashed lines represent 95 percent confidence intervals.

Figure 6 shows the effect of unemployment risk on voting for the radical right for men and women. We see that men and women show the same general pattern of dominance. In both cases, for individuals with a low unemployment risk, the partner’s unemployment risk increases the probability of voting for the radical right. The figure also demonstrates some pronounced differences between men and women, most clearly visible for individuals whose partners have a low risk of unemployment. For men, we see a strong increase in the likelihood of voting for a radical-right party with increasing level of risk. This increase is only moderate for women. Nevertheless, we do not see a safety-net effect. Overall, individual risk seems to have a stronger effect for men than for women. In addition, although at lower levels of unemployment risk we do not see a difference between men and women in the likelihood of voting for the radical right, the difference becomes apparent and more pronounced as unemployment risk increases.
In sum, our findings show that especially for individuals with low unemployment risk, if household situation is not taken into account, then there’s potential to misinterpret their political leanings. Our findings indicate that for constellations in which both partners have a similar level of unemployment risk, predictions based on one of them should be pretty accurate. But for constellations in which there is a bigger
difference (the off-diagonal in Figure 3), partner risk should have a strong, potentially unobserved effect with low-risk individuals. The specific magnitude of this effect will vary by country and will depend on the number of households that include partners with strongly differing risks.
We illustrate the magnitude of this effect with an example based on the calculations above. Based on the distribution of partner’s unemployment risk for men with very low own unemployment risk (0.001), we can estimate the prevalence of a dominance effect. For the third quartile of a partner’s unemployment risk, we see an increase from 5 percent to 7.5 percent in the predicted probability of voting for a radical-right party. This means that for 25 percent of the cases for men with low unemployment risk, their predicted probability of voting for the radical right is 50 percent higher than when estimated based on only their own unemployment risk. As can be seen in Figure 6, this difference becomes smaller as an individual’s own unemployment risk increases. Overall, this means that neglecting partner risk can lead to substantial bias among a rather small, but non-negligible share of the population—those households in which someone with low risk cohabits with a high-risk partner (see Table A3 in the supplementary material for country-specific shares).
Robustness
We run additional analyses to demonstrate the robustness of our findings to alternative specifications and measures and to address issues of causality. Table A6 of the supplementary material summarizes the findings. First, we replicate our main analysis using a measure of unemployment risk based on two-digit isco codes. We thus use more fine-grained occupational class groups to estimate an individual’s risk of becoming unemployed. We again find that an individual’s unemployment risk as well his or her partner’s unemployment risk has a significant positive effect on voting for a radical-right party. We also establish the same pattern of interaction between an individual’s risk and his or her partner’s risk in determining the propensity to support the radical right.
Our original models do not include attitudinal variables because they may introduce posttreatment bias. In supplementary material Table A6, models 3 and 4, we show that our main findings remain unaffected by the inclusion of variables controlling for attitudes generally associated with voting behavior in a postindustrial political space (left-right selfplacement, redistribution, and immigration). Interestingly, including these variables does not reduce the effect size of individual’s unemployment risk and partner’s risk. While including them does not constitute a comprehensive mediation analysis, which is beyond the scope of this article, it is another indication in line with our tentative interpretation of pooling versus the dominance channel, that the effect of unemployment risk may not run through policy attitudes. If individuals instrumentally use their vote for the radical right as a potential policy remedy against their economic risk, we should see that reflected in a mechanism that goes through their policy attitudes.
In our observational set up, we cannot fully rule out that people select into couples based on similar socioeconomic context conditions, which would result in potential problems based on selection and endogeneity. To strengthen our claim for a causal direction, we additionally run our analysis including class fixed effects for respondents and partners. We construct these occupational class groups following Daniel Oesch. Footnote 54 His class scheme has been explicitly developed to describe contemporary postindustrial societies. Footnote 55 We thus limit our analysis to variation in unemployment risk within occupational class groups. This means that to a large degree, we only exploit over time variation in these models. Footnote 56 Although it is certainly possible that people select into relationships based on membership in a specific class group, we assume that it is highly unlikely that people select into relationships based on finegrained variation in unemployment risks. By including these class fixed effects and leveraging within-class variation, we corroborate our results that both individual unemployment risk and partner’s risk significantly affect voting for the radical right. They do so in a pattern very similar to the one outlined in our main analysis.
Conclusion
In this article, we examine the economic roots of the populist radical right. We show that economic pressure might well result in not purely economic reactions in the electoral arena. We suggest that the relatively weak explanatory power of economic variables in previous empirical analyses is due to the neglect of two key insights of a literature that has recently taken a decidedly relational perspective to political behavior. First, radical-right support might be motivated much more by latent economic threats than by current material conditions.Footnote 57 Second, the study of economic insecurity should not only focus on individuals, but should also integrate household constellations to adequately capture overall risks to economic well-being.Footnote 58
Our analysis systematically incorporates these two aspects into a comprehensive assessment of the relationship between economic risk and radical-right support. Based on large-scale labor market data and cross-national survey data, we demonstrate that households are important sites of preference formation that shape the electoral effects of economic risk. In contrast to the idea of risk pooling, households do not seem to provide private safety nets when it comes to voting for the radical right. Rather, respondents react to the vagaries of economic modernization affecting anyone in the household. In fact, one high-risk person in a household may be a sufficient condition to significantly increase the probability of all other household members voting for the radical right.
Although we have focused on arguably the most important contextual condition with regard to human interactions, our results are likely to travel beyond voters’ homes. The dominance mechanism suggested by our analysis implies that interactions with other family members, friends, or colleagues who are adversely affected by latent labor market risks might also increase support for the radical right among voters who are less exposed themselves but who empathetically react to the well-being of relevant peers. Granted that such interactions might happen on a lower level of intensity compared to households: multiplier effects might be somewhat weaker, but we have no reason to expect fundamentally different patterns of preference alignment within voters’ broader personal networks. More generally, further research should investigate how latent economic threats to people’s in-groups affect their support for the radical right. Although our analysis has mostly focused on economic threats to social status, it should not indicate that no other such threats exist. In addition, future research may also dive deeper into the dynamics that play out in partnerships or within households. The fact alone that people live with or without a partner should affect their risk perceptions as well as their propensity to support the radical right. Combined with traditional gender roles, differences in risk, income, or education within households might affect perceptions of social status and could in turn determine voting for the radical right.
Our findings have important implications for empirical studies of radical-right support in all social science disciplines. As we demonstrate the crucial role that households play in moderating the effect of economic risks, our study points to the high risk of omitted variable bias when not taking contextual effects seriously. More precisely, studies that estimate the effects of individuals’ economic risk on voting for the radical right might underestimate these effects because one riskexposed individual within someone’s close personal network might be sufficient to increase support for the radical right—even among less vulnerable voters. While our study clearly documents that individual economic risk is an important driver of radical-right voting, the strength of this potential bias will be determined by the share of people that live in households with mixed levels of economic risk.
In line with other recent studies, the findings we present point to the important role that socioeconomic transformations play for the success of the radical right. Changes in economic risks are mainly the result of big social, economic, and demographic transformations. Since these insecurities have become politically associated with support for a group of parties that successfully channels this dissatisfaction, it is unlikely that the recent success of the radical right is short-lived. Although there is ongoing scholarly and public debate about how party positions and policy solutions concerning the issue of immigration may dampen the support for the radical right, our findings indicate that determinants of radical-right support might be more deeply rooted in the socioeconomic transformations of our time. This casts doubt on the idea that governments can successfully counteract the recent surge of the radical right through simple economic and social policy changes.
Supplementary Material
Supplementary material for this article can be found at https://doi.org/10.1017/S0043887121000046.
Data
Replication files for this article can be found at https://doi.org/10.7910/DVN/IVKRZY.
Acknowledgments
Previous versions of this article were presented at the annual meetings of the European Political Science Association (2018), American Political Science Association (2019), the Midwest Political Science Association (2019), and the Swiss Political Science Association (2020), as well as at seminar series at the University of Oslo, Stanford University, University Carlos III of Madrid, the University of Montreal, and the University of Lucerne. We would like to thank all the discussants and participants for their feedback. We would also like to thank Bart Bonikowski and Catherine de Vries for commenting on a previous version of the manuscript, as well as the editors and anonymous reviewers of World Politics for helping us to substantially improve the manuscript.
Authors
Tarik Abou-Chadi is an assistant professor in the Department of Political Science at the University of Zurich. His research focuses on elections, political parties, and the transformation of European democracies. He can be reached at tarik. abou-chadi@uzh.ch.
Thomas Kurer is a senior researcher in the Department of Political Science at the University of Zurich and is an incoming research group leader at the Cluster of Excellence, “The Politics of Inequality,” at the University of Konstanz. His research lies at the intersection of political economy, comparative politics, and political sociology. He can be reached at kurer@ipz.uzh.ch.