Social scientists have long been interested in how academic disciplines are organized (Ben-David and Collins 1966; Kuhn 1970; Lipset 1994; Rojas 2003; Somit and Tanenhaus 1964; 1967). One important element of this organization is the network of Ph.D. placements among Ph.D.-granting institutions. Various authors have linked the structure of placements to prestige rankings of departments (for sociology departments see e.g., Hanneman 2001; and Burris 2004; for political science departments see Masuoka, Grofman, and Feld 2007c), or have used various features of the structure of academic exchange networks to examine the shaping of disciplinary careers and practices (Feld, Bisciglia, and Ynalvez 2003; Masuoka, Grofman, and Feld 2007b). There is also a more general literature on status and market exchange (see e.g., Podolny 2005).
Using data on the structure of placements in Ph.D.-granting political science departments in the U.S. over the period 1960–2000 taken from Masuoka, Grofman, and Feld (2007a; 2007b; 2007c), and recent statistical (Kleinberg 1999) and graphical (Kamada and Kawai 1989) innovations in the study of social networks, we show how social network analysis can be used to illuminate the structure of the political science academic network. Our graphical representations clearly show the structure of the discipline in terms of what might be conceived of as a core-periphery network (Borgatti and Everett 1999; Feld, Bisciglia, and Ynalvez 2003).1
Other important types of networks that have been characterized in core-periphery terms are citation networks (e.g., by scholar or by journal or by country) and import-export networks.
The structure of this research note is to first discuss the methodology we use to combine information about (1) which departments are able to place their students in core departments and (2) which departments successfully hire and retain Ph.D.s from core departments. Next, we show graphical representations of the Ph.D.-placement network in the discipline. Then we consider how well various social network measures conform to reputation rankings of departments provided by U.S. News and World Report. Finally, we explore additional complications, such as how the structure of the discipline has changed over time, and what happens to placement rankings when we utilize information about the proportion of a department's Ph.D.s that were not placed in a Ph.D.-granting institution.
Introduction: Features of Directed Networks
In any directed network—such as one involving the placement of Ph.D. candidates—social ties (placements) indicate a one-way relationship from one node (department) to another. In our case, each direction is of interest because each contains different kinds of information. Outward ties reflect the capacity of the sending department to place its own students, while inward ties reflect the capacity of the receiving department to hire and retain faculty. One way to measure these capacities is simply to aggregate the number of outward ties (number of placements) or the number of inward ties (faculty size). Social network theorists call these measures of degree centrality (Proctor and Loomis 1951; Freeman 1979).
A department's degree centrality can be connected to its level of prestige within the academic profession a number of ways. Those departments with high outward degree centrality influence the basic structure of the profession by populating other Ph.D.-granting departments, thereby increasing the successful program's reputation (Grofman, Feld, and Masuoka 2005; Somit and Tanenhaus 1964; 1967).2
Reputation or status of a department has been found to play a significant role in political scientists' perceptions about the quality of that department's graduate students, thus influencing the ability of a Ph.D. to be hired. As early as the 1960s, scholars had identified a core set of institutions whose students dominated the majority positions on political science faculties. According to Somit and Tanenhaus (1964, 4): “Although all graduate departments seem to socialize students in essentially the same fashion and impose much the same requirements, the particular department at which a student takes his doctorate matters a great deal. That source of a man's doctorate is a status symbol that tends to mark him for life.” This hiring pattern may also have long-term ripple effects since alumni tend to have a more favorable view of their own department and may be biased toward hiring other alumni on their faculties (Grofman, Feld, and Masuoka 2005). For a more detailed discussion on social status and the practice of homophily, please see Blau 1964; McPherson, Smith-Lovin, and Cook 2001; Podolny 2005.
Therefore, rather than looking simply at raw in-degree and out-degree numbers, we want to make better use of the information in the Ph.D.-placement network so as not to treat all placements in exactly the same way. In particular, we should be able to use information about which institutions take Ph.D. students from which other institutions to improve our estimate of each department's capacity to place its graduate students. The limited number of faculty openings in Ph.D.-granting institutions means that there is a significant level of competition to place students. For example, suppose department i places most of its students in departments that place many of their own students, and department j places its students largely in departments that place few of their own students. This suggests that department i may be more prestigious than department j.3
There is a direct parallel here with ranking methods involving tournament competitions, e.g., to rank chess players or football teams. We would not want merely to count victories, but to assess the caliber of the opponent being beaten. Methodologies similar to what is used here have been devised for that purpose (see e.g., Batchelder and Bershad 1979).
Methodology
In order to estimate simultaneously the prestige of all departments in a network, some scholars (e.g., Burris 2004) use a measure called eigenvector centrality (Bonacich 1972). Suppose A is an n × n adjacency matrix representing all the departments in a network such that aij indicates the number of candidates that the ith department places in the jth department.4
We will later exclude same department-placements from our empirical analyses, so the main diagonal will contain all zeros.
Although there are n nonzero solutions to this set of equations, in practice the eigenvector corresponding to the principal eigenvalue is used (Bonacich 1987).
However, there are technical and substantive reasons why we might not want to use eigenvector centrality to estimate the prestige of political science departments. First, there is a technical problem with the Ph.D.-placement network data because many departments have not placed any of their students in other departments. This means their centrality scores are 0 and the eigenvector method assumes they add nothing at all to the reputation of the departments that place candidates there. Second, the eigenvector centrality approach to identifying prestigious departments assumes that only placements contain information about prestige.
While placements may be a primary indicator of network structure, the acquisition of faculty can also be informative. Hiring patterns may demonstrate the capacity of a department to attract and retain the faculty it wishes. Most departments, in principle, probably prefer to hire faculty from prestigious departments, although of course there will be exceptions (even many exceptions) based on the caliber and special skills of particular candidates. But, in any case, not all departments can always hire only from top departments, since there is only a limited pool of candidates from such departments, and there is strong competition for them. Thus, we can also use hiring results to provide additional information relevant to estimating prestige among departments. For example, suppose department i gets all of its faculty from departments that place well, while department j gets few of its faculty from such departments. This suggests that department i may itself be more prestigious than department j.
A recent advance in social network theory (Kleinberg 1999) allows us to draw on both placements and hires for assessing prestige.6
This method has recently been used to analyze Supreme Court precedents in the network of judicial citations (Fowler and Jeon 2007; Fowler et al. 2007).
The extent to which each department fulfills these two roles can be determined using a method closely related to eigenvector centrality. Suppose x is a vector of hiring capacity (authority) scores, y is a vector of placement capacity (hub) scores, and that these vectors are normalized so their squares sum to 1. Let each department's hiring capacity be equal to the sum of the placement capacity scores of the departments from which they hire candidates: xi = a1i y1 + a2i y2 + ··· + ani yn and let each department's placement capacity score be the sum of the hiring capacity scores for the departments where they place candidates: yi = ai1 x1 + ai2 x2 + ··· + ain xn. This yields 2n equations that we can represent in matrix format as x = ATy and y = Ax. Kleinberg (1999) shows that the solution to these equations converges to λx* = ATAx* and λy* = AATy*, where λ is the principal eigenvalue and x* and y* are the principal eigenvectors of the symmetric positive definite matrices ATA and AAT, respectively. The resulting placement and hiring capacity scores allow us to identify the most prestigious departments in the network—those that hire faculty from other prestigious departments and those that do well placing their own students.
Data
We use data compiled by Masuoka, Grofman, and Feld (2007b; see also 2007a; 2007c) that shows all placements of U.S. Ph.D.s within U.S. Ph.D.-granting political science departments for the period 1960–2000. The data combine information provided in the APSA 2000 Graduate Faculty and Programs in Political Science with supplementary information on faculty taken as needed from the APSA 2002–2004 Directory of Political Science Faculty. With a relatively limited number of exceptions, the data contain not just the information on which U.S. Ph.D.-granting institution a faculty member is currently teaching at (circa 2002), but also information about the institution from which that faculty member received his or her Ph.D. and the date of Ph.D completion.7
It is important to note that this data cannot be used to study departments that do not have graduate students.
In contrast to typical social network and citation data, our Ph.D.-placement network contains loops where the same node points to itself (Harvard Ph.D.s who were hired by Harvard, for example). Including these loops in the placement and hiring capacity score calculations is mathematically feasible, and one might argue that these observations should be retained like any other because they contain additional information about the scholars and departments in question. However, we suspect that it is probably easier for a school to hire its own, so these self-placements may not be unit homogenous with other-placements. Thus, we exclude them from the data. Of course this is not to say that loops cannot be used to effectively increase the reputation and identity of a department. The building of the Chicago School under Charles Merriam is an example of how loops may positively influence a department's reputation (Heaney and Hansen 2006).
Results
Table 1 shows placement and hiring capacity scores for the whole network. As noted above, placement scores indicate the capacity of the sender institution to prepare scholars to get jobs at Ph.D.-granting departments that hire well. Hiring capacity scores indicate the ability of the receiving institution to add scholars to its ranks from institutions that place well.9
However, this data does not tell us about retention length since they indicate only the job held in 2002. Nor is data about previous hires in this dataset. We might also note that top schools may be able to “afford” to “hire from anywhere” without those choices being reflected in any lowering of their prestige, since it is likely that it will be assumed that if they did hire x there must be something about x that was worthy of the hire, regardless of the institution from which x received his or her Ph.D.
Placement and Hiring Capacity Scores, Full Network

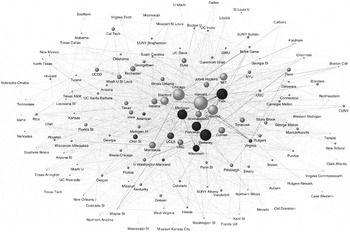
Figure 1 shows a picture of the Ph.D.-placement network. The sizes of the nodes in Figure 1 are proportional to placement scores and the darkness of each arc is proportional to the number of Ph.D.s that have gone from the sending institution to the receiving institution.10
Node placement was generated by the Kamada-Kawai algorithm, which specifies that connected nodes have zero energy at a fixed finite length that is inversely proportional to the strength of the tie (like a spring at rest). The algorithm then iteratively tries to reduce the amount of energy in the whole system with different placements of nodes.

Full Network of Ph.D.s
Notes: Each arrow indicates at least one placement was made by the originating department at the destination department. Number of placements is proportional to the shade of the arrow. Node size is proportional to placement score. Black nodes indicate top departments for both placement and hiring capacity.
Figure 1 reveals the extent to which there is an apparent core-periphery structure, with a density of ties in the center of the graph around the political science departments at Harvard, Chicago, and Columbia, with further strong ties to departments such as Yale, Berkeley, and Michigan, and then to departments such as Stanford, Princeton, Wisconsin, Northwestern, UCLA, Cornell, and Indiana.
Using Network Connectivity Measures to Predict Departmental Prestige
There are numerous way to rank departments, from citation counts or publication rates of faculty, to dollar value of grants received, to faculty memberships in organizations such as the American Academy of Arts and Sciences, and there may be multiple dimensions of success, e.g., some schools may simply be especially good at turning out scholars who get jobs at highly ranked departments and have distinguished careers in the discipline (see, for example, Masuoka, Grofman, and Feld 2007a; Miller, Tien, and Peebler 1996; Rice, McCormick, and Bergmann 2002). Often measures are based simply on reputation or on perceptions about the quality of the department in the minds of those doing the ranking (Somit and Tanenhaus 1964). For example, U.S. News and World Report, which compiles a list of the best departments based on surveys of department chairs, is an example of a reputation ranking. Research has shown that objective rankings that are based on measures such as publication rates or citation counts do not perfectly correlate with reputation rankings, telling us that each type of ranking depicts a different way of measuring prestige (Garand and Grady 1999; Jackman and Silver 1996; Masuoka, Grofman, and Feld 2007c).
The exchange of Ph.D. students among departments tells us at least some information about prestige, on the one hand, and quality, vis-à-vis the training of graduate students, on the other. The Ph.D.-placement network provides valuable aggregate information about the structure of the profession in ways that can be used to rank departments.
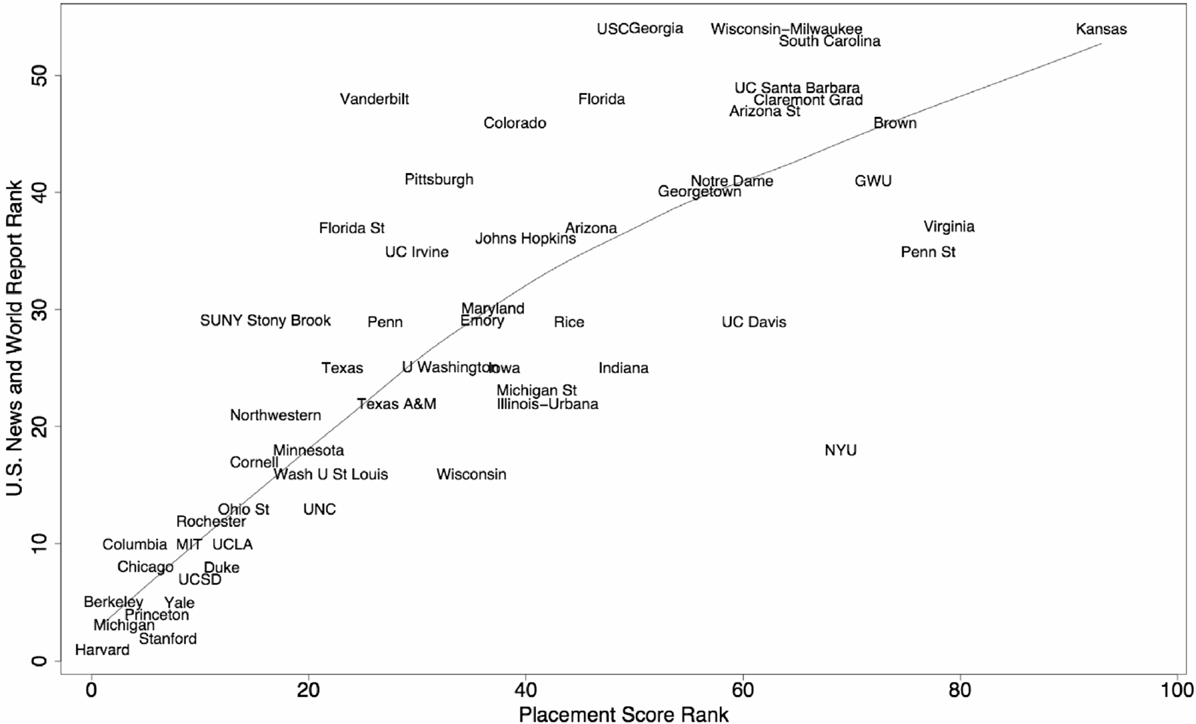
Figure 2 shows a strong relationship between the U.S. News and World Report rankings in 2005 and rankings derived from our placement scores based on the Ph.D.-placement network from 1993–2002. For all years, the Spearman rank correlation (henceforth r) between them is 0.84. The corresponding r for our hiring capacity scores is only 0.59, suggesting that scholars may be more strongly influenced in their perception of a department's quality by its ability to place students in good departments than the types of scholars hired as faculty. These results are verified in OLS regressions presented in the Appendix (Table A2). These regressions also show that the placement rank variable fits reputation rankings better than simple counts of inward or outward placements. In other words, the placement and hiring capacity scores generated by our method contain important information about department reputation that is not revealed in a simple count of placements to other departments.

Placement Score Ranks and U.S. News and World Report Rankings
The Dynamics of Placement
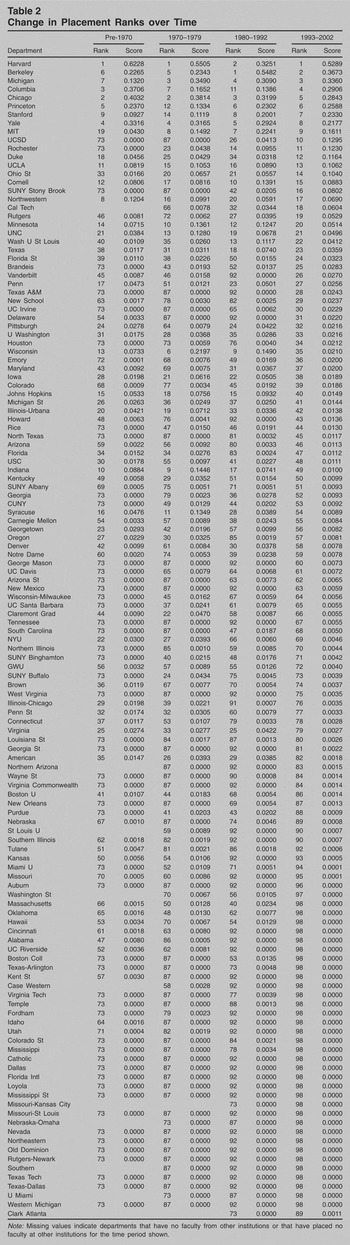
The data used in Table 1 and Figure 1 aggregate all available information for 1960–2002. As a result, these graphs do not indicate how the performance of some departments may have changed over time. Table 2 shows placement scores for four time periods (based roughly on equalizing total placements from each longitudinal cohort). These rankings show much the same pattern as the overall rankings, but dynamic phenomena are visible, such as dramatic improvements in the overall placements of departments like Rochester's and UCSD's as compared to their placement rate in the pre-1970 period, and the rise of Cal Tech's social science department to prominence.
Change in Placement Ranks over Time

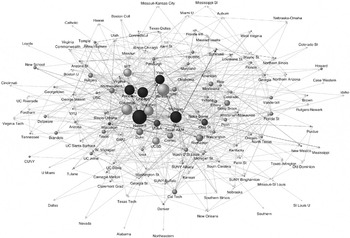
For comparative purposes, Figure 3 shows the graph of the network structure created from placement and hiring capacity scores for the sub network containing only scholars who received their Ph.D.s in the most recent of these periods, from 1993–2002. This is a sparser graph than the one shown in Figure 1, reflecting fewer placements in this smaller period. Departments like Harvard's continue to dominate the political science network, but we see some improving departments like those at Stanford and UCSD drawn closer into the core. However, other improving departments like Cal Tech's and Rochester's remain relatively peripheral in spite of their placement capacity. This is because their relatively small faculty size keeps them from receiving many ties from other institutions.

Network of Ph.D.s, 1993–2002
Notes: Each arrow indicates at least one placement was made by the originating department at the destination department. Number of placements is proportional to the shade of the arrow. Node size is proportional to placement score. Black nodes indicate top departments for both placement and hiring capacity.
If we restrict observations to recent Ph.D.s., as in Figure 3, we have the problem of a smaller sample and more random error variation in the “match” between the placements and hires (754 placements vs. 3,261 in the full network). Still, the findings are nearly identical: again placement scores conform much more closely to US News and World Report rankings (r = 0.82) than do hiring capacity scores (r = 0.56). Moreover, the low difference in correlation between the full network and the sub network suggests there is very little additional information about the current prestige of departments contained in the 2,537 placements of scholars with Ph.D.s granted in 1992 or earlier.
Placement Success Rates
In all analyses so far we have used the raw number of placements to estimate the strength of a tie from the sending department to the receiving department. The intuition is that the more students a department can place in other prestigious departments, the more central to the discipline it will be. But another way to think about placement is how well students in a department do on average when they go on the market. To determine this, we also need to know the total number of Ph.D.s produced by each department. We compile these data using statistics drawn from the National Science Foundation, the National Academy of Sciences, and the Department of Education's National Center for Education Statistics.
We can incorporate information that controls for production by letting aij indicate the number of candidates that the ith department places in the jth department, divided by the total number of Ph.D.s produced by department i, and then apply the same methodology described above to determine placement and hiring capacity scores. This means that departments that place a high proportion of their students at other institutions will tend to have high scores. Table 3 shows the results of this procedure.
Production-Adjusted Placement Scores

Notice that Cal Tech's department skyrockets to the top of the list. This is interesting, because in Figures 1 and 3 we saw that Cal Tech's department is relatively peripheral to the full network. Although it clearly has a high batting average with its students, its small size keeps it from having a larger impact on the discipline. Similarly, departments at UCSD, SUNY Stony Brook, and UC Irvine seem to do exceptionally well in placing the average student, suggesting they have more influence on the network than the small sizes of their graduate programs would indicate.
Discussion
We believe that the methods for analyzing patterns of placement in the political science social network convey a considerable amount of information about the core-periphery structure of the discipline. However, we would emphasize that our use of the terms core and periphery is not meant to have the pejorative connotations that sometimes go with that dichotomy as it is used, for example, in world systems modeling (e.g., Wallerstein 2004). It is often the case that the core is viewed as having a level of dominance over the periphery and of having an exploitative relationship with it (e.g., with core nations buying primary goods cheaply from peripheral countries while making it expensive for the peripheral countries of the world economy to modernize).11
Also see Forbes (1984). Other pejorative uses of the term “core-periphery structure” are found in some of the urban geography literature, which distinguishes areas where jobs are abundant, and standards of living high, from areas that are more peripheral.
Feld, Bisciglia, and Ynalvez (2003) show that there are multiple types of core-periphery networks and that Ph.D. exchange in sociology can be modeled as what they call a network of vertical ties, but, since our interest in this paper is primarily in visualization, we will neglect such further complications. Work in progress by a subset of the present authors reveals that political science also can be characterized as a network of vertical ties.
As noted earlier, it is apparent from Figures 1 and 3 that political science is characterized by a set of highly interconnected departments that hire each other's students. The heart of this exchange network includes the generally high-Ph.D.-producing departments referred to by Masuoka, Grofman, and Feld (2007b) as the “big eight,” those at Berkeley, Chicago, Columbia, Harvard, Michigan, Princeton, Stanford, and Yale; as well as departments such as those at UCLA, Cornell, and Wisconsin. Comparing Figures 1 and 3 further reveals how remarkably little change has occurred in the centrality of the very top departments in the network over time, although some other departments have become (marginally) more central and others (marginally) more peripheral, with only a few departments exhibiting substantial shift in relative location.13
We conducted a number of sensitivity analyses. Generating scores for a sub network of Ph.D.s 2000–2005 did not alter the scores much from the ones shown for 1993–2005. We also tried eliminating any institution that had not placed at least one Ph.D. at one of the other institutions in the network. This had very little effect on the overall scores.
Author Bios
James H. Fowler is associate professor at the University of California, San Diego. He is best known for his work on social networks, particularly his study of the spread of obesity published in the New England Journal of Medicine. He is also known for his work on egalitarianism and the evolution of cooperation which has appeared in Nature and Proceedings of the National Academy of Sciences, with related work on altruism and political participation appearing in the Journal of Politics, American Journal of Political Science, and American Journal of Sociology.
Bernard Grofman has taught at the University of California, Irvine since 1977 and has been a full professor there since 1980. A specialist on representation, he is a fellow of the American Academy of Arts and Sciences and a past president of the Public Choice Society. His latest book (as a junior co-author with Michael Regenwetter and others) is Behavioral Social Choice (Cambridge University Press, 2006).
Natalie Masuoka received her Ph.D. from the University of California, Irvine. In 2007–2008, she serves as a visiting research fellow and assistant professor with the Center for the Study of Race Ethnicity and Gender in the Social Sciences at Duke University. Her research interests include race and ethnic politics, immigration politics, and political behavior.
APPENDIX
Ph.D. Students Placed at Other U.S. Ph.D.-Granting Institutions (1960–2002) and Department Size (2002)

Predicting Reputation Rankings with Social Network Measures