1 Introduction
There is little doubt that an adequate supply of health workers (especially doctors and nurses) is needed to have an efficient health care system. Shortages and surpluses of health workers cause major access problems and often drive up the cost of delivering health care. This paper projects shortages and surpluses of doctors and nurses for countries in the Organisation for Economic Co-operation and Development (OECD).
In the next section, we present our conceptual projection model. This is followed by the specification of our demand model for doctors and nurses by country in the OECD. We then explain our approach for projecting the supply of doctors and nurses.
Our data section details the construction and sources of data used for our estimates and projections. We then present the results of our doctor projection model for 32 OECD countries and the results of our nurse projection model for 23 OECD countries. Finally, we discuss the implications of our projections and conclude with some policy suggestions.
2 Conceptual framework
The demand for health workers is derived from the demand for health care. The willingness to pay of health care purchasers (e.g. the government, private firms, individuals) ultimately drives the demand for the number of health workers to be employed in hospitals, clinics and public health centres. The demand for health workers is influenced by the fiscal capacity of governments, household incomes, and changes in the demographic and epidemiologic conditions of a population (Liu et al., Reference Liu, Goryakin, Maeda, Bruckner and Scheffler2016). Additionally, increases in the level of health coverage (i.e. the financial protection available to consumers) should increase the demand for health care as people are more able to access health care in times of need (Winkelmann, Reference Winkelmann2004; Bremer, Reference Bremer2014).
The supply of health workers can be defined as the number of people, with the skills and qualifications to provide care, who are willing to work in the health sector. Basic labour economics predicts that as wages increase in the health sector, more qualified people will become willing to work as health professionals and more students will apply for medical education, both of which will increase the future supply of health workers (Spetz and Given, Reference Spetz and Given2003; Tulenko et al., Reference Tulenko, El Maghraby, Soucat, Preker and Bruckner2016). Migration flows have also received considerable attention for having a large impact on the supply of health workers within countries (Stilwell et al., Reference Stilwell, Diallo, Zurn, Dal Poz, Adams and Buchan2003; Buchan, Reference Buchan2006; Crisp and Chen, Reference Crisp and Chen2014; Dussault et al., Reference Dussault, Buchan and Craveiro2016).
In well-functioning labour markets, imbalances between demand and supply are short lived. With a flexible wage rate that adjusts freely, employers and health workers will eventually reach an equilibrium. Labour markets may fail to reach equilibrium if wages are not flexible or demand and supply do not adjust to price signals (Soucat et al., Reference Soucat, Scheffler and Ghebreyesus2013; Scheffler, Reference Scheffler, Cometto, Tulenko, Bruckner, Liu, Keuffel, Preker, Stilwell, Brasileiro and Campbell2016).Footnote 1 McPake et al. (Reference McPake, Scott and Edoka2014) have shown that both rigidities occur in the health labour market. Wages in the health sector are often not flexible because (1) the public health sector (typically the largest employer in many countries) frequently sets wages with legislation (2) health professional associations use their bargaining power to negotiate higher wages and (3) regulation of health services, perhaps to ensure quality, makes it more difficult for workers to become employed wherever positions may be available.
3 Projecting demand
We develop demand models for doctors and nurses similar to the model developed in Liu et al. (Reference Liu, Goryakin, Maeda, Bruckner and Scheffler2016).Footnote 2 Previous studies have shown overall economic growth (as measured by national income) to be a strong predictor of health expenditures (Newhouse, Reference Newhouse1977; Getzen, Reference Getzen1990; Cooper et al., Reference Cooper, Getzen and Laud2003; Scheffler et al., Reference Scheffler, Liu, Kinfu and Dal Poz2008). In most countries, health workforce wages and benefits represent a significant share of total health expenditures (Hernandez et al., Reference Hernandez, Dräger, Evans, Tan-Torres Edejer and Dal Poz2006). As such, we expect a country’s income to be positively related to demand for doctors and nurses.
In addition to income, we include two measures that account for the health coverage and demographics of a country: %OOP and %Pop65. %OOP represents the percentage of a country’s health expenditures that are paid out-of-pocket. We expect this measure to be negatively related to demand for doctors and nurses as the more individuals must pay out-of-pocket to obtain care, the less likely they are to seek it out (Winkelmann, Reference Winkelmann2004). %Pop65 represents the percentage of a country’s population that is over 65 years old. As older individuals have more health problems, we expect an increase in %Pop65 to increase the demand for doctors and nurses (Cooper et al., Reference Cooper, Getzen, McKee and Laud2002; Zurn et al., Reference Zurn, Dal Poz, Stilwell and Adams2004). Ultimately, we estimated the same model for both doctors and nurses. The generalized linear model (GLM) for doctors that we estimated is as follows:
 $$\eqalignno{ \ln \left( {docs\,1000_{{it}} } \right)\,{\equals}&\,\beta _{0} {\plus}\beta _{1} \ln \left( {GDP\,per\,capita_{{it{\minus}1}} } \right){\plus}\beta _{2} {\rm \,\%\,}\,OOP_{{it{\minus}1}} \cr & {\plus}\beta _{3} {\rm \,\%\,}\,Pop65_{{it{\minus}1}} {\plus}\delta _{i} {\plus}\varrho _{{it}} ,$$
where docs1000 it is the number of doctors per 1000 population in country i in year t, gross domestic product (GDP) per capita is measured in US dollars at 2010 Purchasing Power Parities and δ i is a vector of country fixed effects. We applied the same model to nurses:
 $$\eqalignno{ \ln \left( {nurses\,1000_{{it}} } \right),{\equals}&\,\beta _{0} {\plus}\beta _{1} \ln \left( {GDP\,per\,capita_{{it{\minus}1}} } \right){\plus}\beta _{2} {\rm \,\%\,}\,OOP_{{it{\minus}1}} \cr &{\plus}\beta _{3} {\rm \,\%\,}\,Pop\,65_{{it{\minus}1}} {\plus}\delta _{i} {\plus}\varrho _{{it}} .$$
We lagged the explanatory variables in our model one year because budgets for doctor and nurse hiring are often determined a year prior to when hiring actually occurs. GLM was chosen over ordinary least squares (OLS) for its properties as a more flexible estimator. The parameters of the above model were estimated via maximum likelihood. Sensitivity tests using OLS produced similar results. Country fixed effects were included to account for time-invariant unobservable heterogeneity across countries. We clustered standard errors by country as model errors across years for a given country are likely correlated.
4 Projecting supply
On the supply side, the number of doctors and nurses in a country is a function of (1) the number of graduates (2) the import or export of health workers and (3) deaths and retirements of health workers. Our supply projections use historical data on doctor and nurse supply by country. We assume that the factors that determine supply are static and project the number of doctors and nurses in 2030 using trends that result from fitting an autoregressive integrated moving average (ARIMA) model for each country, separately for doctors and nurses. All OECD countries had sufficient doctor data to enable us to fit an ARIMA model for each country. In total, 10 OECD countries had nursing data that was insufficient for fitting an ARIMA model, so we will not report nursing demand, supply or shortage/surplus figures for these countries.Footnote 3
The process we used for selecting each ARIMA model is outlined in detail in Hyndman and Khandakar (Reference Hyndman and Khandakar2008). Non-seasonal ARIMA models are generally denoted ARIMA(p, d, q) with parameters p, d and q being non-negative integers which denote the number of time lags of the autoregressive model (p), the degree of differencing (d) and the order of the moving average model (q). An ARIMA model is a generalization of an autoregressive moving average (ARMA) model. ARIMA models are applied when the data shows evidence of non-stationarity and an initial differencing of the data (the ‘integrated’ part) is applied to reduce the non-stationarity. Let Y denote the original series and y the differenced (stationarised) series. Given a series of differenced data, y t , an ARIMA(p, d, q) forecasting equation can be written as
 $$\widehat{{y_{t} }}{\equals}c{\plus}\phi _{1} y_{{t{\minus}1}} {\plus}\,...,{\plus}\phi _{p} y_{{t{\minus}p}} {\minus}\theta _{1} e_{{t{\minus}1}} \,...{\minus}\theta _{q} e_{{t{\minus}q}} ,$$
where c is a constant,
 $\phi _{1} y_{{t{\minus}1}} {\plus}\,...{\plus} \phi _{p} y_{{t{\minus}p}} $
are the AR terms (lagged values of y) and
 ${\minus} \theta _{1} e_{{t{\minus}1}} \,...{\minus} \theta _{q} e_{{t{\minus}q}} $
are the MA terms (lagged errors).
The main task of forecasting using ARIMA models is selecting the proper combination of p, d and q. For each country-doctor or country-nurse times series, we selected d based on successive KPSS unit-root tests (Kwiatkowski et al., Reference Kwiatkowski, Phillips, Schmidt and Shin1992). This iterative procedure tests the data for a unit root. If the test result is significant, the data is differenced and then subsequently tested for a unit root. The procedure ceases once a test produces an insignificant result. If the first difference results in an insignificant test, then d would equal 1. Once d is chosen, we chose the orders of p and q that minimize Akaike’s Information Criterion (AIC):
 $${\rm AIC}{\equals}{\minus}2\,\log \left( L \right){\plus}2\left( {p{\plus}q{\plus}k} \right)$$
where L is the maximized likelihood of the model fitted to the differenced data and k=1 if c≠0 and 0 otherwise. The best model (smallest AIC) is then chosen from the following four models: ARIMA(2, d, 2), ARIMA(0, d, 0), ARIMA(1, d, 0) and ARIMA(0, d, 1) where d is the value selected from the successive KPSS unit-root tests. Once a model is chosen, p and q are varied by ±1 from their current values in search of a model with lower AIC. Additionally, the constant c is included if the current model has c=0 and excluded if the current model has c≠0, which is another method for searching for a lower AIC. Models with lower AICs replace the current model and the procedure is repeated until a model is found which cannot be improved upon with this procedure.
5 Data
Data from the OECD served as our primary data source for the 34 countries that were part of the OECD in 2013.Footnote 4 Our dependent variables – doctors per 1000 population (docs1000) and nurses per 1000 population (nurses1000) – are publicly available on the OECD website.Footnote 5 We used all historical data available prior to and including the last year of our estimation sample, namely 1960–2013 for doctors and 1978–2013 for nurses. The OECD website did not have doctors per 1000 population data for Chile, Greece and Portugal, and had sparse data for Ireland and Switzerland. Hence, for these five countries we used data from the WHO Global Health Observatory.Footnote 6 Ultimately, we decided to not report doctor demand projections for Estonia and Hungary as these countries had dramatic breaks in their time series making it difficult to create reliable projections. However, we retain consistent doctor time series data from Estonia and Hungary in the estimation sample.Footnote 7 Over the 54 years from 1960 to 2013, there were on average 35 doctors per 1000 population observations per country with less missing data in later years. Specifically, from 1995 to 2013 – the 19 years we use for estimating demand – there were 17.4 observations on average for the 32 countries in our sample. There were on average 3.2 doctors per 1000 population across OECD countries in 2013.
Several countries had structural breaks in their doctor time series data. Structural breaks could be due to countries changing their methods for estimating the number of doctors. The OECD doctor data identifies years in which breaks occur, but does not detail why the breaks occurred. Most series breaks did not lead to dramatic changes in reported doctors per 1000 population figures. However, we chose to only use consistent time series in our demand estimations (i.e. years over which there were no structural breaks). For countries with structural breaks, we used the most recent consistent time series for the country.Footnote 8 We used the full time series for each country in our supply estimation as ARIMA models are less sensitive to minor deviations from trend. Additionally, the ARIMA models we estimate are country-specific, so a reduction in observations due to minor breaks would likely leave us with some countries where producing an ARIMA model with a reasonable fit would be difficult due to a dearth of observations.
The nurses per 1000 population time series data we used starts later and is less complete than the doctors per 1000 population time series. We did not supplement the OECD nursing data with data from the WHO Global Health Observatory as nursing data in the WHO Global Health Observatory is generally sparser and appears less stable than the nursing data collected by the OECD. We did, however, replace the OECD nurse time series for the United Kingdom with 2001–2013 data from the UK’s Annual Labour Force Survey.Footnote 9 This replacement was made because nursing data from the OECD had time series breaks for the United Kingdom in 2007 and 2011, that made attempts at making projections for the United Kingdom less reliable.
The OECD data does not have nurses per 1000 population data for Chile and Greece. Among the remaining 33 OECD countries, our data set has on average 20 nurses per 1000 population observations per country for the 36-year timespan of 1978–2013. There were on average 9.2 nurses per 1000 population across OECD countries in 2013.
We report nurse demand, supply and surplus/shortage projections for 23 countries. As was the case with doctors, we only used a country’s most recent consistent time series in estimating nurse demand and its entire time series for estimating nurse supply.Footnote 10
GDP per capita (GDP per capita), out-of-pocket payments as a percentage of total health expenditures (%OOP) and population over 65 (%Pop65) served as the independent variables of interest in our doctor and nurse demand models. We used measures of GDP from the OECD’s GDP long-term forecast in our demand estimation (i.e. up to 2013) and for making projections (i.e. from 2014 to 2030).Footnote 11 This database has long-term (up to 2060) GDP forecasts for all OECD countries. Our GDP per capita variable is measured in US dollars at 2010 Purchasing Power Parities. The average GDP per capita across OECD countries was $30,414 (US $2010, PPP) in 2013 and is projected to increase by 40% to $42,503 (US $2010, PPP) in 2030.
We extracted 1995–2013 data on out-of-pocket payments as a percentage of total health expenditures from the World Development Indicators database maintained by the World Bank.Footnote 12 Data on out-of-pocket payments is not available before 1995, which means our doctor and nurse estimation begins after 1995. The average per cent of health expenditures paid out-of-pocket was 18.9% in 2013 and is projected to decrease to 17.6% in 2030 – a 7% decrease. We used the out-of-pocket payment projections from 2014 to 2030 that were used in Liu et al. (Reference Liu, Goryakin, Maeda, Bruckner and Scheffler2016). A full account of how these projections were made can be found in the aforementioned paper, and a summary of the method is provided in the online Appendix for completeness. We use the estimates and projections of total population and population aged 65 or over (for years 1995–2030) developed by the United Nations, Department of Economic and Social Affairs, Population Division.Footnote 13 The average per cent of the population over 65 in the OECD was 16.0% in 2013 and is projected to increase to 21.8% in 2030 – a 36% increase.
6 Results
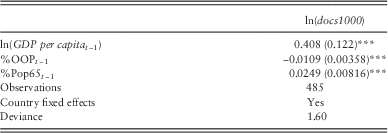
The estimates from our doctor demand model are presented in Table 1. The deviance, a measure of fit for GLM models, is a low 1.60, which signals a good fit. The more easily interpretable R 2 was 0.97 in the OLS version of the model. Our independent variables of interest are all significant at the 1% level in the directions that we expected: increases in per capita income are associated with an increase in the demand for doctors, increases in the percentage of health expenditures paid out-of-pocket reduce the demand for doctors, and an increase in the ageing of the population increases the demand for doctors. As both the dependent variable and income are logged, the coefficient on income can be interpreted as an elasticity. A coefficient of 0.408 implies that a 1% increase in GDP per capita in the previous year is associated with a 0.408% increase in demand for doctors per 1000 population.
Demand estimates for doctors, 1995–2013

Cluster-robust SE in parentheses.
*p<0.10, **p<0.05, ***p<0.01.
The coefficients for %OOP and %Pop65 can be interpreted as follows. A 1 unit change in %OOP in the previous year is associated with a 1.09% decrease in the number of doctors per 1000 population. A similar interpretation applies to the %Pop65 coefficient: a 1 percentage point increase in the previous year’s over 65 population is associated with a 2.49% increase in the number of doctors per 1000 population. The standardized regression coefficients from the OLS version of this model are 0.51 for ln(GDP per capita t−-1), −0.33 for %OOP t−1 and 0.28 for %Pop65 t−1. As these coefficients are all in the same standardized units, the relative strengths of the predictors can be compared. The standardized coefficients deem income to be the strongest predictor as its coefficient is the largest in absolute value.
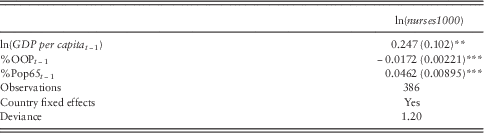
The demand estimates for nurses are reported in Table 2. Deviance is a low 1.20, which signals a good fit, while the R 2 from the OLS version of the model was 0.99. The directions and significance of the coefficients are similar to the coefficient estimates from the doctor demand model. Interpretation of the coefficients is as follows: a 1% increase in GDP per capita in the previous year is associated with a 0.247% increase in the number of nurses per 1000 population; a 1 percentage point change in %OOP in the previous year is associated with a 1.72% decrease in the number of nurses per 1000 population; a 1 percentage point increase in in the previous year’s over 65 population is associated with a 4.62% increase in the number of nurses per 1000 population.
Demand estimates for nurses, 1995–2013

Cluster-robust SE in parentheses.
*p<0.10, **p<0.05, ***p<0.01.
The estimated income elasticity for nurses is smaller than the estimated income elasticity for doctors (0.247 vs. 0.408). The coefficient for the over 65 population is notably larger in the nurse demand model than the doctor demand model (0.0462 vs. 0.0249). This difference supports the notion that nurses are particularly important in caring for the elderly. The standardized regression coefficients from the OLS version of this model provide additional support for this notion. The standardized coefficients are 0.16 for ln(GDP per capita t−1), −0.28 for %OOP t−1 and 0.29 for %Pop65 t−1, which indicates ageing of the population to be the strongest predictor of nurse demand as its coefficient is largest in absolute value.
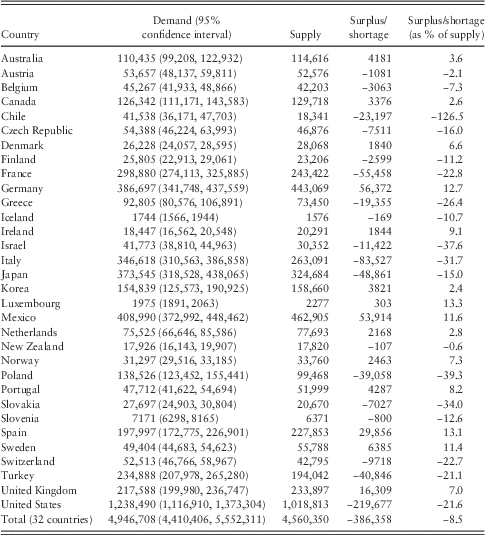
Doctor demand, supply and surplus/shortage projections for 2030 are presented by country in Table 3. The surplus/shortage column subtracts demand from supply so positive numbers are surpluses and negative numbers are shortages. The last column, surplus/shortage as a per cent of supply, is useful for judging the supply and demand imbalance of countries. Countries with low percentage totals (in absolute value) are roughly in balance. As a somewhat arbitrary rule of thumb, countries with percentages of more than 10% of supply should be considered significant surpluses or shortages. For the countries with a projected doctor supply of over 200,000 in 2030, we project shortages for France (−55,458, −22.8%), Italy (−83,527, −31.7%), Japan (−48,861, −15.0%) and the United States (−219,677, −21.6%) and we project surpluses for Germany (56,372, 12.7%), Mexico (53,914, 11.6%), Spain (29,856, 13.1%) and the United Kingdom (16,309, 7%). These eight countries account for 71% of the total projected supply of the 32 OECD countries included in Table 3. Across all 32 countries, we project a shortage of 386,358 doctors (−8.5%) in 2030.
Doctor demand, supply and surplus/shortage projections by country, 2030

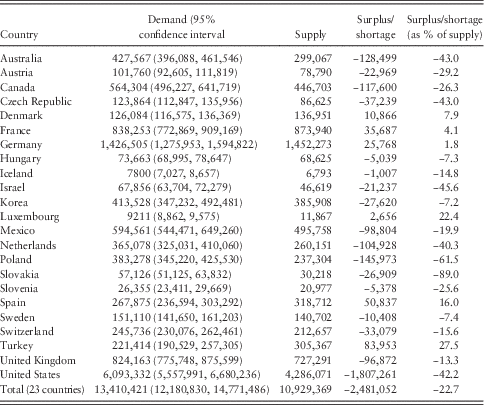
Table 4 shows our nursing projections for 2030. We project significant nursing shortages for a number of countries. Among the countries with projected nurse supply of over 400,000 in 2030, we project shortages for Canada (−117,600, −26.3%), Mexico (−98,804, −19.9%) the United Kingdom (−96,872, −13.3%) and the United States (−1,807,261, −42.2%) and surpluses for France (35,687, 4.1%) and Germany (25,768, 1.8%). These six countries account for 76% of the total projected supply of the 23 OECD countries included in Table 4. Across all 23 countries, we project a shortage of 2,481,052 nurses (−22.7%) in 2030.
Nurse demand, supply and surplus/shortage projections by country, 2030

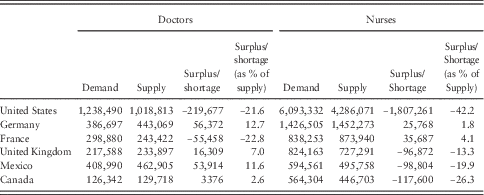
We combine the doctor and nurse demand, supply and surplus/shortage numbers for select countries in Table 5. The countries selected correspond to the six countries with the largest projected supply of nurses in 2030. These six countries account for 56% of the total projected doctor supply reported in Table 3 and 76% of the total projected nurse supply reported in Table 4. It is interesting that some countries do not have shortages of both doctors and nurses. The United Kingdom, Mexico and Canada are all projected to have small doctor surpluses along with significant nursing shortages in 2030. France is projected to have the opposite situation – a large doctor shortage along with a small nursing surplus. Germany is projected to have a significant surplus of doctors and a small surplus of nurses. The United States is projected to have significant shortages on both fronts – a shortage of −219,677 doctors (−21.6% of supply) and a shortage of −1,807,261 nurses (−42.2% of supply).
Doctor and nurse demand, supply and surplus/shortage projections for select countries, 2030

7 Discussion
Our projections assume current trends continue into the future. Changes in the migration patterns of doctors and nurses could have a significant impact on future doctor and nurse surpluses and shortages (see e.g. Kopetsch, Reference Kopetsch2009; Aiken et al., Reference Aiken, Buchan, Sochalski, Nichols and Powell2004; Forcier et al., Reference Forcier, Simoens and Giuffrida2004; OECD, 2010; Gouda et al., Reference Gouda, Kitt, Evans, Goggin, McGrath, Last, Hennessy, Arnett, O’Flynn and Dunne2015). In 2013–2014, 460,000 foreign-trained doctors and 570,000 foreign-trained nurses (accounting for 17% of all doctors and 6% of all nurses) were estimated to have been working in OECD countries (OECD, 2016). A recent report showed that the share of a country’s doctors that are foreign-trained varied widely across OECD countries in 2015 – from over 30% in Israel, New Zealand, Norway, Ireland and Australia to under 3% in the Czech Republic, Netherlands, Estonia, Poland and Turkey (OECD, 2015). For the five countries with a share of foreign-trained doctors above 30%, we project an average shortage of −3.6% of supply. For the five countries with shares below 3%, we project an average shortage of −18.4% of supply. Thus, our projections are consistent with the notion that countries can lessen or resolve future doctor shortages if they are willing and able to import foreign-trained doctors.
However, relatively high current rates of doctor importation may not make countries immune to future doctor shortages. The United States, with 25.0% of its doctors being foreign-trained is well above the OECD average 17.3%, but we still project the United States to have considerable doctor shortages in 2030. In contrast, Germany is well below the OECD average with only 8.8% of its doctors being foreign-trained, but we project Germany to have a surplus of doctors in 2030. Germany is producing enough doctors domestically that it can retain its low rate of doctor importation while avoiding future doctor shortages.
The share of foreign-trained nurses also varied considerably across OECD countries in 2015 – from over 10% in New Zealand, Switzerland, Australia, the United Kingdom and Israel to under 3% for 12 OECD countries, including France and Spain. The four countries above 10% foreign-trained that appear in Table 4 – Australia, Israel, Switzerland and the United Kingdom – are all projected to have sizable nursing shortages in 2030, so it appears that their relatively high importation of nurses is not going to be enough to keep them from future nursing shortages.
An aspect of these migration trends that deserves considerable attention is the migration of doctors and nurses from low-income countries to high-income countries (Stilwell et al., Reference Stilwell, Diallo, Zurn, Vujicic, Adams and Dal Poz2004; Cometto et al., Reference Cometto, Tulenko, Muula and Krech2013; Karan et al., Reference Karan, DeUgarte and Barry2016). High-income countries are likely to continue to be able to import health workers from low-income countries, as wages for health workers are considerably higher in high-income countries. Data from 2008 to 2011 showed medical doctors earn 20 times less in Ukraine than in the United States (Tijdens et al., Reference Tijdens, De Vries and Steinmetz2013). This raises the question: why would high-income countries address their shortfalls in domestic supply if recruitment of international health workers is cheaper? Changing this dynamic will require significant political will and policy intervention. There needs to be an openness among countries for identifying innovative approaches to achieving greater health labour market equilibria (Evans et al., Reference Evans, Araujo, Herbst and Pannenborg2016).
Aside from differences in the net import or export of health workers among OECD countries, there are significant differences in the number of medical and nursing graduates produced by each OECD country. In 2013 (or nearest year), the medical graduation rate per 100,000 population varied from a high of 20.3 in Ireland to a low of 5.1 in Israel (OECD, 2015). This high graduation rate for Ireland could be the driver that led us to project a 1844 doctor surplus for the country in 2030. Israel’s low graduation rate may also be the driver of our projection that the country will experience a shortage of 11,422 doctors in 2030. On average, the graduation rate was 11.5 medical graduates per 100,000 population across the OECD. The number of medical graduates in the United Kingdom doubled between 2000 and 2013 as the country made an effort to increase its domestic supply so that it was able to rely less on foreign-trained doctors by 2030 (OECD, 2015). This may be the trend that is leading us to project a surplus of 16,309 doctors for the United Kingdom.
Among the six countries displayed in Table 5, the United States and France are the only countries projected to face considerable doctor shortages in 2030. Both countries are well below the OECD average of 11.5 medical graduates per 100,000 population, with the United States at 7.3 medical graduates per 100,000 population and France at 9.0 medical graduates per 100,000 population (OECD, 2015). This suggests that the relatively low rates of medical graduation in these countries could be a significant factor in explaining why these countries are projected to have shortages by 2030.
There was even greater variation in the rate of nursing graduates across the OECD in 2013 than there was for medical graduates. At the high end, South Korea graduates 97 nurses per 100,000 population. At the low end, Mexico graduates 11 nurses per 100,000 population. The average across the OECD was 47 nursing graduates per 100,000 population (OECD, 2015). Over the past decade, the number of nursing graduates has increased in all OECD countries, but at different rates. In the United States, following large decreases in student intakes during the 1990s, the number of nursing graduates increased by 70% from 2003 to 2013. The number of nursing graduates in France increased by 50% from 2003 to 2013, which is a likely reason for why we projected a nursing surplus for France in 2030.
Shortfalls in supply could also come about as doctors and nurses retire. The age profile of the doctors and nurses within countries can tell us a lot about when potential shortfalls are most likely to take place. As of 2013, the share of doctors aged 55 and over varied from a low of 13% in the United Kingdom to a high of 49% in Italy and Israel (OECD, 2015). On average, the share of doctors over 55 was 33% across the OECD.
Projections of health worker shortages have a number of important limitations and caveats on both the demand and supply side. On the demand side, the growth of national income is a key component. Projections of a country’s income are more uncertain and less precise as the projection time frame increases. As is well known, recessions and business cycle changes can alter national incomes dramatically and impact in a significant way the demand for 2030 health workers that we projected. In addition, the diffusion of new medical technologies could have significant effects on the work patterns on doctors and nurses. For example, improvements in artificial intelligence could lead to a reduction in the demand for the services of doctors and nurses.
Supply side projections are more in the control of the health sector. Our projections assume that current country-specific trends in the supply of health workers will continue. However, there are important supply side assumptions that are worth noting.
As we have already discussed, there is a large migration of health workers mostly from low-income countries to high-income countries who are able to pay higher wages (Buchan, Reference Buchan2006; OECD, 2010; Dussault et al., Reference Dussault, Buchan and Craveiro2016). These migrations patterns can be changed by laws or regulations as well as political events that limit migration (OECD, 2016). This could have a significant impact on our supply projections so detailed studies of health worker migrations patterns are clearly called for (OECD, 2016).
It is well known that the hours worked differ across OECD countries, doctors and nurses, and between private and public practice. In 2015, the average annual hours worked per worker ranged from a low of 1368 h/worker in Germany to 2248 h/worker in Mexico (OECD, 2017). In the United States, data show female physicians worked 49 h/week on average while female nurses worked 41 h/week on average (Hecter, Reference Hecter1998). And in Sweden, the passage of a 2010 law resulted in many public primary care physicians moving to the private sector (Anell, Reference Anell2011; Saltman, Reference Saltman2015), which likely resulted in a significant increase in the number of hours worked by Swedish primary care physicians. Increasing hours worked by doctors would lower our doctor supply projections. It is important not to forget that health workers are often complementary, so more doctor hours will likely mean more nurse hours. In some services, however, doctors and nurses are substitutes, meaning more nurses would decrease the need for doctor. These patterns need to be better understood to fully analyse the impact of a change in hours on the supply of health workers. Finally, there are safety concerns when health workers increase their hours (Fletcher et al., Reference Fletcher, Davis, Underwood, Mangrulkar, McMahon and Saint2004).
Increases in the number of health workers being trained would also impact our supply projections. This strategy is very expensive and has a long lead time. It is likely to take eight to ten years to build and staff new medical schools before the first student graduates. The training of new health professionals should be targeted to likely future demand for health care. The current demographic shift is clearly the ageing of populations, which increases demand for all health workers, but particularly nurses.
Health worker retention also has potential to affect our supply projections. In particular, nurse retention has historically been a problem (Shields and Ward, Reference Shields and Ward2001; Kleinman, Reference Kleinman2004; Force, Reference Force2005). Better health worker retention, either from health workers retiring later or improved job satisfaction, would increase future health worker supply.
Notwithstanding these important limitations and caveats our projections are useful for governments and the private sector to consider in workforce planning. They give a rough order of magnitude that can be used as a benchmark. The impact of demand and supply policies can be evaluated and scaled against the benchmark projections we present. Thus, our projections are a useful beginning for health worker policies, which are crucial to the successful functioning of a country’s health system.
Finally, we suggest that our projections be updated annually to account for key changes in the demand and supply of health workers. Improved and timely data are a key element of monitoring workforce changes. Investing in health worker data will allow for better projections and policy to improve the contribution of a country’s health workers toward the goal of better population health.
Supplementary material
To view supplementary material for this article, please visit https://doi.org/10.1017/S174413311700055X