Over past decades, a large literature has examined the relationship between legislature size and public expenditure. Weingast, Shepsle and Johnsen (Reference Weingast, Shepsle and Johnsen1981) provide the general framework to analyse distributive politics. The authors argue that the larger the number of legislative districts (n), the smaller the share of tax burden each one will bear (1/n); thus, legislators have an incentive to overspend in their districts and transfer the costs to the entire polity. Early studies that empirically tested the ‘law of 1/n’, as the theory is currently known, indeed found a positive correlation between the number of legislature seats and different measures of government spending, though these first results were mainly based on US state legislatures and the effect was often limited to one house (see, for example, Baqir Reference Baqir2002; Gilligan and Matsusaka Reference Gilligan and Matsusaka1995; Gilligan and Matsusaka Reference Gilligan and Matsusaka2001).
Later research, however, has questioned the validity of the ‘law of 1/n’. Primo and Snyder (Reference Primo and Snyder2008) affirm that, due to spatial spillovers, a collection of small districts can supply public goods more efficiently than the central government. The authors conclude that a ‘reverse law of 1/n’ may hold, wherein a higher number of legislators in small constituencies decrease overall public spending. Similarly, Primo (Reference Primo2006) and Chen and Malhotra (Reference Chen and Malhotra2007) find that lower and upper chambers may have mixed effects on government spending, while Pettersson-Lidbom (Reference Pettersson-Lidbom2012) argues that the impact of larger chamber sizes is negative when using data from Finland and Sweden.
Since many empirical tests of the ‘law of 1/n’ have produced conflicting results, scholars have expanded this research agenda and closely investigated how institutional factors condition the original formulation of the theory. For instance, such authors as Crowley (Reference Crowley2019) and Pecorino (Reference Pecorino2018) accurately point out that collective action problems have been overlooked in the literature, and recent findings indicate that bicameralism (Maldonado Reference Maldonado2013), intergovernmental competition (Crowley Reference Crowley2015), redistricting (Lee and Park Reference Lee and Park2018) and party ideology (Bjedov, Lapointe and Madiès Reference Bjedov, Lapointe and Madiès2014) strongly influence the relationship between seats and spending. Moreover, the literature has increasingly applied causal inference methods to estimate the effect of the ‘law of 1/n’, and in contrast to previous studies using panel data, regression-discontinuity designs (RDDs) generally indicate that having more legislators decreases public expenditures (De Benedetto Reference De Benedetto2018; Höhmann Reference Höhmann2017; Lewis Reference Lewis2019; Pettersson-Lidbom Reference Pettersson-Lidbom2012). In this respect, scholars have long been aware of the theoretical and empirical limitations of the ‘law of 1/n’, and the proliferation of new studies reflects a conscious attempt to assess the robustness of the theory.
In this letter, we conduct the first meta-analysis that tests the generality of the ‘law of 1/n’. We select thirty articles that use quantitative methods to evaluate the impact of legislature size on government spending across several dimensions. Our study sample mirrors the diversity of the literature. We found articles that present a positive association between the number of legislators and public expenditures, others suggesting that such relationship is negative, and yet others claiming that there is no correlation between them. Given the volume and the disparity of the studies, we employ meta-analysis to summarize the results. Meta-analysis provides a rigorous approach to combine heterogeneous outcomes into a single estimation, and it allows scholars to gain valuable insights from the aggregated data (Cooper, Hedges and Valentine Reference Cooper, Hedges and Valentine2019; Hedges and Olkin Reference Hedges and Olkin1985). Meta-analysis can also identify potential sources of study variability, enabling researchers to assess threats to external validity and direct future efforts into more promising areas of academic inquiry (Doucouliagos and Ulubaşoğlu Reference Doucouliagos and Ulubaşoğlu2008). Research synthesis methods have been successfully applied in medicine and psychology since the 1970s (Glass Reference Glass2015), and our work contributes to the burgeoning literature that uses meta-analytic methods to understand challenging questions in political science (Costa Reference Costa2017; Doucouliagos and Ulubaşoğlu Reference Doucouliagos and Ulubaşoğlu2008; Green, McGrath and Aronow Reference Green, McGrath and Aronow2013; Lau, Sigelman and Rovner Reference Lau, Sigelman and Rovner2007; Schwarz and Coppock Reference Schwarz and Coppock2020).
Aggregate results indicate that legislature size has no significant impact on public spending. Our main meta-analysis estimates show that the overall effect is not statistically different from zero, thus confirming the conflicting findings reported by the literature. However, methodological choices partially explain these divergent results. When we look only at articles that use RDDs, all four articles included in our sample consistently report a negative relationship between a higher number of legislators and public expenditures. Our meta-regressions provide further evidence that study designs significantly influence the results. Using a sample of 162 coefficients, we find that articles that use causal inference methods report lower effects than those that use ordinary least squares (OLS) and that unicameralism is associated with higher government expenditures.
Data and Methods
We compiled our study sample in three search rounds. In the first round, we gathered data from three large academic databases (Scopus, Microsoft Academic and Google Scholar) and looked for studies that were written in English and cited Weingast, Shepsle and Johnsen (Reference Weingast, Shepsle and Johnsen1981), as it is the foundational work in the literature on the ‘law of 1/n’. To ensure that our sample was comparable, we only selected studies that used quantitative methods to analyse data.Footnote 1 After this stage, we identified six measurements that the literature often employs to quantify government expenditure and legislature size. For government expenditure, our study sample uses the following as its main variables of interest: (1) public expenditure as a share of gross domestic product (GDP); (2) public expenditure per capita; and (3) the natural logarithm of public expenditure per capita. In regards to legislature size, the variables are: (1) lower chamber size; (2) natural logarithm of lower chamber size; and (3) upper chamber size.Footnote 2
In the second round, we did not require articles to cite Weingast, Shepsle and Johnsen (Reference Weingast, Shepsle and Johnsen1981) and we used a keyword-based query on Google Scholar to broaden the scope of the first search. The search string contained terms strongly associated with the literature on the ‘law of 1/n’, and it was as follows: (‘upper chamber size’ OR ‘lower chamber size’ OR ‘council size’ OR ‘parliament size’ OR ‘legislature size’ OR ‘number of legislators’ OR ‘legislative size’) AND (‘spending’ OR ‘expenditure’ OR ‘government size’). We again restricted the search to articles written in English that employed quantitative methods. This search added two new results to our sample (Coate and Knight Reference Coate and Knight2011; De Benedetto Reference De Benedetto2018), but neither of them included variables beyond the six measures we had previously identified. In the third search round, we looked into the personal webpages of every author whom we had already included in our sample. The purpose of this manual search was to assess whether there was any working paper or unpublished manuscript that we had missed in the two former queries. We did not find any new study that satisfied the inclusion criteria in this search. The full list of excluded records is available for online consultation in the replication materials. Combined, the three searches produced a dataset of thirty studies as of 10 March 2021. Table 1 contains the full list of studies that we analyse in this article.
Studies included in the meta-analysis, ordered by year of appearance

Notes: Unpub = unpublished; JPE = Journal of Political Economy; EJPE = European Journal of Political Economy; PC = Public Choice; JPubE = Journal of Public Economics; APSR = American Political Science Review; SEJ = Southern Economic Journal; UAR = Urban Affairs Review; SCID = Studies in Comparative International Development; SSQ = Social Science Quarterly; SPPQ = State Politics and Policy Quarterly; CPS = Comparative Political Studies; RivPE = Rivista di Politica Economica; E&P = Economics and Politics; NTJ = National Tax Journal; ExpPC = per capita expenditure; logExpPC = natural logarithm of per capita expenditure; PCTGDP = expenditure as a percentage of GDP; IV = instrumental variables; Panel = panel data/fixed effects; M = majoritarian; NM = non-majoritarian (mixed or proportional representation). Country codes follow the International Organization for Standardization (ISO) 3166-1 alpha-3 international standard.
Our study sample reflects the development of the literature. Although the ‘law of 1/n’ was first formulated in 1981, the empirical assessment of the theory only started a few years later, as dates of publishing range from 1998 to 2019. Most studies focus on the United States (fourteen), but our sample also contains studies on Australia (one), Brazil (one), Germany (two), Indonesia (one), Italy (two) and Switzerland (two). Seven articles use cross-national data and analyse 2–110 countries. Early studies used OLS and panel-data methods to estimate the results, while studies from 2005 onward have also applied causal-inference models, such as instrumental variables (IVs) and RDDs, to test the relationship between house size and public spending.
Regarding the dependent variables included in the sample, sixteen studies employ public expenditure per capita, nine use its natural logarithm and eight analyse the impact of legislature size on public expenditures as a percentage of GDP. This indicates that the area has refined the original definition of the ‘law of 1/n’ and tested the impact of larger legislatures on different measures of government spending. Our independent variables are lower chamber size (twenty-six), the natural logarithm of lower chamber size (seven) and upper chamber size (twelve). These variables formed a 3 × 3 table, though not all combinations were available in the data. We found no studies that correlate public expenditure per capita with either upper chamber size or the natural logarithm of lower chamber size. Thus, our meta-analysis contains seven of the nine possible variable combinations.
We also coded five moderators that may help us understand the heterogeneity in the reported results. We included them in our meta-regressions alongside an indicator for the type of independent variable used in the original study. The additional moderators are: (1) publication year; (2) study publication in an academic journal; (3) estimation method; (4) institutional design; and (5) electoral system. Since the literature on the ‘law of 1/n’ is notably diverse, we only added moderators that refer either to important theoretical questions, such as the effect of the electoral system on public spending, or to the essential characteristics of the publications themselves. Although more moderators exist in the literature (for example, data-aggregation level), they do not appear as often as necessary for their inclusion in the meta-regressions. Table 2 shows the descriptive statistics of the moderator variables.
Descriptive statistics of moderators

A key methodological issue we had to address concerns the potential violation of an important assumption in a meta-analysis, that of effect-size independence (Cheung Reference Cheung2014; Cheung Reference Cheung2019; Veroniki et al. Reference Veroniki2016). In our study sample, authors frequently use the same datasets and almost all studies fit more than one regression with similar variables, which suggests that the aforementioned assumption does not hold. We use two procedures to tackle this problem. First, we created two sets of study coefficients to reduce the impact of multicollinearity in our estimations. The first group includes only the most rigorous models from each study, that is, those estimated with the largest n, most control variables and fixed effects if the authors added them. If the article employed a RDD, we chose the coefficient from the optimal bandwidth or from the intermediate one. This sample encompasses forty-five estimates, as thirteen studies analysed two dependent or independent variables of interest.Footnote 3 Our second sample, in contrast, contains all the 162 effect sizes reported in the thirty studies. Here, we focus on the results for our restricted sample, as we consider them more robust, but the findings are nearly identical when we use the extended set.
Our second procedure consists of employing multilevel random-effect models (Cheung Reference Cheung2014; Matthes et al. Reference Matthes2019) in all of our estimations. We add two extra levels to the regular meta-analysis: the first including a unique publication ID for each study; and the second containing a common index for studies that share the same data specifications. By adding these two levels, we account for within- and between-study variation, thus removing these sources of effect-size dependency and improving the accuracy of the results. More information about the multilevel models can be found in Section H.1 of the Online Supplementary Material.
We use Hedges' g to calculate effect sizes in our meta-analysis (Hedges Reference Hedges1981). While there are other methods to standardize coefficients in meta-analytic studies, Hedges' g corrects for upward bias in small sample sizes and is considered more robust than such measures as Cohen's d (Lakens Reference Lakens2013). We estimate the standardized mean difference (SMD), which represents the effect size in each study relative to the variability observed in that study, by extracting the coefficients and the standard errors from all articles included in our sample and converting them to Hedges'g. In cases where authors did not report the standard errors for their estimates, we computed them using the t-statistic presented in the original tables.
Results
The ‘law of 1/n’ states that having more legislators increases government expenditure. In this article, we employ two methods to test the empirical validity of that relationship.Footnote 4 First, we fit nine multilevel meta-analyses using the ‘meta’ (Balduzzi, Rücker and Schwarzer Reference Balduzzi, Rücker and Schwarzer2019) and the ‘dmetar’ (Harrer et al. Reference Harrer2019) packages for the R statistical language (R Core Team 2019). Then, we run four sets of meta-regressions to measure the effects of a group of moderators on the effect sizes of our study sample. To recapitulate, our independent variables of interest are lower chamber size, the natural logarithm of lower chamber size and upper chamber size. The dependent variables are public expenditure per capita, the natural logarithm of public expenditure per capita and government expenditure as a percentage of GDP. Since the outcomes have different scales, we treat them separately in our models.
Meta-Analysis
We begin with the meta-analysis. We matched the house-size variables with our measures of government spending and created a theoretical 3 × 3 matrix. Out of the nine variable combinations, we found only seven in the article pool. Our sample does not contain any studies that analyse the relationships between log lower chamber size and public expenditure per capita, or between upper chamber size and the logarithm of public expenditure per capita.
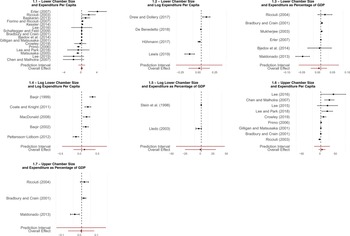
Figure 1 shows the forest plots for our restricted sample, which includes the forty-five main coefficients of the thirty selected studies.Footnote 5 On the left side of the plots are the names of the study authors and publication years. For unpublished studies, we included the first year the paper was available online. The bars in the middle show the reported effect sizes and the vertical lines indicate their average, weighted by standard errors. The lengths of the lines represent the precision of the estimates. The red line at the bottom of the figures displays the overall effects plus their respective confidence intervals (CIs).
Forest plots of the relationship between legislature size and government spending (main sample). Black bars denote the standard error reported by the authors, and the red bars indicate the standard errors of our estimates.

The uppermost row shows the results for lower chamber size in our restricted sample. In the first model, which correlates lower house and expenditure per capita, we find an SMD of 0.022 and a standard error of 0.131 (see Panel 1.1 of Figure 1; studies = 16, 95 per cent CI = [−0.256; 0.299], p-value = 0.87), so we cannot rule out that the effect is zero. Indeed, the effect of lower chamber size on the other two dependent variables is also null in statistical terms. When we compare lower chamber size with log expenditure per capita, the overall effect size is −0.031 and the standard error is 0.049 (see Panel 1.2 of Figure 1; studies = 4, 95 per cent CI = [−0.188; 0.127], p-value = 0.58). The impact of larger lower houses on government spending as a percentage of GDP is also negligible (see Panel 1.3 of Figure 1; studies = 6, SMD = −0.006, 95 per cent CI = [−0.0334; 0.021], p-value = 0.563). The results are virtually identical when we estimate the meta-analyses using our extended sample, and all three coefficients are again statistically indistinguishable from zero.
Next, we present the meta-analyses using the logarithm of lower house size as an independent variable. The relationship between this variable and the log of per capita expenditure is positive, but the coefficient is not significant (see Panel 1.4 of Figure 1; studies = 5, SMD = 0.078, SE = 0.109, 95 per cent CI = [−0.225; 0.381], p-value = 0.515). The effect of log lower house size on expenditure as a percentage of GDP is negative, but it is again not statistically significant (see Panel 1.5 of Figure 1; studies = 2, SMD = −1.576, SE = 2.223, 95 per cent CI = [−29.82; 26.668], p-value = 0.607). Results in the full sample are also null, and the coefficients for each dependent variable have the same sign as the restricted sample – positive and negative, respectively.
The third set of models uses upper house size as the main independent variable. We find a positive correlation between this variable and expenditure per capita (see Panel 1.6 of Figure 1; studies = 9, SMD = 3.658, SE = 4.299, 95 per cent CI = [−6.255; 13.572], p-value = 0.419), and a negative relationship with government spending as a percentage of GDP (see Panel 1.7 of Figure 1; studies = 3, SMD = −0.003, SE = 0.018, 95 per cent CI = [–0.079; 0.074], p-value = 0.891), yet neither coefficient is statistically significant. Results are the same in our extended sample.
Taken together, these results yield conservative interpretations. Besides all average effect sizes not reaching conventional levels of statistical significance, the studies are also notably heterogeneous. The I 2 statistic quantifies the degree of heterogeneity among studies. Higgins et al. (Reference Higgins2019) consider any I 2 value above 75 per cent to indicate high heterogeneity, and the lowest I 2 we find in the restricted sample is 80.7 per cent (for the subset of upper chamber size and per capita expenditure). Additionally, all prediction intervals encompass zero. Therefore, we cannot reject the null hypothesis that the effect size is zero in any variable combination.
In a nutshell, we do not find evidence in favour of the ‘law of 1/n’. One reason for this may be the identification strategy authors use in their models. On the one hand, OLS and panel-data models require too many controls to make units comparable, and they are vulnerable to omitted variable bias or post-treatment bias (Cinelli and Hazlett Reference Cinelli and Hazlett2020; Pearl Reference Pearl2015). On the other hand, such estimation methods as IVs and RDDs have become popular because of their high internal validity (Angrist and Pischke Reference Angrist and Pischke2008). Figure 2 shows the disaggregated effects for two sets of models that employ causal estimation techniques. They measure the impact of lower house size on expenditure per capita (left) and on the natural logarithm of expenditure per capita (right).
Forest plots of the relationship between legislature size and government spending with regression method heterogeneity (main sample).

Studies that employ IV and panel/fixed-effects models show somewhat symmetrical distributions. Out of the five studies listed under IV, two are positive, two are negative and one is null. In the plot for panel data, although more studies accumulate negative coefficients, the positive shifts are more pronounced, so the overall effect is also null. In contrast, all studies that use RDDs show negative and statistically significant results. Since only three studies in this model use RDDs,Footnote 6 we are cautious about predicting an overall negative relationship, but they do indicate that better identification strategies yield a zero-to-negative impact of legislature size on expenditure, in support of the ‘reverse law of 1/n’.
Meta-Regressions
In this section, we run a series of meta-regressions with six moderators to account for the heterogeneity across the selected studies. The first variable indicates whether the study uses lower chamber size, log lower chamber size or upper chamber size as a main explanatory variable. We include separate effect sizes for upper and lower chamber sizes when studies analysed both. The second variable shows the study publication year, which we included to capture temporal variation in the study coefficients. We also add a dummy variable to assess whether published articles report effect sizes that are higher or lower than those from working papers. The fourth variable measures whether studies focusing on non-majoritarian electoral systems report coefficients that are smaller or larger than those from majoritarian countries. The fifth covariate is a categorical variable indicating the statistical procedure used in the original models (panel data, IV, OLS or RDD). In our last variable, we separate coefficients produced from samples of unicameral or bicameral systems, and code studies that analyse multiple polities with different institutional designs as ‘mixed’.
Table 3 presents the meta-regression results for our restricted and extended samples. Each of the first three columns represents one of the three measures of public spending we discuss in this article, and the last one uses all coefficients. To reduce the risk of false positives in our analyses, we use permutation tests to calculate significance levels for the meta-regressions (Higgins and Thompson Reference Higgins and Thompson2004). To interpret these results, the sign of coefficients matters the most. These meta-regression coefficients can be viewed as representing ‘the effect of the moderator on the 1/n effect’. This means that positive coefficients predict a strengthening of the 1/n effect and negative ones predict that it will get weaker under that moderator category, when compared to its reference category. Since we aggregate different types of independent variables under the same models, the size of the effects does not accurately translate the scale of variations.
Meta-regression results

Notes: The restricted and extended samples include 45 and 162 study coefficients, respectively. We report the results from the permutation tests. Reference categories: independent variable = upper house size; Published = no; Method = OLS; Inst. design = bicameral. Significance codes: ***p < 0.01; **p < 0.05; *p < 0.10. Blank cells mean that there is not sufficient data to estimate the parameter.
The first two models show the results for public expenditure per capita. No variable reaches conventional levels of statistical significance in the restricted sample. In the extended sample, we find that models that use lower chamber size as an independent variable have lower effects when compared to those that use upper chamber size. This suggests that an additional member in the lower house has a smaller impact on public spending than a member in the upper house. Moreover, the results for the extended sample point out that recent studies find larger effects than older ones.
The third and fourth columns use the natural logarithm of expenditure per capita as the dependent variable. Among the coefficients in the restricted sample, those in published articles tend to be smaller than those in working papers.Footnote 7 Two other moderators are negatively associated with the outcome in our larger coefficient pool. They both refer to estimation methods. Studies that employ panel/fixed-effects models or RDDs have lower coefficients for log expenditure per capita if we take OLS as the reference category.
Three estimates are statistically significant in the third set of meta-regressions, which include public expenditure as a percentage of GDP as the dependent variable. Both in our restricted and in our extended samples, recent studies have smaller coefficients than do older studies, which stands in contrast with the first model. Institutional design also affects outcomes. Studies that include both unicameral and bicameral political systems report lower coefficients than do those that analyse bicameral systems exclusively. Non-majoritarian electoral systems have a small, positive effect in our extended sample model, yet the coefficient is only significant at the 10 per cent level.
The last two columns report meta-regressions that aggregate all selected studies. In the restricted sample of coefficients, unicameralism has a positive effect. This result holds for the extended sample as well. When we regress all 162 coefficients, the effects of estimation methods become stronger once again. Panel/fixed-effects models and RDDs both significantly decrease the 1/n effect. IV models follow along these lines. Non-majoritarian electoral systems are also significantly associated with lower levels of public spending, which may be justified because the ‘law of 1/n’ was conceived for majoritarian voting. These latter results, however, do not replicate in the other sets of estimations.
The evidence seems to be sensitive to the methodological design. Our results suggest that the same study samples may produce different outcomes depending on the response variables scholars decide to analyse. The broadest aggregation level presented the most insightful results in dialogue with the literature. An additional legislator in non-majoritarian legislatures does not increase expenditure as much as they would if the system were majoritarian. We are also more likely to witness legislative expenditure growing along with the number of representatives in unicameral legislatures, rather than in bicameral systems. This indicates that while the ‘law of 1/n’ is not generalizable, its predicted effects are stronger when the institutional features of a polity come closer to its original theoretical framework.
Discussion
In this letter, we used meta-analytic methods to assess the generality of the ‘law of 1/n’. Based on a sample of thirty publications, our meta-analyses show that there is no strong evidence that more legislators increase public expenditures. The meta-regressions indicate that methodological considerations have a considerable influence on reported results. In our extended sample, we find that modern inference methods, such as RDDs, IVs and panel data, yield lower coefficients than OLS estimators. The models also indicate that unicameralism favours the 1/n effect. The remaining moderators show no consistent effects.
While the vast literature covering the ‘law of 1/n’ builds important empirical knowledge, we hypothesize that some of the null findings that we present here are due to difficulties in testing important assumptions behind the theory itself. For instance, the theory assumes three types of costs for legislative public goods provision, namely, expenses for the constituency, expenses outside the constituency and externalities. The main issue in assessing their actual impact is that externalities, for example, shifts in the prices of local firms, are extremely hard to measure. Thus, it is very difficult to properly translate the mechanism to empirical data, making it easy to accidentally distort results. Therefore, it should not come as a surprise that slight differences in political features generate highly heterogeneous results.
In this sense, the empirical cases in the literature may not always be the most fortunate testing ground for the ‘law of 1/n’. While we believe that moving beyond the framework of majoritarian districts could produce valuable insights, institutional features that are central to the theory cannot be disregarded. For example, proportional representation (PR) electoral systems allow candidates whose constituents are spread across large territories to provide diffused public goods and win elections. However, geographically targeted service provision is at the very core of the legislative behaviour that produces the ‘law of 1/n’. Thus, scholars should consider the possible implications of these micro-level dynamics when applying the ‘law of 1/n’ logic to different settings.
Another plausible reason why there is no clear-cut evidence in favour or against the ‘law of 1/n’ may be that there are few incentives for the pure accumulation of knowledge in the social sciences, at least when compared to the benefits scholars may accrue when they challenge or add features to existing theories (Geddes Reference Geddes2003). This leads to a reduced number of replication studies and research syntheses in the field, though we have seen some positive changes in this respect, such as Evidence in Governance and Politics (EGAP)'s Metaketa Initiative.Footnote 8 Here, we show that meta-analyses provide a viable path towards knowledge building in our discipline. Although aggregating observational – instead of experimental – data can be especially challenging, we believe that research-synthesis methods play an essential role in advancing our understanding of complex political phenomena.
Our analyses suggest other avenues for further research. First, our study sample did not include articles that evaluate the association between the natural logarithm of lower chamber size and public expenditure per capita, or between upper house size and log expenditure per capita. New work on that area might clarify some of the inconsistencies we find here. Secondly, despite the inclusion of several moderators in our models, aggregate results still show considerable heterogeneity. Domestic factors, such as party dynamics or gerrymandering (Gilligan and Matsusaka Reference Gilligan and Matsusaka2006; Lee Reference Lee2015; Mukherjee Reference Mukherjee2003), may prove useful in explaining those divergent results. Thirdly, authors should leverage natural and quasi-experiments to assess whether the current results hold when systematically tested. Fortunately, this may also be a trend under way, as all four studies using RDDs in our sample were published within less than ten years prior to this meta-analysis. These suggestions may help scholars to validate the robustness of their findings and policy makers to reach an optimal balance between sound fiscal policy and the demands for increased political representation.
Supplementary Material
Online appendices are available at: https://doi.org/10.1017/S0007123422000552
Data Availability Statement
Replication data for this article can be found at: https://doi.org/10.7910/DVN/5DEGYP Replication materials are also available at: https://github.com/danilofreire/legislature-size-meta-analysis
Acknowledgements
The authors thank Guilherme Duarte, Cathy Hafer, Robert Myles McDonnell, David Skarbek and Howard Rosenthal for their constructive feedback. We also thank Cedric Antunes, Luis Castro, Giovanna França, Julia Oriente and Lucas Mingardi for their excellent research assistance.
Author Contributions
Freire, Mignozzetti and Roman contributed equally to all parts of the manuscript. Alptekin helped collect data in the early stages of the project.
Financial Support
We kindly acknowledge funding from the São Paulo State Science Foundation (FAPESP), Grant Number 2018/00646-1.
Competing Interests
None.