


Introduction
Youth’s underrepresentation in politics is a feature of nearly all democracies (and autocracies) across the globe. Compared to their presence in the voting age population, young adults aged 30, 35, or 40 years or under face severe underrepresentation in parliaments at all levels across the world (i.e., at the national level, the age group 35 or under makes up around 10 percent of national Members of Parliament, and 30 percent of the voting age population (e.g., Inter-Parliamentary Union, 2023). Normatively, this underrepresentation is problematic. It goes against the principle of representative democracy, where ideally all members have equal chances to participate in the decision-making process, decreases the legitimacy of the political systems, and goes against the idea of intergenerational justice (Scharpf, Reference Scharpf2009; Mansbridge, Reference Mansbridge2011). More practically, it feeds into a cycle of youth political apathy, which is characterized by youth’s low political interest in conventional politics and their decreased participation in elections, political parties, and campaigns (Stockemer and Sundstrom, Reference Stockemer and Sundström2018, Reference Stockemer and Sundstrom2022).
More empirically, the literature has started unpacking the reasons for youth’s underrepresentation in parliaments, mostly focusing on macro-level institutional features. For example, prior research highlights that young candidates do (slightly) better under a proportional representation system (PR) (which entices parties to diversify their slates), as well as under legal requirements where young adults are allowed to run at 18 years rather than a higher age (which allows young adults to run early and also sends a picture that they are welcome in politics) (Joshi, Reference Joshi2013; Krook and Nugent, Reference Krook and Nugent2018; Belschner and Garcia de Paredes, Reference Belschner and Garcia de Paredes2021). Yet, these institutional features can mitigate but not resolve youth’s underrepresentation in political office. In countries with PR and legal age requirements set at 18 years, youth are still underrepresented at various levels of government. The empirical referent of this article, Germany, is a prototypical country, which, despite having a PR or a mixed proportional system, sees youth disadvantaged in politics. To illustrate, over the past decades, youth aged 35 years or under have averaged around 10 percent of members in the German Bundestag, and less than 5 percent in cabinets (Stockemer and Sundstrom, Reference Sundström and Stockemer2021; Stockemer et al., Reference Stockemer, Thompson and Sundström2023). At the legislative level (both national and subnational), we know that youth’s underrepresentation stems to a large degree from a lack of young candidacies (Stockemer and Sunstrom, Reference Stockemer and Sundström2025). Two reasons might account for youth’s lack of candidacies.
First, young people might be hesitant to run because they might not have the interest, ambition, or resources to stage a successful campaign (Lawless and Fox, Reference Lawless and Fox2015). Second, youth might not get the necessary support within political parties to run a successful campaign. Recent literature has particularly started to look at the role political parties play in placing (young) candidates, albeit with mixed results. For example, focusing on Canadian national elections, Stockemer et al. (Reference Stockemer, Gallant and Tolley2024b) find that once young adults have secured candidate status, their likelihood of being nominated to a competitive seat and of winning the election is on par with that of older candidates. Contradicting this assessment and using France as a case, Gélix and Chassé (Reference Gélix and Chassé2024) find support for the so-called “sacrificial lamb theory,” which states that youth (in particular, young women) get nominated to districts with little chance of winning. Other party-level analyses focus on the role of youth wings and the presence of young members in political parties, illustrating that in countries with strong youth wings such as Denmark or Sweden, youth can get the necessary support to stage successful bids (Bolin, Reference Bolin2025). In contrast, in countries with weak youth wings (e.g., Portugal), youth struggle more to get candidate status and get elected to parliament (Jalali et al., Reference Jalali, Silva and Costa2025).
In this research, we add a third layer to the discussion on youth’s underrepresentation in elected assemblies, namely, the level of voters. Are voters more likely to choose older candidates? Is youth’s potential disadvantage in the electoral process a question of parties putting youth on less beneficial list positions or voters’ unwillingness to vote for young people?
We answer these questions using data from the German local elections between 2019 and 2024, which provide a perfect laboratory to examine the electoral chances of young candidates. Held under an open list proportional system in most municipalities, voters can vote for the candidates of their choice and thus determine who gets elected. Using a random selection of 100 municipalities with 6404 candidates, we find that young candidates are disadvantaged on three fronts; they are underrepresented in the candidate pool, they are disadvantaged when it comes to top list positions, and they are less likely to be chosen by voters if they occupy top list positions, even if the final two types of discrimination are only moderate.
This article proceeds as follows: in the next section, we will situate this study within the literature on youth representation. Afterward, we will present the case, data, and methods. Fourth and fifth, we will discuss the results and situate them within the literature on youth representation.
Existing literature
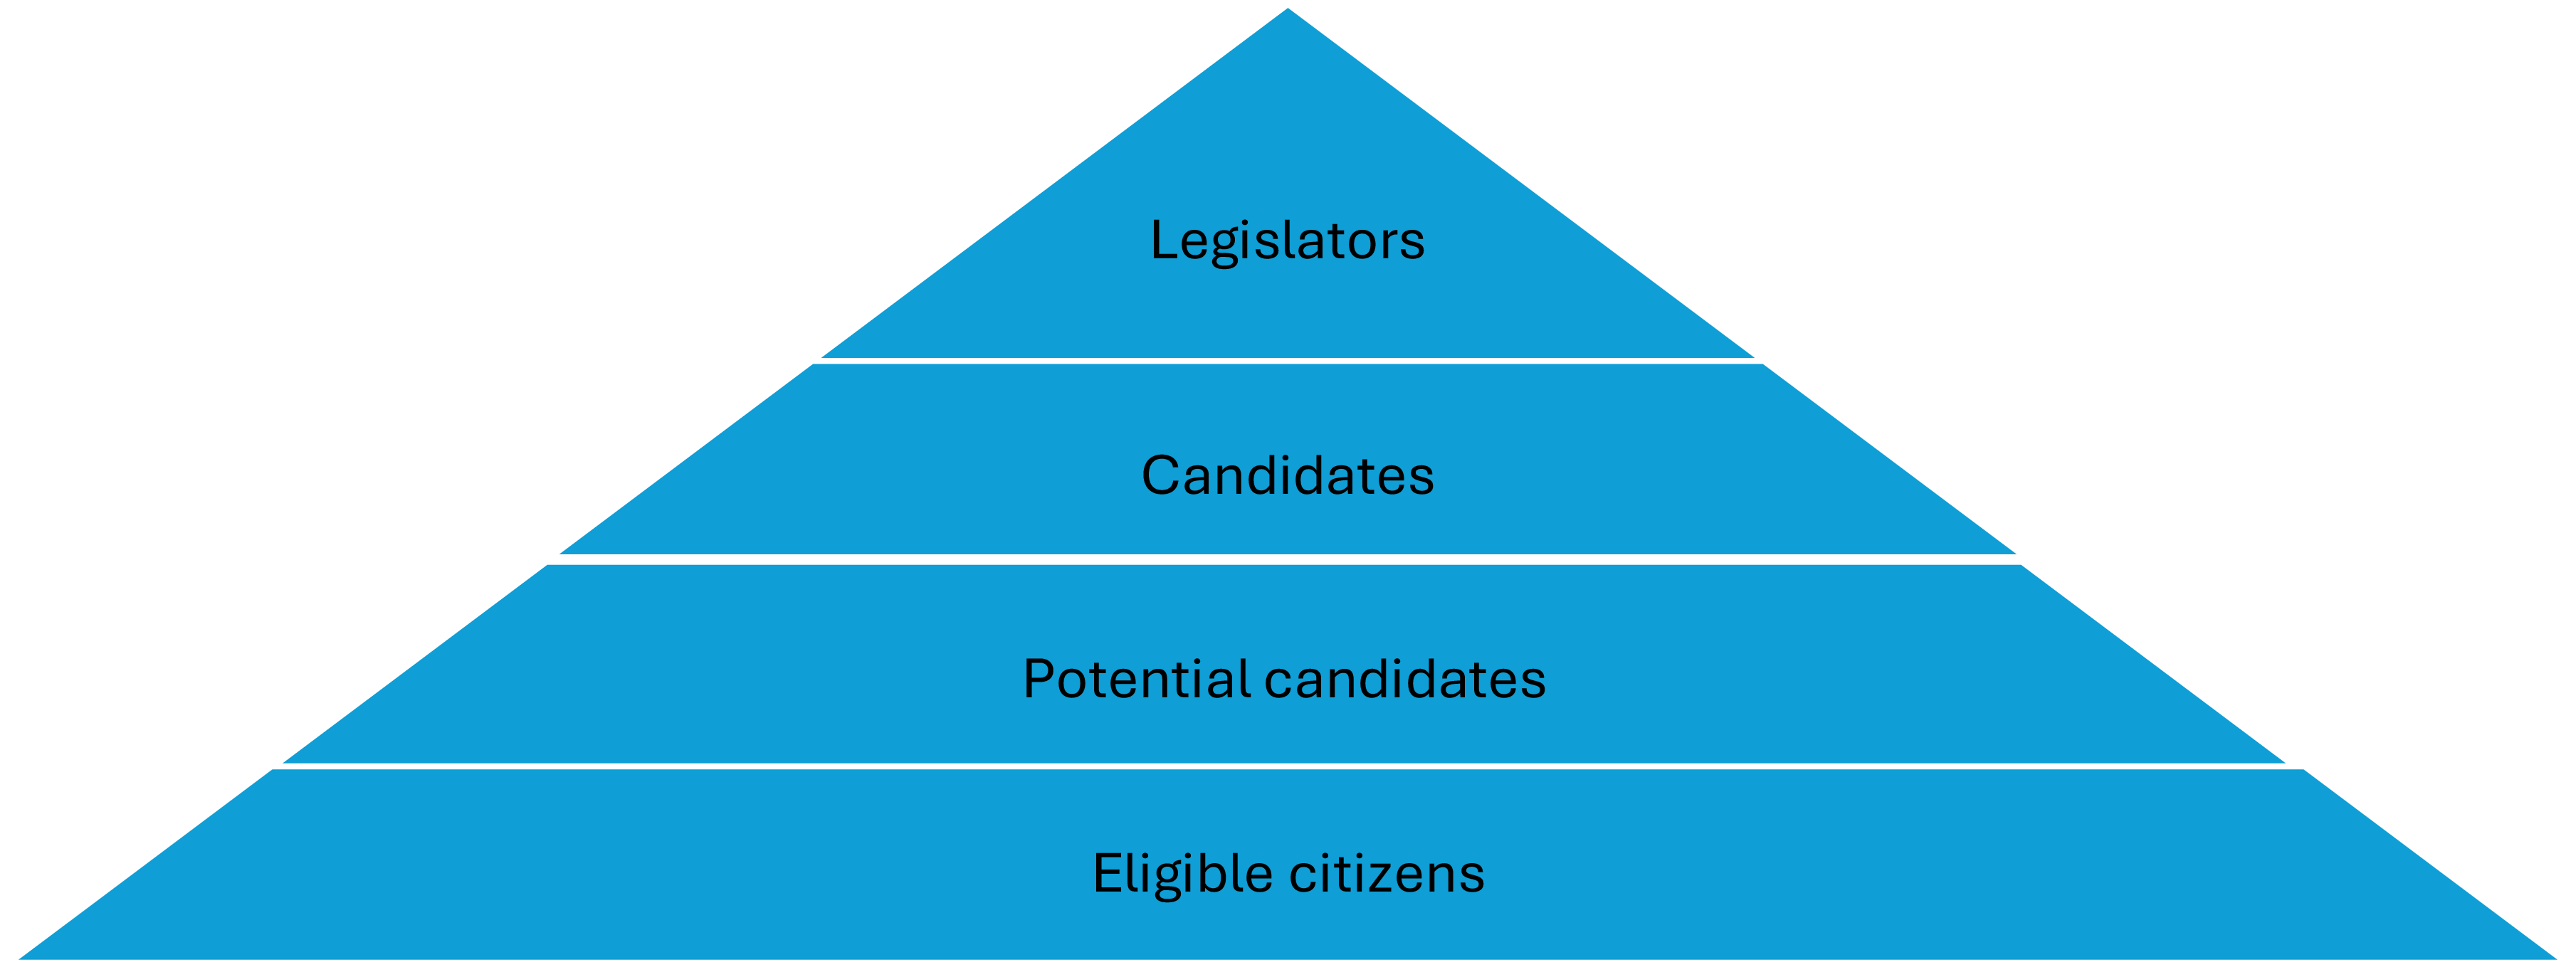
To situate this study theoretically, we borrow from the women and politics literature and discuss youth’s underrepresentation within a slightly modified version of the so-called ladder of recruitment (see Norris and Lovenduski, Reference Norris and Lovenduski1995; Lovenduski, Reference Lovenduski2016). In its traditional form, the ladder of recruitment consists of four steps, with diminishing returns for young aspirants at every step. At the bottom of the ladder are eligible citizens, second are potential candidates, third are selected candidates, and at the top are elected legislators (see Figure 1). Eligible citizens are all those who are allowed to vote and run for office.Footnote 1 Depending on our definition of youth, which fluctuates in the literature between everyone above the age of 18 years and under the age of 30, 35, 40, or 45 years, respectively, the percentage of eligible young citizens should fluctuate somewhere between 25 and 50 percent for most Western countries. If we take the most applied benchmarks in the literature (i.e., young adults aged 18 years to 35 years or 40 years, respectively), the age group 35 years and less makes up roughly 29 percent of the voting age population in Germany. Yet not everyone in the age group 35 years or under is interested in running. We know that many youths have turned their back on conventional politics. Of all age groups, young adults participate the least in conventional politics, they are the least active in political parties, and the least ambitious to run (Lawless and Fox, Reference Lawless and Fox2015). Hence, we expect that only a very small percentage of the age cohort 35 years or under might be willing to run. Therefore, we likely see a large drop from eligible citizens to potential candidates (Rossteutscher et al., Reference Rossteutscher, Faas, Leininger and Schäfer2022).
The ladder of political recruitment.

Yet not everyone interested in and willing to run will become a candidate, and we will likely see a further drop in the number of young candidates compared to potential candidates. Generally, to become a candidate, aspirants need to be a party member and get party endorsement. In addition to the potentially lower supply of candidates, there is evidence that parties systematically avoid nominating young candidates (Kurz and Ettensberger, Reference Kurz and Ettensperger2024). There is a culture in parties of all ideological backgrounds that young people must “wait their turn” or “serve their time” before becoming viable candidates for political office (Magni-Berton and Panel, Reference Magni-Berton and Panel2021). The underrepresentation of young adults in the candidate pool is thus one of the main reasons for youth’s underrepresentation. Yet, youth’s lack of representation might not solely be a characteristic of them not featuring in the candidate pool; youth might also face disadvantages in the electoral arena. In a plurality system, they might be systematically nominated to districts where the party has little chance of winning. In PR systems, they might be placed on list positions that have less of a chance to make the cut-off for a successful election bid (Joshi, 2013; Reference Joshi2015). Using the German local elections as a case, we evaluate the degree to which youth are disadvantaged in list placement and during the voting process. Thus, our analysis situates itself at the intersection between being a candidate and getting elected. Focusing on potential party-level discrimination and voting, we can get a clearer picture of whether youth’s underrepresentation beyond a lack of candidacies is more a question of supply (i.e., parties do not supply enough young candidates on competitive list positions), or demand, which would imply that voters prefer older candidates.
So far, we only have indirect evidence of why voters could prefer older candidates. The ideal of affinity voting holds that voters prefer candidates who share some of the same characteristics as they do. According to Sigelman and Sigelman (Reference Sigelman and Sigelman1982), one of the most important characteristics that voters use when casting their ballot is age; younger citizens have a preference to vote for younger candidates, and older citizens prefer older candidates (see also Loewen, Reference Loewen2010). There is also some recent empirical evidence in support of affinity voting (see Sevi, Reference Sevi2021; McClean and Ono, Reference McClean and Ono2024). Webster and Pierce (Reference Webster and Pierce2019, 635) summarize this finding as follows: “Members of the electorate prefer to vote for co-partisan candidates who are closest to themselves in age.” If we then consider that the turnout gap between younger cohorts and older cohorts of the population often reaches 20–30 percentage points (Achen and Wang, Reference Achen and Wang2019; Grasso, Reference Grasso2014), it will come as no surprise if voters in the aggregate prefer older candidates. Survey research also indicates that there might be some indirect bias in favor of older candidates due to the value of experience, incumbency, and name recognition (Stockemer and Sundstrom, Reference Stockemer and Sundström2025). However, experimental evidence does not necessarily support the notion that voters, in the aggregate, prefer older politicians. Rather, few studies report various effects. For instance, Eshima and Smith’s meta-analysis (Reference Eshima and Smith2022) of 16 conjoint design-based candidate-choice experiments finds that voters prefer younger candidates. In contrast, Roberts and Wolak’s (Reference Roberts and Wolak2023) study on the US voter cannot detect a clear preference based on age. Finally, Lees and Praino (Reference Lees and Praino2024) find in their experiment with Australian voters that voters of all ages tend to favor older candidates.
To get some more robust evidence if potential disadvantages for youth in the electoral process are more a question of parties relegating them to uncompetitive list positions or voters preferring older candidates, we look at the German local elections, which provide a propitious laboratory to delve into this topic. In most federal states, these elections are held under a proportional representation system with the so-called free lists. Under this system, municipal councils have between 8 and 60 seats relative to the size of the municipality, and each party can nominate as many candidates as there are seats in the council. There are two types of free list systems. Under the first type, which is practiced in Bavaria or Baden-Württemberg, among other states, voters have as many votes as there are seats, and there is no electoral threshold (van der Kolk, Reference Van der Kolk2007). In the voting booth, they can choose either to vote for a complete list (which implies that each candidate on the list gets one vote), or they can distribute their votes across and within parties by giving up to three votes to candidates of their choice. Under the second type, voters have 3–5 votes, which they can distribute to candidates of their choice. In both systems, the votes are first aggregated by party lists to determine how many seats each party gets. The seats are then distributed to the candidates with the most votes on the list regardless of their prior list placement (Graeb and Vetter, Reference Graeb and Vetter2026). In the third type, which is strongly minoritarian, there is list proportional representation.
The German electoral arrangement is perfect for the purpose of our study. In such a system, the list placement is still important, as higher list positions increase candidates’ chances of being elected, because parties put their top contenders on top list positions and voters tend to choose more highly ranked candidates.Footnote 2 Nevertheless, the openness of this system to change the list order and the possibility for voters to vote for individuals across party lines allow us to evaluate the age factor in citizens’ vote choice rather conclusively. Not only can we determine the likelihood of people of different ages getting elected, but we can also compare the list placement of a candidate before and after the election. In other words, we can check if a candidate is voted up or down the list from its initial placement. More concretely, we can conclude that voters punish younger candidates if those younger candidates lose one or several list positions from before to after the election. Vice versa, voters will likely prefer younger candidates if those younger candidates systematically gain list positions after the election.
Research design
To examine the electoral fortunes of young candidates, we constructed a novel dataset using publicly available municipal election data. To do so, we first selected a random sample of 100 cities and municipalities as our unit of analysis. Data collection involved retrieving candidate lists (including age, gender, list placement) and election results from official municipal websites, where available. Due to the personal nature of some data, complete election results and candidate lists were not available online for most municipalities. We supplemented the missing data using archived websites and by directly contacting municipalities. To ensure a systematic approach, we contacted each municipality up to three times. If data remained unavailable after the third attempt, we replaced the municipality with another randomly selected one. In total, we contacted nearly 400 municipalities to achieve a final sample of 100 municipal elections. This implies that our success rate was 25 percent in soliciting municipal voting data.
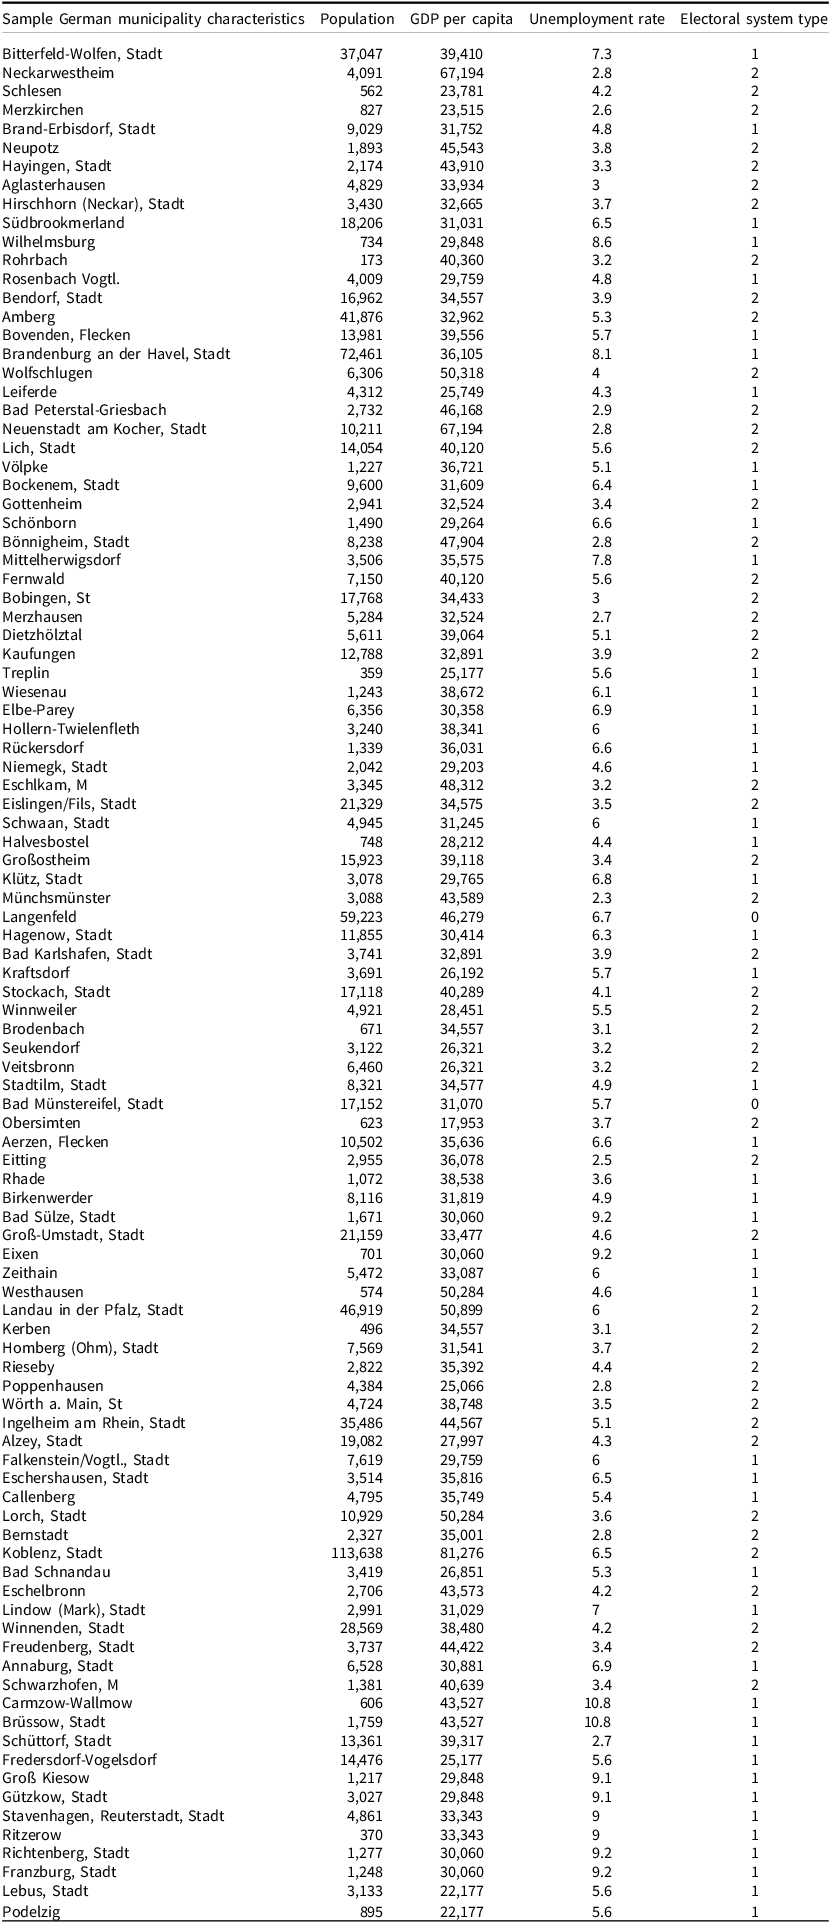
The dataset covers election data from 12 of Germany’s 16 federal states, excluding the city-states of Berlin, Bremen, and Hamburg, as well as Saarland. Municipalities in these four states did not feature in our random draw. Considering that the timing of the election is different for most federal states, the municipal election period for this dataset spans from 2019 to 2024. Table A1, in the Appendix below, provides information on the population, GDP per capita, unemployment rate, and the electoral system for either the municipality or the administrative district the respective municipality is part of.
Before testing the link between the age of candidates and their electoral fortunes, we need to define what we consider a young politician. While there is agreement on the lower threshold, which is normally 18 years, possible definitions for the upper threshold range from 30 years to 45 years. In this study, we employ the two most frequently used definitions, namely, individuals aged 35 or 40 years or under, respectively (Norris, Reference Norris1997; Joshi, Reference Joshi2013; Reference Joshi2015; Stockemer et al., Reference Stockemer, Gallant, Lewis, Deom and Lam2024a, Reference Stockemer, Gallant and Tolleyb). As a point of comparison, we also display the electoral chances of adults aged 41 to 60 (which, in our definition, comprises middle-aged individuals), as well as adults aged 61 or older (which we label the elderly). We also present figures of the average age and/or use age as a continuous variable in some of the multivariate models that follow.
A second variable that merits some discussion is the electoral system type. In our sample, as well as for Germany as a whole, there are three variants of proportional representation. A small minority of our sample (i.e., a few municipalities in North Rhine-Westphalia), which make up less than 3 percent of the total sample, use closed PR. Most municipalities (e.g., in Baden-Württemberg, Bavaria, or Hesse) (i.e., 64 percent) use open list proportional systems in which voters have as many votes as there are seats. A third group of municipalities (33 percent) uses open list proportional representation by allowing voters to distribute 3–5 votes.
To determine the magnitude of youth’s electoral disadvantage, we suggest a two-step approach. In the first step, we evaluate the chances of candidates of various ages getting elected both descriptively and inferentially. Descriptively, we do so by providing average age statistics for all candidates, elected candidates, and unelected candidates based on their age. Because the chances of getting elected are not the same across all list positions but rather fluctuate based on someone’s list placement, with candidates being placed high up the list having higher chances, we also present descriptive age statistics for candidates placed in the top four list positions before the election. We have chosen the cut-off point of four because, on average, 3.92 candidates get elected, and roughly 62 percent in the top 4 list positions make it to parliament (compared to less than 17 percent for individuals placed 5 or higher on their lists). Inferentially, we run binary logistic regression analysis featuring the dummy variable elected and non-elected as the dependent variable and age, as well as our various operationalizations for the young, as the independent variable. We control for incumbency, which is highly correlated with age. Especially on top list positions, the majority of middle-aged and senior candidates are incumbents. The same does not apply for youth. We also control for gender, a logarithmic transformation of a municipality’s population, and the electoral system type. In addition, we control for the party affiliation of the candidate and the year of the election (see Table A2 for some descriptive statistics on all variables).
In a second step, we evaluate the degree to which youth’s electoral disadvantage stems from candidates being placed in lower list positions or from voter preferences for older candidates. To do so, we first create some descriptive statistics, where we display the candidates’ list placement before and after the election across our age measures. We do so for all candidates and for candidates initially placed in the top four list positions. In addition, we create a dependent variable, which we label list position change, which measures the change in list position from before to after the election. For example, a candidate, whose initial list position was six and who ends up in position four after the election, gets a ranking of +2 because voters have voted her up two positions. Vice versa, a candidate who initially occupied list position six and gets voted down two positions gets a ranking of −2, because she loses two positions. We exclude from this analysis the 3 percent of our municipalities that operate under closed-list PR. We then use this list change variable in multiple regression models (Ordinary Least Squares (OLS) models) featuring all candidates and the top four contenders as the dependent variables, respectively. Our independent variables are the same as those in the first set of models. Because of the high correlation between incumbency and any of the age proxy variables, we run all regression analyses with and without the incumbency control variable.
Results
For and utmost, Table 1 confirms youth’s underrepresentation in local parliaments. In fact, youth’s underrepresentation is very similar at the national level. The average age of municipal councilors in our random sample of 100 municipalities is 52.2 years old (which is slightly older than the long-term average age in the German Bundestag, which fluctuates around 50 years). Table 1 further illustrates that the age of all candidates is only moderately lower (i.e., 51.1 years). The age gap between elected and unelected candidates is a moderate 1.5 points. Some descriptive statistics confirm that there is a lack of youth candidacies. Even though the age group 18 to 35 years old comprises roughly 25 percent of the German voting age populationFootnote 3, this age cohort only features at 16.6 percent in the candidate pool for those 35 years or under. The age group 18–40 comprises 25.9 percent in the candidate pool and 33 percent of the voting age population. If we look at the age group 41–60, this age group makes up over 45 percent in the candidate pool, but only roughly one-third of the voting age population. The age group 61 years or older makes up 28.5 percent of the candidates, which is nearly double that of the age group 35 years or younger.
Age statistics across candidates and elected candidates

Table 1 Long description
A table comparing age statistics across candidates and elected candidates. The table has 3 rows and 5 columns. The columns are labeled Average age (years), 35 years or under (percent), 40 years or under (percent), 41 to 60 years (percent), and 61 years or older (percent). The row labels are All candidates, Elected candidates, and Not elected candidates. Row 1: All candidates, 51.12, 16.57, 25.89, 45.58, 28.53. Row 2: Elected candidates, 52.22, 11.43, 20.28, 50.61, 29.12. Row 3: Not elected candidates, 50.66, 18.72, 28.24, 43.48, 28.28.
Note: An Independent T-test reveals that for each of the five age proxies, the difference between elected and non-elected candidates is statistically significant for all groups except for the age group 61 years or older.
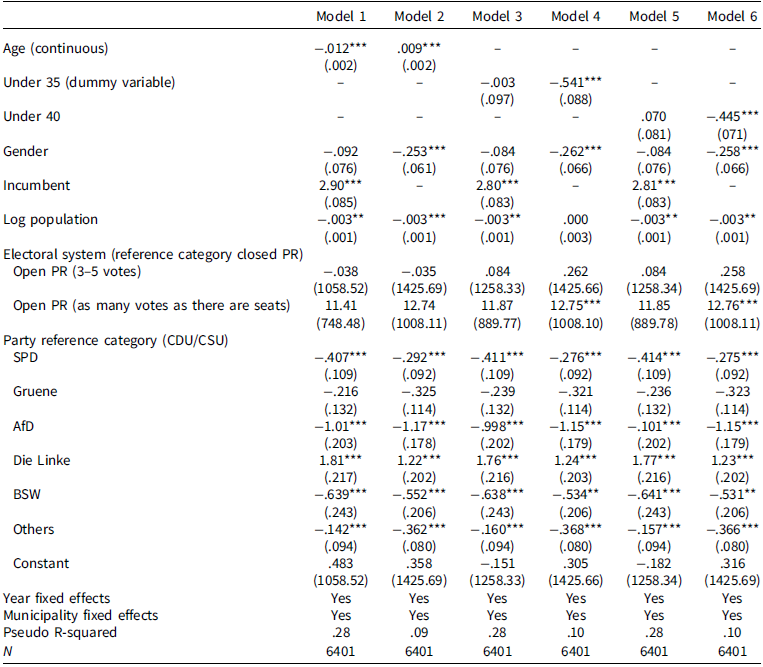
If we look at the multivariate regression models (see Table 2), we get a nuanced picture. Model 2 confirms that age displays a positive and statistically significant relationship between age and candidates’ lower chances of election if we do not control for incumbency (see Model 2 in Table 3).Footnote 4 Models 4 and 6 also display a negative and statistically significant association between our dummy variables, 35 years or under and 40 years or under, respectively, and candidates’ election prospects. However, if we control for incumbency, this effect disappears for the age cohorts 35 years or under, as well as 40 years or under (see Models 3 and 5, Table 3).
Multiple logistic regression models measuring the influence of age on someone’s election chances

Table 2 Long description
The table presents six logistic regression models analyzing the influence of age on election chances. It includes columns for Model 1 through Model 6, each with various predictors such as Age, Under 35, Under 40, Gender, Incumbent, Log population, Electoral system, and Party reference category. Each model shows coefficients and standard errors for these predictors. Notable trends include the significant negative relationship between age and election chances in Model 2, and the negative association between the dummy variables for age cohorts under 35 and under 40 with election prospects in Models 4 and 6. Controlling for incumbency in Models 3 and 5 shows that this effect disappears for these age cohorts.
Notes: Standard errors in parentheses. Significance: * p < 0.1; ** p < 0.05; *** p < 0.01 (two-tailed).
Age statistics across top-ranked candidates (i.e., candidates listed at list position four or higher)

Table 3 Long description
A table comparing age statistics across top-ranked candidates. The table has four rows and six columns. The columns are labeled Average age (years), 35 years or under (%), 40 years or under (%), 41 to 60 years (%), and 61 years or older (%). The rows are labeled All candidates, Elected candidates, and Not elected candidates. Row 1: All candidates, 52.22, 12.06, 20.71, 49.98, 29.21. Row 2: Elected candidates, 53.23, 9.00, 17.56, 51.78, 30.66. Row 3: Not elected candidates, 50.52, 17.19, 26.01, 46.94, 27.06.
Note: An Independent T-test reveals that for each of the five age proxies, the difference between elected and non-elected candidates is statistically significant for all groups except for the age group 61 years or older.
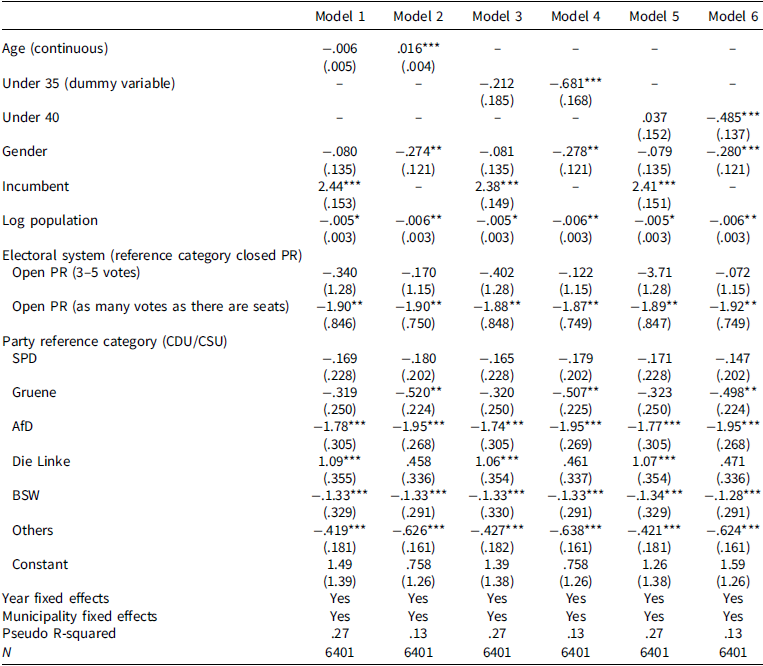
Table 3 looks at the nomination of candidates and illustrates some age discrepancies when it comes to the nomination of young candidates to the top four list positions. The average age for these top positions is 53, which is one year older than for all positions. We also see fewer young candidates nominated to these top positions. While the age group, 35 years or younger, makes up nearly 17 percent of the candidate pool, it only makes up 12 percent among the top four contenders. For the group, 40 years or younger, the percentage of candidates drops from 26 to 21 percent from all candidates to the top four candidates. The multivariate regression models (see Table 4) confirm that age is negatively related to young adults’ chances of being elected if we exclude the incumbency control. If we control for incumbency, the effect becomes insignificant.
Multiple logistic regression models measuring the influence of age on someone’s election chances for candidates at the top four list positions

Table 4 Long description
A table comparing the influence of age on election chances for candidates in top four list positions. The table has six models with various factors. Each model includes columns for Age, Under 35, Under 40, Gender, Incumbent, Log population, Electoral system, and Party reference category. Row 1: Age (continuous), Model 1: -0.006 (0.005), Model 2: 0.016*** (0.004), Model 3: (not applicable), Model 4: (not applicable), Model 5: (not applicable), Model 6: (not applicable). Row 2: Under 35 (dummy variable), Model 1: (not applicable), Model 2: (not applicable), Model 3: -0.212 (0.185), Model 4: -0.681*** (0.168), Model 5: (not applicable), Model 6: (not applicable). Row 3: Under 40, Model 1: (not applicable), Model 2: (not applicable), Model 3: (not applicable), Model 4: (not applicable), Model 5: 0.037 (0.152), Model 6: -0.485** (0.137). Row 4: Gender, Model 1: -0.080 (0.135), Model 2: -0.274** (0.121), Model 3: -0.081 (0.135), Model 4: -0.278** (0.121), Model 5: -0.079 (0.135), Model 6: -0.280** (0.121). Row 5: Incumbent, Model 1: 2.44*** (0.153), Model 2: (not applicable), Model 3: 2.38*** (0.149), Model 4: (not applicable), Model 5: 2.41*** (0.151), Model 6: (not applicable). Row 6: Log population, Model 1: -0.005* (0.003), Model 2: -0.006** (0.003), Model 3: -0.005* (0.003), Model 4: -0.006** (0.003), Model 5: -0.005* (0.003), Model 6: -0.006** (0.003). Row 7: Electoral system (reference category closed PR), Open PR (3-5 votes), Model 1: -0.340 (1.28), Model 2: -0.170 (1.15), Model 3: -0.402 (1.28), Model 4: -0.122 (1.15), Model 5: -3.71 (1.28), Model 6: -0.072 (1.15). Row 8: Open PR (as many votes as there are seats), Model 1: -1.90** (0.846), Model 2: -1.90** (0.750), Model 3: -1.88** (0.848), Model 4: -1.87** (0.749), Model 5: -1.89** (0.847), Model 6: -1.92** (0.749). Row 9: Party reference category (CDU/CSU), SPD, Model 1: -0.169 (0.228), Model 2: -0.180 (0.202), Model 3: -0.165 (0.228), Model 4: -0.179 (0.202), Model 5: -0.171 (0.228), Model 6: -0.147 (0.202). Row 10: Gruene, Model 1: -0.319 (0.250), Model 2: -0.520** (0.224), Model 3: -0.320 (0.250), Model 4: -0.507** (0.225), Model 5: -0.323 (0.250), Model 6: -0.498** (0.224). Row 11: AfD, Model 1: -1.78*** (0.305), Model 2: -1.95*** (0.268), Model 3: -1.74*** (0.305), Model 4: -1.95*** (0.269), Model 5: -1.77*** (0.305), Model 6: -1.95*** (0.268). Row 12: Die Linke, Model 1: 1.09*** (0.355), Model 2: 0.458 (0.336), Model 3: 1.06*** (0.354), Model 4: 0.461 (0.337), Model 5: 1.07*** (0.354), Model 6: 0.471 (0.336). Row 13: BSW, Model 1: -1.33*** (0.329), Model 2: -1.33*** (0.291), Model 3: -1.33*** (0.330), Model 4: -1.33*** (0.291), Model 5: -1.34*** (0.329), Model 6: -1.28*** (0.291). Row 14: Others, Model 1: -0.419*** (0.181), Model 2: -0.626*** (0.161), Model 3: -0.427*** (0.182), Model 4: -0.638*** (0.161), Model 5: -0.421*** (0.181), Model 6: -0.624*** (0.161). Row 15: Constant, Model 1: 1.49 (1.39), Model 2: 0.758 (1.26), Model 3: 1.39 (1.38), Model 4: 0.758 (1.26), Model 5: 1.26 (1.38), Model 6: 1.59 (1.26). Row 16: Year fixed effects, Model 1: Yes, Model 2: Yes, Model 3: Yes, Model 4: Yes, Model 5: Yes, Model 6: Yes. Row 17: Municipality fixed effects, Model 1: Yes, Model 2: Yes, Model 3: Yes, Model 4: Yes, Model 5: Yes, Model 6: Yes. Row 18: Pseudo R-squared, Model 1: 0.27, Model 2: 0.13, Model 3: 0.27, Model 4: 0.13, Model 5: 0.27, Model 6: 0.13. Row 19: N, Model 1: 6401, Model 2: 6401, Model 3: 6401, Model 4: 6401, Model 5: 6401, Model 6: 6401.
Notes: Standard errors in parentheses. Significance: * p < .1; ** p < .05; *** p < .01 (two-tailed).
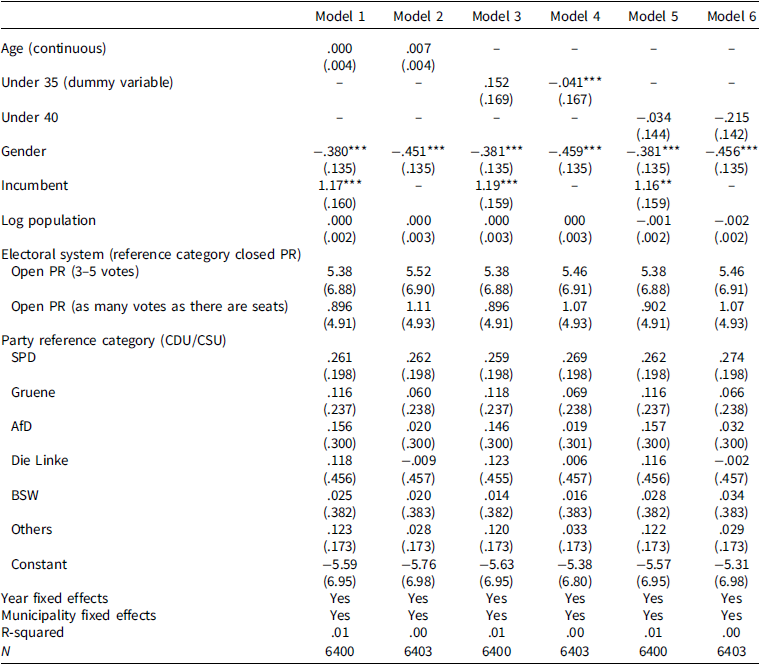
While Table 3 confirms that there is a lack of supply of young candidates, especially in top list positions, the table also alludes to a potential small electoral disadvantage, considering that there is a small drop in the percentage of young candidates compared to the percentage of young councilors (i.e., the percentage of young politicians aged 35 or under in the candidate pool is 12 percent in the candidate pool and only 9 percent for councilors; for the age group 40 years or younger, the respective percentages are 21 versus 18 percent). Hence, it appears from Table 3 that youth do not have the same election chances compared to the age groups 41–60 years and 61 years or older. If we look at the change in list placement from before to after the election, we see little variation if we consider the sample of all candidates. For example, if we look at Table 5, we do not find support for an electoral disadvantage across the board, considering that the average list placement after the election mimics the list placement before the election. In the multivariate realm, we also do not find any significant association between any of the age proxies and someone’s change in list position from before to after the election (see Table 6).
List placement before and after the election

Table 5 Long description
The table has five rows and five columns. The columns are labeled 'Average list placement', '35 years or under', '40 years or under', '41 to 60 years', and '61 years or older'. The rows are labeled 'List placement before', 'List placement after', and 'List placement change'. Row 1: Average list placement, 35 years or under, 10.95; 40 years or under, 11.31; 41 to 60 years, 11.13; 61 years or older, 11.96. Row 2: Average list placement, 35 years or under, 10.95; 40 years or under, 11.36; 41 to 60 years, 11.31; 61 years or older, 11.76. Row 3: List placement change, 35 years or under, 0.00; 40 years or under, 0.05; 41 to 60 years, 0.18; 61 years or older, -0.20.
Note: Multiple Comparison Tests (i.e., the Sidak specification) illustrate that adults aged 40 or under, as well as 61 or older, get a significantly higher list placement before and after the elections. Independent samples T-test highlights that the list change is not significant within each age group.
Multiple regression models (OLS) measuring the influence of age on someone’s change in list placement

Table 6 Long description
A table with six columns and twenty rows comparing multiple regression models (OLS) measuring the influence of age on someone's change in list placement. The columns are labeled Model 1, Model 2, Model 3, Model 4, Model 5, and Model 6. The rows include variables such as Age (continuous), Under 35 (dummy variable), Under 40, Gender, Incumbent, Log population, Electoral system (reference category closed PR), Party reference category (CDU/CSU), SPD, Gruene, AfD, Die Linke, BSW, Others, Constant, Year fixed effects, Municipality fixed effects, R-squared, and N. Each cell contains numerical values or descriptive text relevant to the regression models.
Notes: Standard errors in parentheses. Significance: * p < .1; ** p < .05; *** p < .01 (two-tailed).
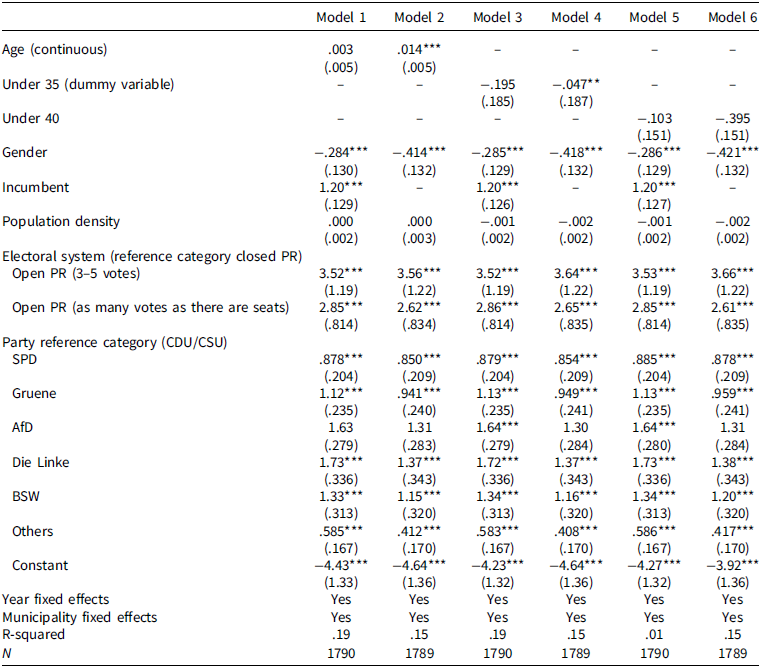
The picture somewhat changes, if we look at Tables 7 and 8, which only focus on the top list positions, which have the highest likelihood of election, we find that young candidates get the lowest placement of all candidates, even if these gaps are only moderate (see Table 7). Probably, even more importantly, young candidates are the ones who get the most voted down. To illustrate, young candidates aged 35 years or younger lose on average 1.5 list positions from before to after the election; this number compares to an average loss of 1.1 and 1.0 list positions for middle-aged and more senior candidates, respectively. The multivariate regression models (see Table 8) confirm that younger candidates have a higher drop in list placement if we exclude the control variable of incumbency (which, as we have mentioned before, is very highly correlated with age).
List placement before and after the election for the top four list placements

Table 7 Long description
A table comparing list placement before and after the election for different age groups. The table has four rows and five columns. The columns are labeled as Average list placement, 35 years or under, 40 years or under, 41 to 60 years, and 61 years or older. The rows are labeled as List placement before, List placement after, and List placement change. Row 1: Average list placement, 2.42, 2.64, 2.53, 2.41, 2.36. Row 2: List placement after, 3.51, 4.10, 3.88, 3.47, 3.29. Row 3: List placement change, -1.09, -1.46, -1.35, -1.06, -0.93.
Note: Multiple Comparison Tests (i.e., the Sidak specification) illustrate that adults aged 40 or under get a significantly lower list placement before and after the elections compared to middle-aged and senior individuals. Independent samples T-tests highlight that the list change is significant within each age group (substantively, it is the highest for individuals aged 35 or 40 years or under).
Multiple regression models (OLS) measuring the influence of age on someone’s change in list placement for candidates at top four list positions

Table 8 Long description
A table with six columns and multiple rows, each column representing a different regression model. The table includes various factors such as Age, Under 35, Under 40, Gender, Incumbent, Population density, Electoral system, and Party reference category. Each row lists the coefficients and standard errors for these factors across the six models. Notable trends include the consistent negative impact of being under 35 or 40 on list placement, and the significant influence of gender and incumbency status. The table also includes year fixed effects, municipality fixed effects, and R-squared values for each model.
Notes: Standard errors in parentheses. Significance: * p < .1; ** p < .05; *** p < .01 (two-tailed).
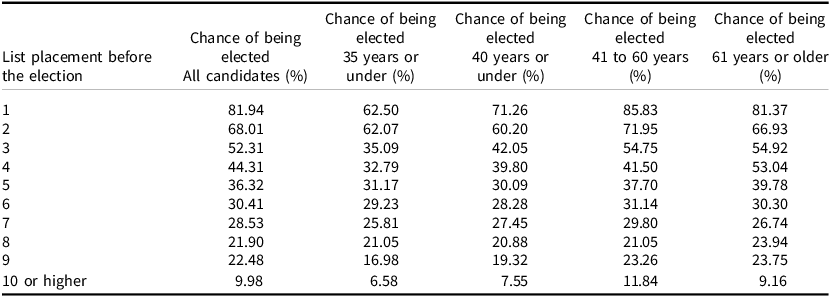
Finally, Table 9 confirms that young candidates placed at the top list positions have a lower probability of getting elected compared to middle-aged and older candidates. To illustrate, candidates aged 35 or younger at the top list positions have a roughly 63 percent chance of being elected. This likelihood increases to over 80 percent for middle-aged or more senior candidates. Table 9 also indicates that for lower list positions, the gap in election prospects narrows. Hence, Table 9 provides additional evidence that voters prefer more senior candidates as their first choice.
Election prospects based on list placement for different age cohorts

Table 9 Long description
The table presents data on the chance of being elected based on list placement before the election and different age cohorts. It has 10 rows and 5 columns. The columns are labeled 'List placement before the election', 'Chance of being elected All candidates (%)', 'Chance of being elected 35 years or under (%)', 'Chance of being elected 40 years or under (%)', 'Chance of being elected 41 to 60 years (%)', and 'Chance of being elected 61 years or older (%)'. Row 1: List placement 1, 81.94, 62.50, 71.26, 85.83, 81.37. Row 2: List placement 2, 68.01, 62.07, 60.20, 71.95, 66.93. Row 3: List placement 3, 52.31, 35.09, 42.05, 54.75, 54.92. Row 4: List placement 4, 44.31, 32.79, 39.80, 41.50, 53.04. Row 5: List placement 5, 36.32, 31.17, 30.09, 37.70, 39.78. Row 6: List placement 6, 30.41, 29.23, 28.28, 31.14, 30.30. Row 7: List placement 7, 28.53, 25.81, 27.45, 29.80, 26.74. Row 8: List placement 8, 21.90, 21.05, 20.88, 21.05, 23.94. Row 9: List placement 9, 22.48, 16.98, 19.32, 23.26, 23.75. Row 10: List placement 10 or higher, 9.98, 6.58, 7.55, 11.84, 9.16.
Altogether, these findings tell us that youth’s underrepresentation at the local level is for and utmost a question of supply. Young candidates do not feature in the candidate pool as prominently as they should, if we take their representation in society as a benchmark. However, the low presence of young municipal councilors does not only stem from a lack of presence of young candidates, but it also stems from some disadvantages in the electoral process. Young candidates feature less among the top list candidates than their more senior colleagues. In addition, it seems that voters are less likely to support young candidates if they are at the top of the list compared to other candidates at the top of the list. For top list positions, the gap in chances of success is sometimes 20 percentage points between young and middle-aged/older candidates. One factor that certainly plays in favor of more senior politicians is the aforementioned incumbency advantage. Contrary to younger candidates, many of the more senior candidates on top list positions are incumbents. In addition to the benefit of being placed high on the list, they have the advantage of higher name recognition and visibility thanks to their presence in the local council. We can probably conclude from this finding that voters per se do not have a lower likelihood of voting for young candidates. However, for top contenders, the higher familiarity with more senior (incumbent) politicians might explain their moderately higher electoral appeal.
The question that arises from this study is how much we can generalize from these findings. On the one hand, the average age of candidates and councilors, as well as the percentage of councilors aged 35 years or under, and also 40 years or under, is comparable to similar figures from the regional or national levels not only in Germany but also elsewhere (see Stockemer and Sundstrom, Reference Stockemer and Sundstrom2022; Kurz and Ettensberger, Reference Kurz and Ettensperger2024). On the other hand, local and national politics differ. Local politics is about building schools, playgrounds, and fixing roads. Name recognition and familiarity might play an even bigger role in these elections compared to national elections. Party affiliation is secondary (in fact, candidates for local elections do not have to be party members to run under a party label), and voters might pick engaged individuals in the communities regardless of party affiliation. In most cases, the type of candidates voters choose is rather senior than junior citizens. Hence, the seniority principle in nominations and voting decisions might play an even larger role at the local level compared to the national level. Hence, parties’ hesitation to nominate youth to top list positions and voters’ (slight) reluctance to vote for young candidates might be less pronounced at higher levels.
There is a related issue to consider. Young candidates to local councils might be a different type of candidate than more senior candidates. For young and ambitious youth, a seat on the local council might be a first step toward a political career; it might be a stepping stone to gain some experience for a higher office. Hence, a seat in the local council might consist of a temporary step in someone’s political career. In contrast, middle-aged and senior council members might be very pleased to work in/for the community and might be motivated to continue, as this job could bring professional fulfillment and a sense of accomplishment for them. Implicitly, this might entail that the incumbency advantage might even be more pronounced at the local level compared to the national one, even more so considering that it is physically not as demanding to serve locally compared to a higher level.
Conclusions
The conclusions to draw from this article are rather sober ones. Youth’s underrepresentation in political office in Germany (and elsewhere as well) is not just a problem at the national level. At least in Germany, it is as much of a characteristic of local parliaments as it is of the Bundestag. To illustrate, at the beginning of the five-year term, the average councilor is 52.2 years old, which implies that at the end of the term, she is over 57 years old. For the age group 35 years or under, we find that at the inauguration, young councilors make up roughly 11 percent of all councilors; by the end of the term, this number drops to less than 5 percent in our sample. We also find that youth’s underrepresentation at the local level in Germany stems to a large degree from the lack of young candidates running. To a smaller degree, it also stems from parties’ hesitation to nominate youth to top list positions and from voters’ reluctance to vote young candidates into top list positions. However, the main reason for this underrepresentation is a lack of young candidates.
More broadly and particularly, when it comes to young people, we also do not find support for the stipulation that second-order elections, such as local elections, enhance the chances of out-groups being elected (Cabeza, Reference Cabeza2018). Even though these are probably the least important elections in Germany, local elections do not trigger a higher share of elected members from this out-group than, for example, national parliamentary elections. This feature also questions the idea that less important elections can be a stepping stone for underrepresented groups to gain experience, which then qualifies them for higher office. At least for youth, we do not see any of these tendencies. The question that remains is: Is the lack of youth candidacies and elected councilors due to a lack of candidates or a deliberate effort by parties to stop young candidates? While we do not have hardcore evidence for either of the two propositions, we believe that it is the latter. Especially for local elections, where candidates do not necessarily need to be party members, it should be possible to find one, two, or three interested young people to run. However, we know from a recent study in Belgium that parties disfavor young candidates at the selection time (see de Smedt and Vandeleen, Reference De Smedt and Vandeleene2025). Despite no strong evidence (see McClean and Ono, Reference McClean and Ono2024), party elites might fear that young candidates are not as electable as older candidates. Also, when senior party elites speak about renewal, they might not mean the rejuvenation of politics.
The policy recommendations from this article are simple ones, even though, in practice, they will most likely not be implemented. If we are serious about our goal to increase youth representation and if we want to alleviate the vicious cycle of youth’s political alienation, which is characterized by their low political representation, their low participation in elections and election-related activities, and their lack of interest in conventional politics (see Stockemer and Sundstrom, Reference Stockemer and Sundström2018, Reference Stockemer and Sundström2019), we need to change course. Concretely, this would imply that parties should increase the number of young candidates not only on their list but also on top list positions. During the election campaign, parties could then also promote these young candidates more strongly so that they can compensate for youth’s electoral disadvantage, which might be, in large part, due to a lack of visibility. However, even if this promotion and change of direction could happen with relatively little costs to parties, given that voters generally prefer older candidates, the chances of this happening are very low. Simply speaking, the nomination of young candidates would imply that some local party elites would need to step aside. History has shown us that this is unlikely to happen (see Magni-Berton and Panel, Reference Magni-Berton and Panel2021). One step in this direction would be the introduction of term limits, which would create more turnover and which would provide younger candidates with more even playing fields. Under term limits, incumbents would have to leave after 2 or 3 terms. Unfortunately, these reforms are not on the horizon, and it is likely that, at least in the short run, youth remain as underrepresented in political office (including the local council) as they are now.
Data availability statement
The authors will share the dataset upon request.
Financial support
Daniel Stockemer acknowledges support from the Konrad Adenauer Foundation through the Konrad Adenauer Research Chair in Empirical Democracy Studies and the Social Sciences and Humanities Research Council of Canada.
Competing interests
The authors have no competing interests to declare.
Ethical standard
The research does not include human participants.
Appendix
Socio-economic data of the municipalities included

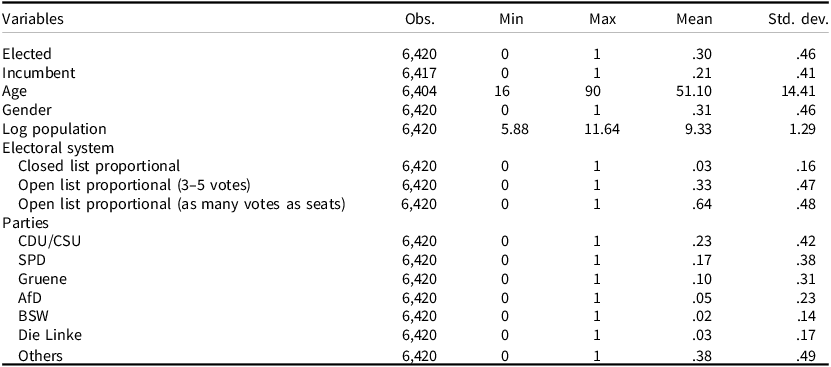
Detailed descriptive statistics of variables included in the study and models

Table A2 Long description
A table with 12 rows and 6 columns. The columns are labeled Variables, Obs., Min, Max, Mean, and Std. dev. The rows list different variables such as Elected, Incumbent, Age, Gender, Log population, Electoral system, and Parties with their respective statistics. Each row provides the observation count, minimum value, maximum value, mean, and standard deviation for each variable. The table includes specific parties like CDU/CSU, SPD, Gruene, AfD, BSW, Die Linke, and Others under the Parties category.





 Open access

