Implications
Irish suckler beef and dairy cattle farmers have strong views on calving difficulty (CD) that reflect direct costs, but also non-economic factors such as animal welfare, and labour constraints related to calving observation and assistance. Dairy farmers in particular are only prepared to accept low CD incidences. Farmer views imply a non-linear relationship between farmer utility and CD incidence level. This non-linear relationship cannot be reflected in a standard linear index weighting, and so industry selection indexes in Ireland should be modified to account for the strong non-linear relationship between bull genetic merit for CD, and farmer utility.
Introduction
CD is one of the most important functional traits, due to its influence on herd profitability and animal welfare. It increases the amount of labour required by farmers, veterinary costs and calf mortality, but also affects cow performance postpartum by reducing milk production, reproductive performance and cow survival (Mee et al., Reference Mee2008; McHugh et al., Reference Nix, Spitzer, Grimes, Burns and Plyler2012). CD rates are rather variable across countries and farms. There are countries with prevalence as low as 2% (across cows and heifers), whereas others have prevalence as high as 13% (Mee, Reference McHugh, Kearney and Berry2008). When considering heifers, the prevalence figures range between 3% and 22%. In Ireland, CD rates in 2014 were 6.1%, 5.4%, 8.0% and 5.1% for artificially inseminised (AI) beef sires when mated with dairy heifers, dairy cows, beef heifers and beef cows, respectively. These differences in incidence are due to farm management factors and genetics. CD can be reduced by different means: at farm level by appropriate management procedures, but breeding plays a key role specially in sire selection; at industry level through genetic selection programmes. CD is a complex trait affected genetically by direct and maternal effects (Lopez de Maturana et al., Reference Lopez de Maturana, Ugarte and Gonzalez-Recio2007). Breeding can reduce CD incidence in the short and long term (Dekkers, Reference Dekkers1994). Furthermore, generally countries with selection indexes which include CD usually have lower prevalence (Mee, Reference McHugh, Kearney and Berry2008), and there is an increasing interest in including CD traits in breeding programmes (i.e. Sadeghi-Sefidmazgi et al., Reference Sadeghi-Sefidmazgi, Moradi-Shahrbabak, Nejati-Javaremi, Miraei-Ashtiani and Amer2012; Yao et al., Reference Yao, Weigel and Cole2014).
Breeding objectives usually use a linear economic weighting on CD as a percentage of expected difficult calvings, derived from the additional cost of difficult calvings expected from a 1% increase in CD (e.g. Amer et al., Reference Amer, Simm, Keane, Diskin and Wickham2001; Cole et al., Reference Cole, Wiggans, VanRaden and Miller2007). For example, the Irish Cattle Breeding Federation (ICBF) economic value of direct CD is −€4.65 and of maternal CD is −€2.26 per 1% change of CD incidence. This linear weighting on CD suggests that at any level of CD, a 1% increase in CD has the same degree of negative impact for farmers. Anecdotally, there is a view that farmers in Ireland are prepared to tolerate a low level of CD but rapidly become adverse to selecting bulls for AI when there is a proven higher risk of CD. This implies a non-linear relationship between farmer utility and the genetic merit of bulls for CD. Because predictions of genetic merit in Ireland work across breed (Cromie et al., Reference Cromie, Kearney, Evans and Berry2014; Evans et al., Reference Evans and Pabiou2014), and because different breeds are highly divergent in their genetic merit for CD (Mee, Reference McHugh, Kearney and Berry2008; Bleul, Reference Bleul2011), getting the correct weighting on CD in industry-level indexes is critically important.
An alternative to the traditional linear economic value approach to determine the CD penalty is to complement the economic models with the analysis of farmer perceived on-farm impacts of CD. This would potentially capture a more comprehensive view of CD consequences including not only direct costs of CD (due to loss of milk, cull cow, etc.), but also factors as animal welfare or labour inconveniences which are otherwise difficult to give a monetary value (hereafter ‘non-economic consequences’). Survey approaches to understand the motives behind farmer decision making have been used to inform strategies to improve farm performance in a variety of areas (i.e. Barnes et al., Reference Barnes, McCalman, Buckingham and Thomson2013; Martin-Collado et al., Reference Martin-Collado, Byrne, Amer, Santos, Axford and Pryce2015). Finally, it is increasingly acknowledged that the consideration of farmer views and preferences is critical to increasing the uptake of breeding tools (Duguma et al., Reference Duguma, Mirkena, Haile, Okeyo, Tibbo, Rischkowsky, Sölkner and Wurzinger2011; Nielsen et al., Reference Mee, Berry and Cromie2013).
The aim of this study was to explore dairy and beef farmer views and perceptions on the economic and non-economic consequences of CD, to ultimately inform future genetic selection tools for the beef and dairy industries in Ireland. The cattle industries of Ireland are of particular interest, because of the relatively high use of beef sires in dairy herds, and the wide spread of CD genetic merit across dairy and beef breeds (Evans and Pabiou, Reference Evans, Kearney, McCarthy, Cromie and Pabiou2012). In particular, a structured online farmer survey was designed to obtain a better understanding of the following aspects:
-
(i) Farmer views on the economic and non-economic consequences of CD on their farms, their acceptance of the current incidence level and their willingness to change it.
-
(ii) The importance farmers give to CD traits in genetic selection decisions for the beef and dairy industries.
-
(iii) The perceived on-farm consequences of different degrees of CD and its relationship with the use of sires with different CD breeding values.
With this understanding, there would then potentially be an opportunity to construct an overall merit index including a non-linear weighting on CD.
Material and methods
A standardised quantitative online survey was released to 10 600 Irish herd-owners with e-mail addresses on the ICBF database during the 3rd week of February 2015. In the 1st week of April an advertisement with a link to the survey was put up on the main ICBF web page. The link was closed during the 3rd week of April. The survey was designed to determine the key components of farmer views on CD and a number of farm and farmer profile characteristics which might be related to those views. The survey consisted of the four sections described below.
Survey section 1. Farm and farmer profile characteristics
This section gathered data about the main farm enterprise (dairy v. beef), whether or not dairy farmers would mate beef bulls to dairy cows and/or heifers, the number of cows and heifers calving (averaged for the last 3 years), the use of AI and whether AI was implemented by the farmer, a technician or both. It was assumed that farmers who stated that they would use beef sires on dairy are actually using them. Farmers were also asked about their age, and if they were full-time or part-time farmers and if they hired employees. Part-time farmers were asked about the proportion of their total working time spent on their farm.
Survey section 2. Perceived on-farm economic and non-economic consequences of calving difficulty and willingness to change its incidence
The second section analysed farmer views on the relevance of on-farm CD consequences, the acceptance of current levels of on-farm CD, and willingness to change on-farm CD incidence. First, farmers indicated how happy they were with the incidence of CD on their farm at the time of the survey using a seven-level Likert-type scale: ‘extremely unhappy’, ‘happy’, ‘unhappy’, ‘somewhat unhappy’, ‘neither happy nor unhappy’, ‘somewhat happy’, ‘extremely happy’. Second, farmers assessed in four questions, on a 1 to 10 scale (1-minimum importance to 10-maximum), the relevance that an increase in CD incidence would have on their farms in terms of (a) additional labour due to an increased requirement for cow and heifer observation during the calving season, (b) additional labour due to a higher need for assistance during calving, (c) economic consequences due to loss of milk, cull cow costs, etc. and (d) animal suffering. Finally, farmers indicated their level of agreement, using a seven-level Likert-type scale, with the following four statements that described scenarios of CD incidence change:
-
∙ I would like to slightly increase the value of the calves on my farm even though it implies a slight increase of all grades of CD.
-
∙ I would like to slightly decrease all grades of CD on my farm even though it implies a slight decrease in calf value.
-
∙ I would like a significant increase in the value of the calves on my farm even though it implies a significant increase in all grades of CD.
-
∙ I would like a significant decrease all grades of CD on my farm even though it implies a significant decrease of calf value.
Survey section 3. Relevance of sire selection criteria and calving difficulty predicted transmitting ability
In the third section of the survey farmers assessed, on a 1 to 10 scale, the importance/relevance of seven general criteria for selecting AI and natural mating bulls: sire physical appearance, traits with predicted transmitting ability (PTA) values, reliability of PTA values, breeding indexes, sire breed, AI technician advice and advice from breeder of bull. PTA is the predicted difference of a parent animal’s offspring from average, due to the genes transmitted from that parent. Then, farmers assessed (using the same 1 to 10 scale) the importance/relevance that calving difficulty PTA and its reliability have when selecting dairy sires. Farmers also assessed the importance/relevance of the Economic Breeding Index (EBI) when selecting dairy sires in order to be able compare the importance of calving difficulty PTA with the official dairy industry index (Berry et al., Reference Berry, Shalloo, Cromie, Olori, Veerkamp, Dillon, Amer, Evans and Kearney2007). Finally, farmers assessed the importance of calving difficulty PTA, and its reliability for selecting beef sires using carcase PTA as the key trait to compare with.
Survey section 4. Perceived economic value of calving difficulty incidence and maximum acceptable level of calving difficulty incidence
Farmers were asked what extra financial value for the calf (from a choice of eight categories: 10, 25, 50, 75, 100, 200, 300 or 400€) they would need before accepting sires for mating with different PTA values for CD. The calving difficulty PTA values are currently reported as an expected percentage of difficult calvings, transformed from an underlying 1 (no assistance required) to 4 (veterinary assistance or caesarean required) scale (Supplementary Tables S1 and S2). They were asked to assess sires with 1%, 2%, 3%, 4%, 5% and 10% calving difficulty PTA for dairy heifers and dairy cows, and sires with 1%, 2%, 3%, 4%, 5%, 10%, 15% and 20% calving difficulty PTA for beef heifers and beef cows. They were also given the option to say that a given PTA value was unacceptable irrespective of the increased calf value. The extra value for the calf was assumed to indicate the perceived economic value per cow of on-farm CD incidence. To ensure that farmers knew the relationship between the sire calving PTA values and the percentage of animals needing moderate or severe assistance, they were referred to tables which showed the relationship between bull calving difficulty PTA and the actual level of calving assistance and calving difficulty in heifers and cows in the Irish industry (Supplementary Tables S1 and S2).
Survey outcomes analysis
Differences in the CD views were expected among beef farmers, dairy farmers who would mate beef bulls to dairy cows/heifers, and dairy farmers who would not mate beef bulls to dairy cows/heifers. Therefore, special emphasis was placed on analysing differences among those farmer groups. Descriptive statistics were used to summarise survey results. Differences between the aforementioned farmers groups were analysed using an ANOVA test for parametric variables, Wilcoxon’s test for non-parametric variables and χ 2-test for categorical variables. The relationships between farm and farmer profile characteristics and views on CD were also investigated, by computing Spearman correlation coefficients (Spearman’s r) or by analysing differences between farmer groups where possible (e.g. farmers using AI v. farmer only using natural mating sires).
Results
Off the 446 farmers logging in to the survey web page, 271 farmers completed it; 173 were beef farmers and the remainder 98, dairy farmers. The majority of the dairy farmers (75%) indicated that they would be prepared to use beef sires.
Farm and farmer profile
Across all respondents, dairy farms were larger and more business oriented (in terms of employees hiring and farmer working-time; full-time/part-time) than beef farms. Dairy farms had an average size of 85 dairy cows, used AI (97% of dairy farms) which is usually carried out by the farmer (40%) or in combination with a technician (15%). Dairy farming was the main economic activity of most farmers (89% full-time farmers), and hiring employees was quite common (45%). Conversely, beef farms were smaller (average size 28.5 beef cows, ANOVA P-value<0.001), and the use of AI was less widespread than in dairy farms, although it was still common (69% of beef farm used AI, χ 2 P-value<0.001). Beef farming was the main economic activity of a smaller proportion of farmers (62% of farmers reported to be part-time farmers, χ 2 P-value<0.001), and these dedicated an average of 40% of their total working time to beef farming. Finally, hiring employees was less common in beef farms than in dairy farms (87% of beef farmers did not hire employees, χ 2 P-value<0.001). There were no differences between dairy and beef farms regarding the age of farmers. The average age of both beef and dairy farmers was between 41 and 50 years. The profile of dairy farms using beef bulls and those not using them was similar, except for farm size. Dairy farms not using beef bulls tended to be larger (average size 115 cows) than farms using beef bulls (average size 75 cows, ANOVA P-value=0.065).
Perceived on-farm economic and non-economic consequences of calving difficulty and willingness to change its incidence
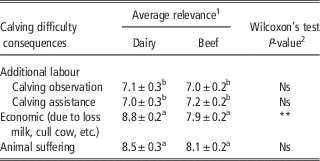
All consequences of CD incidence were stated to be on average highly relevant (above 7 in a 1 to 10 scale) for both dairy and beef farmers, but the economic and animal welfare consequences were considered more important than the additional labour either due to calving observation or to calving assistance (Table 1). Negative economic consequences were more relevant to dairy farmers (average 8.8) than to beef farmers (7.9), whereas non-economic consequences were equally relevant for both types of farmers. No differences were found between dairy farmers using beef sires and those not using beef sires.
Average relevance of on-farm calving difficulty consequences

a,bValues within a row with different superscripts differ significantly at P<0.05 in a Wilcoxon’s pairwise test.
1 Measured on a 1 to 10 scale with 1 being minimum relevance and 10 being maximum relevance.
2 P-values for differences between dairy and beef farms.**P < 0.01.
The size of the dairy farm (measured in terms of number of cows) was related to the relevance farmers gave to the different consequences of CD. The larger the dairy farm, the more relevant was the additional labour required due to the increased CD incidence. Spearman’s r between number of dairy cows in the herd and the relevance value given to the increase in calving observation and calving assistance were 0.2 and 0.16, respectively. Conversely, on beef farms the size of the farm was not found to be related to the perceived relevance of on-farm CD consequences.
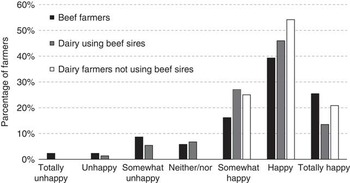
Most farmers stated that they were happy with the current level of CD incidence on their farm, but there were some differences between beef farmers, dairy farmers using beef sires, and dairy farmers not using beef sires (Figure 1). Beef farmers seemed to be less happy with their current CD incidence compared with dairy farmers; 13% of beef farmers stated that they were unhappy (‘totally unhappy’, ‘unhappy’ or ‘somewhat unhappy’) compared with 5% of dairy farmers. However, there were also fewer dairy farmers (15%) than beef farmers (25%) totally happy with the incidence of CD on their farm. Dairy farmers using beef sires on dairy cows were less happy about on-farm CD incidence when compared with those not using beef sires, which might indicate that dairy farmers using beef sires are experiencing a higher incidence of CD.
Acceptance of currently experienced calving difficulty incidence across beef and dairy farms.

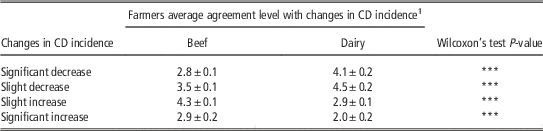
Interestingly, although beef farmers seemed to be less happy with the incidence of CD than dairy farmers, beef farmers more strongly supported the option of a slight increase in the value of calves (even if it implies a slight increase in CD) than any other option. Conversely, dairy farmers mostly supported a decrease (either slight or significant) in CD incidence on their farms even if it implies a decrease in calf value (Table 2). No differences were found between dairy farmers using beef sires on dairy cows and those not using beef sires. Again, the size of the dairy farm (measured in terms of number of cows) was related to the willingness to change on-farm CD incidence. The larger the dairy farm, the more farmers agreed with significantly (Spearman’s r=0.11) and slightly (0.20) decreasing the incidence of CD and the less they agreed with slightly (−0.17) and significantly (−0.20) increasing calf value. However on beef farms, farm size was not found to be related to willingness to change CD incidence. Finally, for dairy farmers there was a significant Spearman’s r between the level of happiness with the current level of CD and the willingness to change it, which did not show up in responses from beef farmers. The happier a dairy farmer was with the current CD incidence on-farm, the more support the dairy farmer gave to a slight increase of calf value and its associate CD increase (Spearman’s r=0.18), and the less support to a significant decrease of CD level (−0.17).
Farmer desired changes in calving difficulty (CD) incidence and their associated change in calf value

1 Agreement scale ranged from 1, totally disagree to 7, totally agree (2, disagree; 3, somewhat disagree; 4, neither agree nor disagree; 5, somewhat agree; and 6, agree).***P < 0.001.
Relevance of sire selection criteria and calving difficulty PTA
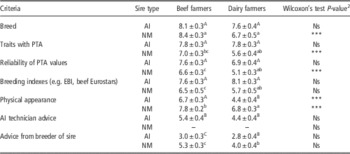
Globally, the physical appearance and the breed of the sires seemed to be more important for beef farmers than for dairy farmers, and when selecting sires for natural mating beef farmers gave more importance to PTA than dairy farmers (Table 3). When selecting AI sires, both beef and dairy farmers gave equally high importance to traits with PTA values, to the reliability of PTA values, to breeding indexes and to the breed. However, beef farmers gave equally high importance to the physical appearance of the AI sires, whereas dairy farmer gave it a lower level of importance. Differences between beef and dairy farmers on the importance they gave to sire selection criteria were larger when selecting sires for natural mating, as opposed to for AI. Dairy farmers gave the highest importance to the breed and the physical appearance of the natural mating sire and intermediate importance to traits with PTA values, its reliability and breeding indexes. Beef farmers gave the highest importance to the breed, the second highest to the physical appearance of the sire and to PTA traits and a third level of importance to the reliability of PTA values. Finally, advice from the breeder of the sire or the AI technician was the least important criteria for both beef and dairy farmers when selecting either AI or natural mating sires.
Average importanceFootnote 1 given by dairy and beef farmers to sire selection criteria

AI=artificial insemination AI; NM=natural mating; PTA=predicted transmitting ability; EBI=Economic Breeding Index.
A,B,CImportance value for AI sires within a column with different superscripts differ significantly at least at P<0.05 in a Wilcoxon’s pairwise test.
a,b,cImportance value for natural mating sires within a column with different subscripts differ significantly at least at P<0.05 in a Wilcoxon’s pairwise test.
1 Criteria importance was measured on a 1 to 10 scale with 1 being minimum importance and 10 maximum.
2 Wilcoxon’s test of the difference between beef and dairy farmers.***P < 0.001.
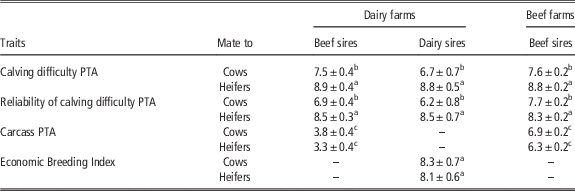
A sire’s calving difficulty PTA (and its reliability) was consistently more important when selecting sires for mating to heifers than when mating to cows, regardless of being beef or dairy sires (Table 4). For dairy farmers, the importance of the dairy sires’ calving difficulty PTA was comparable with the importance of EBI when mating sires to heifers. However, when mating dairy sires to cows, EBI was more important than the sire calving difficulty PTA. Regarding beef sires on dairy farms, the calving difficulty PTA and its reliability were more important than the carcase PTA, irrespective of whether the sire was being mated to dairy cows or heifers. Conversely, for beef farmers, the carcass PTA of beef sires was more important than for dairy farmers; however it was still less important than the calving difficulty PTA and its reliability for both beef cows and heifers.
Relative importanceFootnote 1 of calving difficulty predicted transmitting ability (PTA) and its reliability when selecting sires

a,b,cTrait importance value within a column with different superscripts differ significantly at P<0.05 in a Wilcoxon’s pairwise test.
1 Assessed by farmers on a 1 to 10 scale being 1 minimum and 10 maximum importance.
Perceived economic value of calving difficulty incidence and maximum acceptable level of calving difficulty incidence
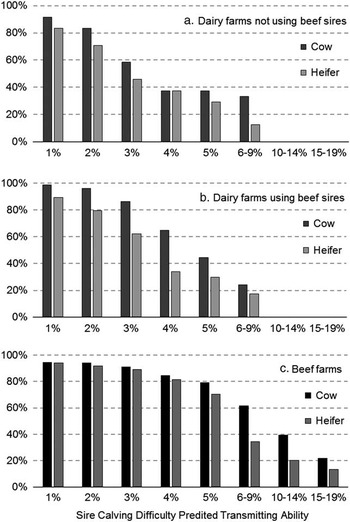
Farmers stated a higher tolerance for the use of sires with high calving difficulty PTAs in cows than in heifers and on beef farms than on dairy farms (Figure 2). Within dairy farms, farmers using beef sires tolerated higher levels of sire calving difficulty PTAs than farmers who did not use beef sires. Over 60% of beef farmers would accept sires with a 6 to 9% calving difficulty PTA when mating them to cows, and 5% calving difficulty PTA when mating them to heifers. Conversely, on a dairy farm not using beef sires, sires had to have a 3% or less calving difficulty PTA to be acceptable by at least 60% of the farmers to be used on dairy cows, and 2% or less calving difficulty PTA to be used on dairy heifers.
Percentage of beef and dairy farmers that would accept the use of sires with different calving difficulty PTA values if they get extra calf value.

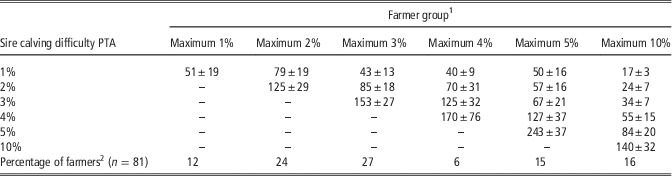
The perceived economic value of CD incidence per cow (measured as the amount of extra value per calf required to offset the use of difficult calving sires) came through as extremely high (see Table 5 and Considerations about online surveying in discussion section). However, regardless of the specific monetary values, the perceived economic value of CD incidence depended on the level of CD incidence that farmers considered unacceptable. The higher the maximum sire calving difficulty PTA value a farmer found acceptable, the lower the increased level of calf value the farmer required to use sires with a value below that maximum (Table 5). For example, the extra calf value required to accept a sire for use on dairy heifers where the sire’s calving difficulty PTA was 2% was, on average, €125 for the farmers whose maximum value acceptable was 2%, whereas for farmers who would accept sires with a 10% calving difficulty PTA, the extra calf value required was, on average, €24.
Average extra calf value (€) required by dairy farmer groups to use sire with calving difficulty predicted transmitting ability (PTA) above 0% on dairy heifers

1 Groups according to the maximum sire calving difficulty PTA value that they would accept to use the sire on a dairy heifer regardless of the extra calf value achieved.
2 In all, 17 dairy farmers did not answer this question.
Discussion
Farmer views of calving difficulty
Both dairy and beef farmers considered CD a very important issue with economic and non-economic consequences. However, there were differences between farmers; CD was seen as more problematic by dairy farmers, who mostly preferred to slightly reduce its incidence, than by beef farmers, who were supportive of increases in calf value even though it would imply a slight increase in CD incidence. All on-farm economic and non-economic consequences of CD were found to be highly relevant for beef and dairy farmers, but dairy farmers perceived economic consequences as being more relevant than beef farmers, which might be due to the fact that in dairy, calf sales are only a modest proportion of total income and the benefits of increasing the calf value does not offset the risk of decreasing milk production due to CD problems. Interestingly, although negative consequences of CD are considered highly relevant, most farmers are happy with the current incidence of CD. This might reflect that farmers, while happy with their current level of CD, are conscious of the high risk of negative consequences if incidence increases. In contrast to how it may appear, being happy with the current level of calving incidence does not mean that farmers are not willing to modify it, and beef and dairy farmers were willing to modify it in opposite directions. Most beef farmers supported a slight increase in calf value, which implies that the cost-benefit economic optimum of calving difficulty-calf value in beef is perceived to be a bit higher than the current CD level. Conversely, dairy farmers supported a slight or significant decrease in CD, implying that the CD economic optimum for dairy farmers is perceived to be a bit lower than the current incidence level.
Dairy farms using beef sires were found to be less happy with their current level of CD than dairy farmers only using dairy sires. However, no differences were found in their perception of the consequences of CD or in their desires to change incidence levels, maybe meaning that farmers accept the consequences of using beef sires. Farm size was found to be related to dairy farmer views of CD with larger farms seeing calving difficulty as more problematic than smaller farms, maybe due to the fact that calving observation and assistance can be more logistically complex when the number of dairy cows is higher. Note that dairy farms using beef sires tended to be smaller (average size=75 dairy cows) than farms only using dairy sires (115 dairy cows, ANOVA P-value<0.01) so some of these effects on CD views might be cofounded. In beef, we did not find any relationship between farm size and farmer views of CD, maybe because they are substantially smaller than dairy farms and are not usually a full-time venture.
Study applications in the development of breeding indexes
The survey results showed that farmers acknowledged the importance that breeding and specifically the use of calving difficulty PTA values has on managing CD. This fact reaffirms the focus that ICBF gives to CD in the development of cattle breeding indexes and should motivate others to consider including CD in breeding programmes where it has not been included yet. The importance farmers give to calving difficulty PTA values compared with other key genetic traits is related to the two major factors influencing CD incidence; calf birth weight and whether the calf’s dam is a heifer or a cow, as has also been seen in other studies (e.g. Nix et al., Reference Nielsen, Amer and Byrne1998; Mee et al., Reference Mee2008; Bleul, Reference Bleul2011). CD PTA was reported to be critical for selecting beef sires to mate with either beef or dairy cows, which are expected to give rise to larger calves, whereas when selecting dairy sires, EBI was more important. Regarding parity, calving difficulty PTA became the key genetic trait when selecting both beef and dairy sires to mate to either beef or dairy heifers, likely due to the higher incidence of CD in heifers compared with cows (Berger et al., Reference Berger, Cubas, Koehler and Healey1992; Nix et al., Reference Nielsen, Amer and Byrne1998), and to worse consequences of problems at calving in primiparous cows which lead to increase culling rates during first lactation (Lopez de Maturana et al., Reference Lopez de Maturana, Ugarte and Gonzalez-Recio2007).
There is still considerable variability in the importance farmers give to calving difficulty PTA values that could not be explained by the farm type or the type of sire used. Even within beef or dairy farmers, farmers have rather variable sensitivity to sire calving difficulty PTA values, ranging from farmers that would not even accept sires with low calving difficulty PTA values no matter the increase of calf value, to farmers that would use sires with very high values if the calf value is high enough. Intrinsic farmer differences in dairy genetic trait preferences that are independent of obvious farmer categorisations have also been observed and reported recently for Australia (Martin-Collado et al., Reference Martin-Collado, Byrne, Amer, Santos, Axford and Pryce2015).
This variable sensitivity to sire calving difficulty PTA confirms that the farmer decision-making process is influenced by non-economic motives. The lower the maximum sire calving difficulty PTA value a farmer found acceptable, the higher the extra calf value required by the dairy farmer to use that sire (Table 5), which might be related to a larger perceived non-economic component of CD. Note that the perceived economic value of CD incidence per cow came through as extremely high which is probably due to the non-economic component of CD explained above, but also due to bias caused by the hypothetical nature of the preference elicitation process (Guzman and Kolstad, Reference Guzman and Kolstad2007), and to limitations of the survey design resulting in misinterpretation of the questions asked (Suchman and Jordan, Reference Suchman and Jordan1990). Furthermore, misunderstanding might be even more common in online surveys where non-directive probing cannot be made.
Regardless of the specific monetary values, results of this study indicate clearly that the perceived economic value associated with incremental increases in CD increases substantially as the CD level considered increases (Table 5). This non-linear relationship cannot be reflected in a standard linear index weighting (Amer et al., Reference Amer, Simm, Keane, Diskin and Wickham2001), and this is exacerbated in the Irish farming situation, where there is a wide diversity in CD genetic merit across cattle breeds, and dairy farmers in particular make sire choices spanning the full spectrum of these breeds. Work is currently underway to investigate the deployment of a non-linear index weighting for CD in national indexes used for breeding in Ireland (Hely et al., Reference Hely, Evans, Amer and Cromie2015). The deployment of non-linear selection index approaches in the context of breeding for sheep prolificacy has also been addressed by Martin-Collado et al. (Reference Martin-Collado, Byrne, Visser and Amer2016). The results of this survey provide key underpinning support for the approach taken.
Considerations about online surveying
Although the number of farmers that completed the survey was sufficiently large (271) to get an overview of the industry perceptions of CD, we had a low response rate (0.026) to the invitation to do the survey. Given the relevance of the issue, as depicted by ICBF of which contacted farmers were members, a higher response rate was expected. Low response rates (0.09) were also seen in other studies using online surveys to research a topic of Australian farming industry interest (Martin-Collado et al., Reference Martin-Collado, Byrne, Amer, Santos, Axford and Pryce2015). This lack of farmer willingness to engage in online surveys held by their Farmer Federations might be related to farmers being overwhelmed by industry bodies and companies using the internet to engage farmers on activities or to sell products and services. In this context, Evans and Mathur (Reference Evans and Mathur2005) warned that even when the e-mails come from a trusted organisation, it is likely that people do not distinguish between a legitimate survey and a spam message. Another aspect to consider is that the sampling control of online surveys is low (Vaske et al., Reference Vaske, Jacobs, Sijtsma and Beaman2011). Furthermore, farmers using the internet might not truly represent the general population (Evans and Mathur, Reference Evans and Mathur2005), which might undermine the sample representativeness. Still, in our case, average size of the sampled dairy (85 cows) and beef (28) farms was very not far from national averages (68 cows for dairy and 26 for beef farms; Hanrahan et al., Reference Hanrahan, Hennessy, Kinsella and Moran2013). We have been extremely cautious in not extrapolating exact figures, but have noted general trends of the outcomes of the survey.
In conclusion, online surveys are very appealing for research and industry consultation because they achieve potential sample sizes larger than other methods, they are faster, more cost-effective and provide a high degree of automation of the experiment (Reips, Reference Reips2002; Kraut et al., Reference Kraut, Olson, Banaji, Bruckman, Cohen and Couper2004). However, online surveying also has some limitations, including those discussed above as well as design methodological issues (Reips, Reference Reips2002; Kraut et al., Reference Kraut, Olson, Banaji, Bruckman, Cohen and Couper2004), which researchers have to carefully consider when employing them. One option for Farmer Institutions to overcome the online surveys limitations regarding representativeness and avoiding overwhelming farmers with too much e-mailing, would be to form a constant representative sample of the farmer population which would be periodically surveyed to monitor and research issues of industry interest.
Acknowledgements
Financial support for the survey implementation in this study was provided by the Irish Cattle Breeding Federation Society Limited.
Supplementary Material
For supplementary material/s referred to in this article, please visit http://dx.doi.org/10.1017/S1751731116001567