Implications
The outputs of volatile fatty acids from the ruminal fermentation of dietary hexoses are poorly predicted, although they are of major importance as they determine animal performance. Quantifying the impact of major biotic and abiotic factors, including possible interactions or curvilinear effects, on fermentation yields can contribute to a better modelling of these outputs
Introduction
Whatever the ruminant production system, the outputs of volatile fatty acids (VFA) from the ruminal fermentation of dietary hexoses strongly determine the animal performance from physiological and environmental viewpoints. The VFA absorbed from the gastrointestinal tract account for 65% to 75% of the metabolizable energy supply to the ruminant (Bergman, Reference Bergman1990). Moreover, since they undergo different metabolic fates in gluconeogenesis and lipogenesis, the partitioning of C among fermentation end-products affects ruminant energy metabolism. Rumen fermentation has proven elusive to model accurately enough to meet practical predictive purposes (Alemu et al., Reference Alemu, Dijkstra, Bannink, France and Kebreab2011) and further quantitative investigation is required to understand how abiotic, that is chemical and electrochemical potentials, and biotic factors interact to impact VFA rumen outputs. While developing a model of rumen fermentation based on thermodynamic laws, Offner and Sauvant (Reference Offner and Sauvant2006) stressed that the way pH and redox potential (Eh) interact on the rumen fermentation process was still an issue. Information from an experimental design combining both features in mixed rumen microbial cultures is indeed lacking. Another important yet understudied abiotic factor that may influence rumen fermentation is the partial pressure of dihydrogen (H2) because it influences the re-oxidation of NADH to NAD+, a key coenzyme in microbial glycolysis. A study of biotic agents raises the issue of their identification as they are not limited to any single microbial subgroup in the rumen. As a first approach, we have indirectly considered them from a nutritional viewpoint because the species composition and metabolic activity of rumen microbiota strongly depends on the nature and amounts of carbohydrate sources in the ruminant diet (Leedle et al., Reference Leedle, Barsuhn and Hespell1986).
The present study was thus designed to evaluate the effects of pH, Eh and partial pressure of H2 on in vitro rumen fermentation, taking into account interactions and curvilinear effects. A second aim was to determine the role played by rumen microbiota in the expression of these effects, by testing inocula grown on three feeds differing in the carbohydrate source and natureNDF content of 500 v. 250 g/kg DM and wheat v. maize) which attempted to supply a microflora adapted to fibre, slowly degradable starch or readily degradable starch as the dominant dietary polysaccharide.
Material and methods
Experimental design
All the experimental runs were conducted in 6 h incubations of mixed rumen microorganisms. The role of rumen microbiota in the fermentation yields was assessed by comparing three batch cultures differing in inoculum type, each adapted to one of the three substrates. The feeds were mainly composed of pelleted orchard grass hay, alfalfa hay and either wheat or maize in varying proportions (Table 1) which resulted in a contrast in the NDF content (500 v. 250 g/kg DM) or, for the low-fibre diets, by the nature of the cereal (wheat v. maize). Hence, they were assumed to induce microflora growing preferentially either on fibre (W-HF), slowly degradable starch (M-LF) or readily degradable starch (W-LF) in continuous cultures systems. All experiments were run simultaneously to reduce uncertainty in the factor levels and to avoid the effects of uncontrolled variation in experimental conditions.
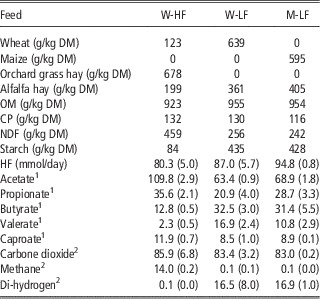
Composition of the feeds and fermentation yields in continuous cultures

W=wheat; HF=hexoses fermented in the continuous cultures; M=maize; OM=organic matter.
1 Individual fermentation end-product yields expressed in moles/100 moles HF.
2 Molar proportions expressed in moles/100 moles fermentation gases Values in brackets: s.e.
Four treatment factors were combined in each diet-adapted batch culture. Three factors were quantitative: (a) the initial medium pH set at 5.8, 6.3 or 6.8, (b) the buffer redox potential (Eh) set at three levels equally spaced within a 50 mV interval centred on −300 mV in W-LF and M-LF cultures and on −380 mV in W-HF cultures and (c) the initial partial pressure of dihydrogen in the culture tube headspace, set at 0, 0.5 or 1 kPa. The 4th factor, which was the mode of glucose supply to microbes, was qualitative. Instead of providing poly- or disaccharides such as starch, cellulose, cellobiose and maltose, the buffer solution contained glucose as the sole energy source so as to bypass the enzymatic hydrolysis and conversion steps preceding the Embden–Meyerhof–Parnas glycolytic pathway. Because this culture condition was unusual in the field of in vitro rumen studies and the effect of glucose concentration on the course of fermentation was poorly documented, we tested two modes of glucose supply. The same amount of glucose, 0.5 mmol per tube was introduced either once at the beginning of incubation (initial concentration of glucose 5.625 g/l) or in two equal fractions at the beginning and at the midterm point of incubation, that is 3 h. In order to estimate all main effects and first-order interactions, as well as the quadratic effects of pH, Eh and H2 partial pressure, the treatment factors were arranged in a 24-run fractional factorial design (Supplementary Table S1) by means of an exchange algorithm (Mitchell and Bayne, Reference Mitchell and Bayne1978) provided by NEMROD software (LPRAI, Marseille, France). Two constraints were introduced into the process of design selection for practical reasons. First, the number of runs per day was limited to 12 because the three batch cultures were to be performed simultaneously. As a consequence, the incubation day was introduced as a blocking factor. Second, the maximal number of levels for each quantitative treatment was set at 3. The 24 runs were independently replicated, generating a data set of 48 observations per experiment. The total number of incubation days was 4.
Incubation procedure
Care and handling of the cows followed the procedures approved by the French Ministry of Agriculture in agreement with French regulations for animal experimentation (guideline 19/04/1988). The 72-ml culture tubes were inoculated with coarsely filtered samples of rumen microflora maintained in dual-flow continuous culture systems, in an effort to standardize microbial inocula and characterize fermentation yields. For this purpose, 7 days before batch incubations, 1.5-l quantities of rumen contents were collected by accredited personnel from two dry Holstein cows fed on 400 g/kg maize silage, 500 g/kg concentrate and 100 g/kg alfalfa hay. Rumen contents were pooled, coarsely filtered on a 1 mm sieve under a CO2 atmosphere, and introduced into six dual-flow continuous culture systems. The dual-flow continuous culture systems (working volume of 1.1 l) were permanently infused with a mineral buffer solution (Broudiscou et al., Reference Broudiscou, Papon and Broudiscou1999) so as to set particle and liquid phase dilution rates at 0.03 and 0.06/h, respectively. Each experimental feed was randomly assigned to two continuous culture systems. The feeds provided 25.6 g of organic matter (OM) and 3.5 g of CP each day, in two equal portions at 1100 h and 2300 h. The normal course of fermentation in continuous culture systems was checked by measuring the daily amounts of hexoses fermented and the fermentation pattern. For this purpose, after an adaptation period of 6 days, whole effluents were sampled on 3 days, mixed with 0.25 volume of H3PO4 (410 g/l), and stored at −20°C until VFA analysis. Fermentation gases were collected on days 7 and 8, and their compositions were determined.
The day before the first batch incubation, we determined the amounts of l-cysteine HCl necessary to adjust the initial Eh in cultures tubes to the levels planned in the experimental design. The three inoculum types were collected anaerobically and were divided into 50-ml aliquots which received 0, 40 or 80 mg cysteine. The pH of each aliquot was adjusted successively at 6.8, 6.3 and 5.8 and the Eh was recorded for each set point (platinum half-cell electrode Mettler, Switzerland). For each inoculum, the relations between Eh, pH and cysteine concentration (0, 0.8 or 1.6 g/l) were empirically modelled by adjusting polynomials to experimental data sets. The following equations were used to calculate the amounts of cysteine HCl to be added to the 18 buffer solutions used in batch experiments:
 $${\rm Eh}={\rm 356}\,-\,{\rm 63}.{\rm pH}\,-{\rm 88}.{\rm Cys}{\plus}{\rm 3}0.{\rm Cys}^{{\rm 2}} \,\left( {R^{{\rm 2}} \,\,{\rm of}\,\,0.{\rm 99}} \right)$$
 $${\rm Eh}={\rm 219}-{\rm 43}.{\rm pH}\,-{\rm 167}.{\rm Cys}{\plus}{\rm 63}.{\rm Cys}^{{\rm 2}} \,\left( {R^{{\rm 2}} \,\,{\rm of}\,\,0.{\rm 99}} \right)$$
 $${\rm Eh}={\rm 278}-{\rm 59}.{\rm pH}\,-{\rm 153}.{\rm Cys}{\plus}{\rm 49}.{\rm Cys}^{{\rm 2}} \,\left( {R^{{\rm 2}} \,\,{\rm of}\,\,0.{\rm 99}} \right)$$
where Cys is the cysteine concentration in the fermentation medium, for the W-HF (equation (1)), W-LF (equation (2)) and M-LF (equation (3)) inocula, respectively. Because the response of Eh to l-cysteine input was a decreasing curvilinear function and initial redox potentials were too different among inocula, it was not possible to make Eh converge in all cultures, even by supplying low-NDF cultures with larger amounts of l-cysteine.
Each day of incubation, 300 g per vessel of fermentation contents were anaerobically taken from the continuous culture systems at 1100 h, 12 h after the last feed supply so as to minimize the amounts of endogenous substrate. They were pooled by feed, filtered through a 50 μm mesh nylon gauze and kept at 39°C under a CO2 atmosphere during inoculation. Each filtrate was divided into three aliquots of around 100 ml whose pH was immediately adjusted to 5.8, 6.3 and 6.8 by addition of NaOH 5 N or H2SO4 5 N. Then, each culture tube was anaerobically filled with 12 ml of one of the 9 microbial inocula, 3 ml of the buffer solution of adequate cysteine concentration and 1 ml of a glucose solution (0.5 mol/l or 0.25 mol/l), as planned in the experimental design. The culture tube was sealed with a rubber stopper equipped with a three-way valve and its head space was quickly vacuum-purged before being filled with a gaseous phase containing H2 in the planned partial pressure (0, 0.5 or 1 kPa) and CO2. The tube was then put in a stirring water bath (100 r.p.m., 39°C). All the inocula were sampled and stored at −25°C-until VFA, lactate and ammonia determination. After 3 h of incubation, 1 ml of medium was anaerobically withdrawn from each tube and 1 ml of either buffer or 0.25 mol/l glucose solution was added depending on whether glucose was to be supplied once or twice. At the end of incubation, all the tubes were cooled at +4°C for 30 min to stop fermentation, then 4 ml of fermentation broths were acidified with 1 ml of H3PO4 25% (vol/vol) and immediately stored at −25°C until determination of VFA, lactate and N-NH3.
Chemical analyses
DM contents were determined by oven drying at 105°C for 48 h. OM contents were determined by ashing at 550°C for 16 h. Total nitrogen was determined using the Dumas technique (Sweeney and Rexroad, Reference Sweeney and Rexroad1987) on a LECO model FP-428 Nitrogen Determinator (LECO; St Josef, MI, USA). CP was calculated as Nx6.25. The dietary compounds were analyzed for NDF (Van Soest et al., Reference Van Soest, Robertson and Lewis1991) using a heat-stable α-amylase at 0.2 ml/g DM. Individual VFA and NH3-N concentrations in culture medium were determined by GLC (Kristensen, Reference Kristensen2000) and by colorimetry (Weatherburn, Reference Weatherburn1967), respectively. The fermentation gas composition was determined by gas chromatography on a CP-2003 Micro-GC (Varian, Les Ulis, France) equipped with a 10 m PoraPlot Q module set at 60°C and a 10 m Molsieve 5 Å module set at 55°C, allowing the quantification by thermal conductivity of CO2, H2, O2, N2 and CH4 with helium as the carrier gas.
Calculations and statistical analyses
The amount of hexoses apparently fermented per tube (HF) was calculated from the relation given by Demeyer and Van Nevel (Reference Demeyer and Van Nevel1975) relating HF to VFA production:
 $${\rm HF}\,\,\left( {{\rm \mu mol}} \right)=\left( {{\rm C2}\,{\plus}\,{\rm C3}} \right)/{\rm 2}\,{\plus}\,{\rm C4}\,{\plus}\,{\rm C5}\,{\plus}\,{\rm C6}$$
where C2, C3, C4, C5 and C6 are acetate, propionate, butyrate, valerate and caproate production (µmol), respectively.
Fermentation variables were subjected to multiple linear regression by using the GLM procedure (SAS Institute Inc., Cary, NC, USA). The response variables were HF in µmol and individual VFA yields in moles/100 moles HF. The independent variables were the initial medium pH ( P ), redox potential ( E ), partial pressure of headspace dihydrogen ( H ) and the mode of glucose supply ( G ), the incubation day ( D ) being included as a randomizing block. In order to permit comparison of factors of different natures, the four variables were coded in the interval [−1, +1] as follows. The variable P was related to the actual pH value by the equation:
 $$P=\left( {{\rm pH}-{\rm 6}.{\rm 3}} \right)/0.{\rm 5}$$
Thus for actual values of pH of 5.8, 6.3 and 6.8, P was −1, 0 and 1, respectively. The variables E and H were related in the same manner to the expected values for redox potential and dihydrogen partial pressure, Eh and pH2, respectively, by the equations:
 $$E=\left( {{\rm Eh}{\plus}{\rm 38}0} \right)/{\rm 25}\,\,{\rm in}\,\,{\rm W}{\hbox-}{\rm HF}\,\,{\rm cultures}$$
 $$E=\left( {{\rm Eh}{\plus}{\rm 3}00} \right)/{\rm 25}\,\,{\rm in}\,\,{\rm W}{\minus}{\rm LF}\,\,{\rm and}\,\,{\rm M}{\hbox-}{\rm LF}\,\,{\rm cultures}$$
 $$H=\left( {{\rm pH}_{2} -0.{\rm 5}} \right)/0.{\rm 5}$$
The variable G was set to −1 for a dual supply of glucose and to +1 for a single supply of glucose. Our coding convention associated the value +1 to the values of pH and Eh expected to promote bacterial activity, that is 6.8 and low redox potentials.
Data were fitted to the following 2nd-order polynomial model:
 $$\eqalignno{Y=\,b_{0} {\plus}\mathop{\sum}\nolimits_{i=1}^4 {b_{i} } X_{i} \,{\plus}\mathop{\sum}\nolimits_{i=1}^3 {b_{{ii}} } X_{i}^{2} \cr {\plus}\mathop{\sum}\nolimits_{i=1}^3 {\mathop{\sum}\limits_{j\gt i} {b_{{ij}} } } X_{i} X_{j} {\plus}r_{k} D{\plus}{\varepsilon}$$
where Y was the response, b 0 the intercept, X i the four coded variables P, E, H and G, b i , b ij and b ii , the four main effects, six 1st-order interaction terms, and the three quadratic effects of the factors P, E and H, respectively. The performance of the model fits were checked by analysis of the residuals. The regression coefficient estimates were compared with zero by a Student’s t-test.
All the regression models were generated without omitting any term (equation (9)). However, when the P-value of regression parameters exceeded 0.2 for all response variables in a given results’table, it was not listed to simplify its reading. The polynomial models we used to compare treatment factors, reveal interactions or nonlinear effects and assess their statistical significance. An extensive display of regression parameters would be justified only when intending to predict response variables within the variation space of factors.
Results
The fermentation variables in continuous cultures are given in Table 1. The continuous culture systems on the W-HF diet apparently fermented 80.3 mmol per day of hexoses into 138.5 mmol per day of VFA, mostly C2 and C3, characterized by a C2 : C3 ratio of 3.09. Methane was the major hydrogenated compound in fermentation gases, with only trace amounts of H2. The pH of W-HF fermenters 3h30 after a meal was high, at 6.53. The continuous culture systems on the W-LF diet apparently fermented 87.0 mmol per day of hexoses into 123.7 mmol per day of VFA, with a C2 : C3 ratio of 2.69. However, the fraction of hexose carbon recovered in C5 was numerically higher than with W-HF feed. The pH of W-LF fermenters 3 h 30 min after a meal was 6.23. The continuous culture systems on the M-LF diet apparently fermented 94.8 mmol per day of hexoses into 141.0 mmol per day of VFA, which led to a C2 : C3 ratio of 2.41. The pH of W-LF fermenters 3 h 30 min after a meal was 6.17. In both low-NDF diets, the gas composition was characterized by a strong inhibition of methanogenesis and a high H2 molar proportion.
In the following results section the term ‘central’, when applied to a response variable, refers to the intercept value and corresponds to the calculated response at the centre of the experimental domain. Besides, the response variations highlighted were obtained by changing one factor along its range and using only statistically significant regression parameters, while fixing the three other factors at the centre of the experimental design which means zeroing the associated independent variables in the regression model.
VFA yields in W-HF batch cultures
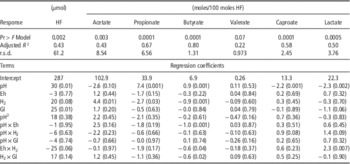
No interaction or quadratic term reached statistical significance. The central amount of HF equalled 58% of the experimental supply of glucose. HF linearly increased with increasing pH (+23% from 5.8 to 6.8), and with glucose supplied in a single pulse (+19%).The yields of major VFA were mainly influenced by pH and H2, in opposite ways. C2 was the predominant end-product. High pH values promoted the production of C3 and C4 more than of C2 and clearly inhibited lactate and C6 production. On the contrary, high H2 partial pressures promoted the production yield of C2 (+8%) to the detriment of C3 and C4. Consequently, the C2/C3 ratio, which averaged 3.0, decreased with increasing pH and decreasing H2 partial pressure. The factors pH and H2 influenced C4 production yield in a complex way, in interaction with Eh and with Eh and Gl, respectively (Table 2).
Effects of pH, Eh, headspace H2 and glucose input mode on the amount of hexoses fermented (HF) and fermentation yields in W-HF cultures

Pr>F: P-value associated with the F-statistic. Regression model:
 $$Y=b_{0} {\plus}\mathop{\sum}\nolimits_{i=1}^4 {b_{i} } X_{i} {\plus}\mathop{\sum}\nolimits_{i=1}^3 {b_{{ii}} } X_{i}^{2} {\plus}\mathop{\sum}\nolimits_{i=1}^3 {\mathop{\sum}\limits_{j\gt i} {b_{{ij}} } } X_{i} X_{j} {\plus}r_{k} D{\plus}{\varepsilon}$$
.
For each regression coefficient, P-value for the null hypothesis is in brackets.
VFA yields in W-LF batch cultures
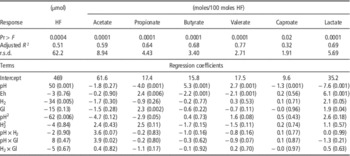
The central amount of HF equalled 94% of the experimental supply of glucose. It increased in a curvilinear way with increasing pH, from 360 µmol at pH 5.8 to 450 to 460 µmol at pH values above 6.2. HF was also linearly modified by H2 partial pressure, decreasing by 68 µmol when H2 partial pressure changed from 0 to 1 kPa. Approximately 45% HF carbon was consumed in the production of minor VFA and lactate, since C2 and C3 productions accounted only for 31% and 9% HF carbon, respectively. C2 production yield was not significantly modified by any factor (P>0.10). The other VFA yields underwent the opposite influences of pH, in a curvilinear way for C3, and Eh. The resulting C2/C3 ratio averaged 3.5 and was mainly influenced by pH, shifting from 5.3 to 3.2 between pH 5.8 and 6.8 (Table 3).
Effects of pH, Eh, headspace H2 and glucose input mode on the amount of hexoses fermented (HF) and fermentation yields in W-LF cultures

Pr>F: P-value associated with the F-statistic.
Regression model:
 $$Y=b_{0} {\plus}\mathop{\sum}\nolimits_{i=1}^4 {b_{i} } X_{i} {\plus}\mathop{\sum}\nolimits_{i=1}^3 {b_{{ii}} } X_{i}^{2} {\plus}\mathop{\sum}\nolimits_{i=1}^3 {\mathop{\sum}\limits_{j\gt i} {b_{{ij}} } } X_{i} X_{j} {\plus}r_{k} D{\plus}{\varepsilon}$$
.
For each regression coefficient, P-value for the null hypothesis is in brackets.
VFA yields in M-LF batch cultures
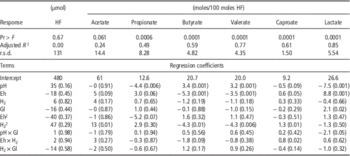
The central amount of HF accounted for 96% of the glucose supply and was not significantly modified by any factor (P>0.15). A large fraction of HF carbon was consumed in the production of minor VFA and lactate (43% at the centre of the domain) while C2 and C3 productions accounted only for 30% and 6% HF carbon consumption, respectively. C2 production yield was not significantly modified by any factor except H2 in a quadratic way. The production yields of the other VFA underwent opposite influences of pH and Eh. The relative productions of C3, lactate and to a lesser extent C6 increased with decreasing pH and Eh, to the detriment of C4 and C5, as in W-LF cultures. The only noticeable difference with W-LF cultures was the quadratic effect of H2 on the fermentation yields of all VFA but C3 (Table 4).
Effects of pH, Eh, headspace H2 and glucose input mode on the amount of hexoses fermented (HF) and fermentation yields in M-LF cultures

Pr>F: P-value associated with the F-statistic.
Regression model:
 $$Y=b_{0} {\plus}\mathop{\sum}\nolimits_{i=1}^4 {b_{i} } X_{i} {\plus}\mathop{\sum}\nolimits_{i=1}^3 {b_{{ii}} } X_{i}^{2} {\plus}\mathop{\sum}\nolimits_{i=1}^3 {\mathop{\sum}\limits_{j\gt i} {b_{{ij}} } } X_{i} X_{j} {\plus}r_{k} D{\plus}{\varepsilon}$$
For each regression coefficient, P-value for the null hypothesis is in brackets.
Discussion
In order for the results to have biological relevance, it was important to set physiologically relevant limits to the ranges of values of the treatment factors. Thus, the initial pH in culture tubes was set within the range, from 5.8 to 6.8 (Hoover, Reference Hoover1986; Shriver et al., Reference Shriver, Hoover, Sargent, Crawford and Thayne1986; Grant and Weidner, Reference Grant and Weidner1992). In the same way, the H2 partial pressure varied from 0 to 1 kPa, a value above which it stymies the recycling of NADH to active NAD+ (Miller and Wolin, Reference Miller and Wolin1995). The control of Eh was less satisfactory due to the uneven effect of cysteine between inocula but could not be improved. Nevertheless, Eh ranges of variation were of physiological significance. By continuously monitoring Eh in the rumen of three dry cows kept on a maize silage/alfalfa hay/concentrate diet (with a NDF content of 388 g/kg DM), Richter et al. (Reference Richter, Krizova and Trinacty2010) observed that the lowest Eh values varied from −291 to −287 mV among animals and the highest Eh from −227 to −256 mV.
Assessing the short-term effect of rumen microbiota on fermentation relied on the ability to differentiate inocula by their fermentative metabolism. The W-HF inocula clearly differed from the two low-fibre ones by the intensity of methanogenesis and the partitioning of hexose C in C2, C4 and minor VFA. The nature of cereal at low fibre level was a less influential parameter. In W-LF and M-LF continuous culture systems, methanogenesis was severely depressed and their microbiota were adapted to high partial pressures of extracellular H2 (Table 1). These differences between inocula were in agreement with the report of Barry et al. (Reference Barry, Thompson and Armstrong1977) who measured in the rumens of hay fed sheep an average dissolved H2 concentration of 0.4 µM, while this concentration was on average 3.3 µM in grain fed sheep reaching concentrations up to 28 µM. High partial pressures of extracellular H2 did not limit hexose fermentation in W-LF and M-LF continuous culture systems although H2 accumulation is postulated to lower the fermentation rate in the rumen by inhibiting the conversion of polysaccharides to fermentable sugars (McAllister and Newbold, Reference McAllister and Newbold2008). Nevertheless, it could explain the shifts in fermentation pattern from C2 and C3, displaying H : C ratios of 1.5 and 1.66, respectively, to C4 and C5 of higher H : C ratios, 1.75 and 1.8, respectively. According to stoechiometry, substituting C4 for C2 and C5 for C3 as the end-products of pyruvate conversion limit the amount of H2 produced from reduced pyridine nucleotides.
Supplying 0.5 mmol/tube of glucose as the sole energy source was validated by the fact that, in all incubations, HF amounts were of the same order of magnitude as initial amounts of glucose and the shunt of polysaccharide degradation to hexoses could be considered satisfactory. The cultures were not carbohydrate-limited, nor were run under excess carbohydrate conditions, although lactate tended to accumulate. The maximal concentration of dietary glucose in the present study was 31.25 mol/l, a concentration well below the toxicity level of 111 mol/l observed in Prevotella ruminicola ammonia-limited cultures (Russell, Reference Russell1992). Although its mode of supply acted on C3 and lactate production in W-LF cultures and on lactate production in M-LF cultures, these actions were of limited biological significance.
The type of inoculum was a major factor of variation in the pattern of fermentation yields. For each type of inoculum, the main characteristics observed in continuous cultures were transferred to culture tubes, in particular the higher number of carbon per VFA in low-fibre cultures. When HF amounts were considered, though, inocula differed less from one another in continuous cultures than in the corresponding batch cultures, probably owing to the influence of polysaccharide degradation kinetics on the subsequent fermentation steps. The average number of C per VFA tended to increase with increasing HF. This cannot be interpreted as the result of energy-excess conditions but is more likely due to possible H2 accumulation with W-LF and M-LF inocula. The amount of lactate present after 6 h was quite high in all incubations and exceeded the productions of C4 in W-LF and M-LF culture tubes. Lactate also exceeded the production of C3. The higher proportion of starch in low-fibre continuous cultures probably favoured the development of microorganisms able to degrade starch and maltose into lactate, such as Selenomonas ruminantium and Streptococcus bovis, two widely distributed bacterial species in the rumen (Hungate, Reference Hungate1966).
The type of inoculum also modulated the impact of abiotic factors on most fermentation variables which fell into two groups. The responses of C3, C4, C5 and lactate production variables to treatment factors differed between the W-HF cultures and the two others. Among low-fibre inocula, the nature of cereal merely influenced the response of HF amounts and C6 fermentation yield to pH and H2. The W-LF cultures had a singular trait, that is the presence of a quadratic effect of pH on hexoses consumption, suggesting the existence of a pH threshold in the control of fermentation processes within the W-LF-adapted microbiota. Irrespective of origin of the inoculum, pH was the most influential treatment factor. The short-term influence of pH on lactate and C2 production may be related to specific effects on key enzymes of the fermentation pathway. The positive effect of low pH on lactate production in W-LF and M-LF cultures is in agreement with the activation of lactate dehydrogenases in a tetrameric configuration, in Selenomonas ruminantium cultures grown at low pH (Russell and Hino, Reference Russell and Hino1985). Lactate accumulation has also been suggested as a common mechanism in anaerobic bacteria to control intracellular pH through hydrogen removal (Thauer et al., Reference Thauer, Jungermann and Decker1977). On the contrary, a low pH inhibits the pyruvate formate-lyase which converts pyruvate into acetate, formate and ethanol (Abbe et al., Reference Abbe, Takahashi and Yamada1982). In W-LF and M-LF cultures, C3 yields were inversely affected by pH, with high pH favouring C3 depletion. In the present study, Eh variations were too limited to challenge rumen bacteria on their tolerance to a weakly reducing environment. Nevertheless Eh appeared to be an active factor in W-LF and M-LF culture tubes, independent of pH. The last factor to be considered, the H2 partial pressure was merely active on the fermentation pattern in W-HF cultures, favouring C2 yield to the detriment of C3.
In conclusion, the effects of environmental factors were dependent on the nature of the inoculum, a major source of variation, more particularly on its adaptation to high or low fibre. These effects were loosely interrelated. The pH being the most determining factor, followed by the redox potential and H2 partial pressure. Ranking the impacts of major biotic and abiotic factors, including possible interactions or curvilinear effects, on fermentation yields can contribute to a better quantitation of fermentation end-products outputs in rumen mechanistic models.
Acknowledgement
The authors are grateful to J. Tessier and his team for the animal care.